


Statistics in Physical Education
- 1. STATISTICS BY : DR. DEV RAJ YADAV (ASSOCIATE PROFESSOR) MMH COLLEGE, GHAZIABAD, U.P
- 2. STATISTICS: Statistics is the study of the collection, analysis, interpretation, presentation, and organization of data. The word STATISTICS is seems to be derived from the Latin word ‘status’ or the Italian word ‘Statista’ or German word ‘Statistik’. All of them means the same thing i.e. a political state. Facts expressed numerically are called statistics such as data related to income, height of a class, weight of a class, etc. However mere facts or aggregate of facts cannot be called statistics. For example 151, 182, 169, 158, 162, 148 etc. are not statistics. But if I say the above digits are the height of students of a particular class then that’s statistics.
- 3. DEFINITION: “Classified facts representing the conditions of a people in a state – especially the facts that can be stated in numbers or any other tabular or classified arrangements”. Merriam- Webster dictionary. “Numerical statements of facts in any department of inquiry placed in relation to each other”. Sir Arthur Lyon Bowley. “Statistics are aggregates of facts affected to a market extent by multiplicity of causes, numerically expressed, enumerated or estimated according to a reasonable standards of accuracy, collected in a systematic manner for a pre-determined purpose and placed in relation to each other” Prof. Horace Secrist. “Statistics may be defined as a science of collection, presentation, analysis, and interpretation of numerical data”. Croxten and Cowden.
- 4. NATURE OF STATISTICS: 1. Statistics are aggregates of facts: only aggregate of fact is statistics rather than individual facts. For example individual weight of a person is not statistics because it cannot be compared and this figure is unrelated. 2. Statistics are numerically expressed: All statistics are numerically expressed. Qualitative expressions, like beauty, honesty, health, intelligence are not statistics unless they are assigned numerical equivalent. However, qualitative expressions can be ranked according to the quality of their attributes.
- 5. 3. Statistics are affected to a marked extent by multiplicity of causes: Statistics (facts and figures) are affected by many factors simultaneously. For example, data related to training of athletes are affected by weather, diet, training program etc. 4. Statistics are enumerated or estimated according to reasonable standard of accuracy: Statistics are numerical statements which can either be enumerated or estimated by the experienced observers. Sometimes when actual measurements of figures is not possible in a particular field of inquiry, then method of estimation is applied. For example, its easy to count 40 students of a class but, when it comes to number of people watching a match in the stadium then we can only use the estimation method.
- 6. 5. Statistics should be collected in a systematic manner: Statistics should be collected in a systematically in a planned way. Data collected in an unsystematic manner would lead to misleading conclusions. 6. Statistics should be collected for a predetermined purpose: Before collecting the data, purpose of their collection should be well-defined and specified, otherwise it would not serve any purpose, rather it would lead to wrong conclusions. 7. Statistics should be placed in relation to each other : Data should be placed in such a way that it can be compared. For example, height of students of different sections of a college.
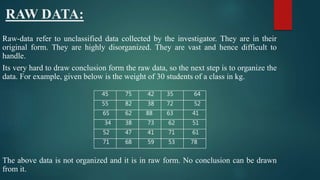
- 7. RAW DATA: Raw-data refer to unclassified data collected by the investigator. They are in their original form. They are highly disorganized. They are vast and hence difficult to handle. Its very hard to draw conclusion form the raw data, so the next step is to organize the data. For example, given below is the weight of 30 students of a class in kg. The above data is not organized and it is in raw form. No conclusion can be drawn from it. 45 75 42 35 64 55 82 38 72 52 65 62 88 63 41 34 38 73 62 51 52 47 41 71 61 71 68 59 53 78
- 8. Statistical series: It refers to those data which are presented in some order and sequences. It is just an arrangement of data in different classes according to a given order. Statistical series are prepared to present the collected and classified data in a properly arranged way. Types of Statistical Series: 1. Individual series. 2. Discrete series. 3. Continuous series.
- 9. INDIVIDUAL SERIES: In the individual series, data are listed as they are observed. Information for every individual item is recorded. In such series, items are listed singly. EXAMPLE: If height of 10 students are recoded individually in a series, it will form an individual series. Limitation of individual series: This method cannot be adopted, if the items in raw data are very large in number. S. No 1 2 3 4 5 6 7 8 9 10 Ht. 160 150 141 172 180 154 172 130 167 153
- 10. Discrete Series or Frequency Array: A discrete series is one in which exact measurement of item is given. In other words, it is formed from items which are exactly measureable. Every unit of data is separate and complete. Definite breaks exist between different items. EXAMPLE: In class of 10 students, the weight of 3 students is 40 kg, 3 student is 50 kg and, 4 student is 60 kg. In a discrete series, various values of the variable are shown along with their corresponding frequencies. No. of students WEIGHT (Kg) 3 40 3 50 4 60
- 11. Continuous series or Frequency Distribution: In the continuous series, items are arranged in classes or groups. This value is not exactly measurable. They can take any numerical value within a certain group or range. EXAMPLE: Continuous series In the above table, the weight of students are shown. There are 10 students in a class whose height is more than 30 and less than 40 so on. WEIGHT OF STUDENTS(kg) NO. OF STUDENTS 30-40 10 40-50 15 50-60 14 60-70 7
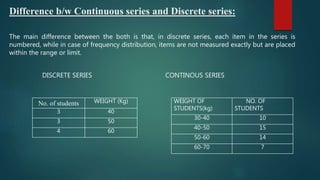
- 12. Difference b/w Continuous series and Discrete series: The main difference between the both is that, in discrete series, each item in the series is numbered, while in case of frequency distribution, items are not measured exactly but are placed within the range or limit. DISCRETE SERIES CONTINOUS SERIES No. of students WEIGHT (Kg) 3 40 3 50 4 60 WEIGHT OF STUDENTS(kg) NO. OF STUDENTS 30-40 10 40-50 15 50-60 14 60-70 7
- 13. CLASS DISTRIBUTION AND CONSTRUCTION OF TABLES: In the formation a Tables , following terms are used. Some of the important terms are. 1. Class: Each given interval is called as a class such as 0-10, 10-20 etc. 2. Class-Limit: There are two limits of each class. These are – a) lower limit, b) upper limit. The lower value of a class is its lower limit and the highest value is termed as upper limit. Example, in class interval of 40-50, 40 is lower limit and 50 is upper limit. 3. Class-Interval: The difference between the upper limit and lower limit of a class is known as class interval. For example, the class interval of class 40-50 is 10.
- 14. 4. Frequency: The number of items ( or values), which are included in a class, is known as frequency of that class. 5. Mid-Values: the mid-value of the class-interval of a class is called as mid-value or mid-point. Mid-values = lower limit + upper limit of the class 2 6. Width of class intervals: While constructing the frequency distribution, it is desirable that the width of each class-interval can be determined by the following formula: width of class interval = Largest value – smallest value number of classes desired a frequency distribution with equal classes width is convenient to represent on a diagram and easy to analyze.
- 15. 7. Range: The range of a frequency distribution can be defined as the difference between the lower limit of first class-interval and the upper limit of the last class-interval. For example, if classes are 0-10, 10- 20……….till 70-80, then range is 80-0 = 80. Types of continuous series: 1. Exclusive series 2. Inclusive series 3. Open end series
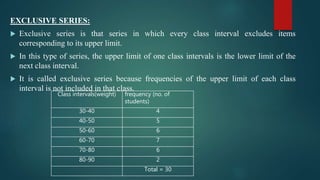
- 16. EXCLUSIVE SERIES: Exclusive series is that series in which every class interval excludes items corresponding to its upper limit. In this type of series, the upper limit of one class intervals is the lower limit of the next class interval. It is called exclusive series because frequencies of the upper limit of each class interval is not included in that class. Class intervals(weight) frequency (no. of students) 30-40 4 40-50 5 50-60 6 60-70 7 70-80 6 80-90 2 Total = 30
- 17. INCLUSIVE SERIES: When the data are classified in such a way that both upper and lower limits of a class-interval are included in the interval itself, then it is called inclusive series. Under this method, upper limit of the class is not the lower limit of the next class- group. Generally the difference between the upper limit of a group and the lower limit of the next group is of 1. for example: Class intervals(weight) frequency (no. of students) 30-39 4 40-49 5 50-59 6 60-69 7 70-79 6 80-89 2 Total = 30
- 18. Measures Of Central Tendency: Definition: “an average is a single value within the range of the data that is used to represent all of the values in the series. Since an average is somewhere within the range of the data, it is sometimes called a measure or a central value”. It is difficult to understand a large group of data. Therefore, it becomes necessary to obtain such a value which may represent the entire group of raw data. One single value which describes the characteristics of the whole data and becomes the representative of the entire group, is called central value or average.
- 19. Mean: Mean is the most popular and useful measure of central tendency. Generally, when we talk about average, it signifies arithmetic mean. It can be defined as “the sum of values of a group of items divided by the number of items”. Advantages : 1. Simple to calculate: 2. Based on all values: it is affected by each and every value. 3. Algebraic Treatment: it is capable of further algebraic treatment. So it is widely used in further statistical analysis. 4. Stability: Mean is stable measure of central tendency. this is because changes in the sample has little effect on mean. 5. Basis of comparison: it provides a good basis to compare two or more than two series.
- 20. Median: Median is the middle value of the series when arranged either in ascending order or in descending order. It is the value which divides the arranged series in two equal parts. One part comprise of all the values greater than median and the other part comprises all values smaller than the median value. The number of observations smaller than median is equal to the number greater than it. Median is particularly important when the items are not capable of exact measurement. For example when we talk of average intelligence, average health of people, we are talking about median as an average.