SlideShare a Scribd company logo
School of Public Health
Biostatistics
Objectives
General Objective
♦ The aim of biostatistical study is to provide the numbers that
contain information about certain situations and present them in
such a way that valid interpretations are possible
Specific Objectives
♦ design, organize, present and summarize data
♦ understand the process involved in data collection and
processing
♦ distinguish between categorical and numeric data
♦ understand probabilities and their applications
♦ interpret summary statistics, graphical displays and contingency
tables commonly presented in the health literature
♦ carry out exploratory data analysis
♦ understand the process involved in estimations and hypothesis
testing
♦ interpret the functions of confidence intervals and p-values
♦ give an interpretation or reach a conclusion about a population
on the basis of information contained in a sample drown from
that population.
Course contents
1.Introduction to Biostatistics
2.Data and types of data
3.Scales of Measurement
4.Presenting and summarizing data
5.Measures of central tendency and measures of dispersion
6. Probability and probability distributions
► Sampling and Sampling distributions
7. Statistical inferences
► Point and interval estimation
► Hypothesis testing
► Test of significance
► Concept of P-value
► Interpreting and communicating results
► sample size determination
8. Using available information to measure health and disease
(health information system)
Use of Computers
♦ The use of statistical computer package for processing and analysis
of data is an integral component of this course.
♦ What the microscope is to biology and what the telescope is to
astronomy, the computer is to epidemiological research.
♦ Computers are reliable, portable, computationally powerful and
easy to use. However they give you what you give them. Computer
scientists refer to this principle as GIGO Garbage In, Garbage Out.
♦ There are many data base computer programs that can be used for
data entry purposes.
♦ It is however helpful, if the data is entered into a program which is
compatible with the statistical package to be used for analysis.
♦ In this course, we will use the Epi-Info, SPSS statistical package.
References: (available in the Library of
the Department of Community Health)
1. Gordis, L. (2009). Epidemiology (4th ed.). USA. Elsevier Inc.
2. Koepsell & Weiss. Epidemiologic Methods. Oxford University Press,
2003.
3. Last (ed.) Dictionary of Epidemiology, 1995
4. Rothman, Kenneth J.; Greenl and, Sander; Lash, Timothy L. Modern
Epidemiology, 3rd Ed Lippincott Williams & Wilkins.2008.
5. Martin Bland. An introduction to Medical Statistics
6. Colton T. Statistics in Medicine
7. Daniel W. Biostatistics a foundation for analysis in the Health Sciences
8. Kirkwood BR. Essentials of Medical Statistics
9. Knapp RG, Miller MC. Clinical epidemiology and Biostatistics. Baltimore
Williams and Wilkins, 1992
10. Pagano & Gauvereau. Principles of Biostatistics
11. Schelesslman, J.J. Case control studies, Design, Conduct, Analysis, Oxford
University Press, New York, 1982
12. Breslow, N.E. Statistical Methods in cancer Research, Volume I-The analysis
of case-control studies
Teaching Methods & Evaluation
♦ Instructors:
– Awgichew Kifle (Lecturer of Biostatistics)
♦ Teaching Methods
– Lecture
– Exercise
– Group presentations
– Computer
♦ Evaluation
– Exercise: 20%
– Final Exam: 30%
Introduction to
Biostatistics
Objectives
– Define Statistics
– Explain Descriptive statistics
– Explain Inferential Statistics
– Define Biostatistics
– Able to explain the rational of studying
biostatistics
– Understand the use of biostatistics
Consider the following data
♦ Polio Vaccine: In the 1950’s polio was a
serious disease that affected countless people
(mostly children)
♦ In 1954,
401,974 children vaccinated
201,229 with a trial vaccine and
200,745 with a placebo
There were a total of 143 Polio cases:
110 for placebo
versus
33 for vaccine
Cont.….
There were a total of 143 Polio cases:
110 for placebo versus 33 for vaccine
♦ What does this mean?
♦ How did you get the 400 000 children?
♦ How did you divide them into two groups?
♦ Suppose you could repeat the experiment, how
likely you would make the same conclusion?
♦ How much confidence do you have to detect the
difference between the two groups?
1. Introduction to Biostatistics
♦ Introduction
Statistics: A field of study concerned with the collection,
organization and summarization of data, and the drawing of
inferences about a body of data when only part of the data are
observed.
Branches of Statistics
1. Descriptive statistics:
2. Inferential statistics:
Descriptive statistics: deals with the description of data in a clear
and informative manner using tables and graphs.
►Ways of organizing and summarizing data
► Helps to identify the general features and trends in a set of
data and extracting useful information
► Also very important in conveying the final results of a study
► uses tables, graphs, numerical summary measures
Descriptive Statistics
♦ Collect data
– e.g., Survey
♦ Present data
– e.g., Tables and graphs
♦ Summarize data
– e.g., Sample mean =
i
X
n

Cont.…
Example: the number of students in a class is 300.
the number of patients in a hospital is 260.
2. Inferential statistics: deals with techniques of making conclusions
about the population based on the information obtained from a
sample drawn from that population.
The inferences are drawn from particular properties of sample to
particular properties of population.
Inferential statistics builds upon descriptive statistics.
Example: Principles of probability, estimation,, hypothesis testing, etc.
Example: Adane concludes that his chance of passing the first
year this academic year is at least 80% based on the statistics
that 75% of the freshmen passed last year.
Inferential Statistics
♦ Estimation
– e.g., Estimate the population
mean weight using the sample
mean weight
♦ Hypothesis testing
– e.g., Test the claim that the
population mean weight is 120
pounds
Inference is the process of drawing conclusions or making
decisions about a population based on sample results
1. Introdution to Biostatistics.ppt
Biostatistics: An application of statistical method to biomedical
science.
► Has central role in medical investigations
► Concerned with interpretation of biological data & the
communication of information about data
Rationale of studying biostatistics
♦ Statistics pervades a way of organizing information on a wider
and more formal basis than relying on the exchange of story or
biography and personal experience.
♦ The medical and public health literatures are sated or full with
reports in which statistical techniques are used extensively.
♦ The planning, conduct, and interpretation of much of medical
and public health research are becoming increasingly reliant on
statistical technology.
Uses of Statistics in Public Health and Medicine
 Provide a way of organizing information
 Assessment of health status
 Health program evaluation
 Assessing risk factors
 To formulate scientific questions to be answered, collect,
analyze and interpret data
 Cause & effect relationship
E.g. Evaluation of a new vaccine or drug
How effective is the vaccine (drug)?
Is the effect due to chance or some bias?
Uses of biostatistics
 Drawing of inferences
 Information from sample to population
 Magnitude of association
 Strong vs weak association between exposure and outcome
Characteristics of statistical data
 They must be in aggregates: A single fact, even though
numerically stated, cannot be called statistics
 They must be affected by a multiplicity of causes
 They must be reasonably accurate.
 They must have been collected in a systematic manner for a
predetermined purpose.
 They must be comparable either in point of time, space or
condition.
Stages in statistical investigation
There are five stages or steps in any statistical investigation.
Data collection: is the process of measuring, gathering and
assembling the raw data up on which the statistical investigation
is to be used.
Organization of data: it can be defined as the summarization
of data in some meaningful ways. For example, table form.
Presentation of data: the process of re-organization,
classification, compilation, and summarization of data to present it
in a meaningful form.
Stages in statistical investigation
Analysis of data: the process of extracting relevant information
from the summarized data, mainly through the use of elementary
mathematical operation.
Inference of data: the interpretation and further observation of
the various statistical measures through the analysis of the data
by implementing those methods by which conclusions are formed
and inferences made.
Definition of Some Basic terms
Population: is the totality of all subjects possessing certain
common characteristics that are being studied.
It is a collection of all units under investigation, which consists of a
specified type of person or objects over a given space and time.
Population should be defined on the basis of the objective of the
study by the investigator.
For example, it could mean the total human population of a
country or village or a state; total number of school age population;
total number of women in the reproductive age group, etc.
Sample: is a sub group or part of the population selected by some
methods in order to estimate the characteristics of the population.
Cont.…
Parameter: Characteristic or measure obtained from a
population.
Statistic: Characteristic or measure obtained from a sample.
Sampling: The process or method of sample selection from the
population.
Sample size: The number of elements or observation to be
included in the sample.
Census
♦ Refers to a nation-wide periodic counting
(enumeration) of the population.
♦ There are two main different schemes for
enumerating a population in a census.
1. De jure: - the enumeration (or count) is
done according to the usual or legal place
of residence.
♦ A de jure count of the members of a
household excludes temporary residents
and visitors, but includes permanent
residents who are temporarily away.
Census…
a) Advantage
♦ information unaffected by seasonal
and other temporary movements of
people.
b) Disadvantages
♦ Some persons may be omitted from
the count while some others may be
counted twice.
census…
♦ It is difficult to be sure just which is a
person’s usual or legal residence. (in
places where mobility is high and no
fixed residence is indicated).
♦ Information collected regarding persons
away from home is often incomplete or
incorrect.
census…
2. De facto: - the enumeration is done according
to the actual place of residence on the day of the
census.
♦ A de facto count includes temporary residents
and visitors, but excludes permanent
residents who happen to be away on the day
of the census.
census…
a) Advantages
– Gives less chance for the omission of persons
from the count
b) Disadvantages
♦ Population figures may be inflated or deflated by
tourists, travelling salesmen, and other transients.
♦ In areas with high migration, the registration of
vital events is subject to distortion.
3
Surveys
♦ A survey is a technique based on sampling methods
by means of which we try to obtain specific
information from part of the population considered
to be representative of the whole.
♦ Surveys are made at a given moment, in a specific
area; sporadically and without periodicity for the
deep study of the problem.
Limitations of statistics
 It deals with only those subjects of inquiry that are capable
of being quantitatively measured and numerically expressed.
 It deals with aggregates of facts and no importance is
attached to individual items
 Statistical data are only approximately and not
mathematically correct.
Exercise
Classify the following sentences as belonging to the area of
descriptive statistics or inferential statistics.
♦ The average systolic blood pressure record of 15 women in a
village was 140.
♦ Of all patients who received this particular type of drug at a
clinic Y, 75% later developed significant side effect.
♦ For next three month it is predicted that there will be short
hospital stay of patients.
♦ Among students which have been tested HIV AIDS last year
in Addis Ababa University 0.05% of them are positive.
THANK YOU!!!

More Related Content

What's hot (20)

PPTX
Epi Info- An Statistical Software
Dr-Jitendra Patel
 
PPT
Medical statistics
Amany El-seoud
 
PPTX
What's Significant? Hypothesis Testing, Effect Size, Confidence Intervals, & ...
Pat Barlow
 
PPT
Biostatistics Concept & Definition
Southern Range, Berhampur, Odisha
 
PDF
Power Analysis and Sample Size Determination
Ajay Dhamija
 
PPTX
Basics of Regression analysis
Mahak Vijayvargiya
 
PPT
Software packages for statistical analysis - SPSS
ANAND BALAJI
 
PPTX
Statistical Power
Christiana Datubo-Brown
 
PDF
Logistic Ordinal Regression
Sri Ambati
 
PPTX
SPSS.pptx
DrIrfanulHaqAkhoon
 
PPTX
Statistical Estimation
Remyagharishs
 
PDF
Introduction to STATA - Ali Rashed
Economic Research Forum
 
PPTX
Epidemiology Introduction
KULDEEP VYAS
 
PDF
Standard deviation and standard error
Shahla Yasmin
 
PPTX
Chi -square test
VIVEK KUMAR SINGH
 
PPTX
Basic biostatistics dr.eezn
EhealthMoHS
 
PDF
Measures of association
IAU Dent
 
PPTX
Analysis of variance (anova)
Sadhana Singh
 
PPT
1.introduction
abdi beshir
 
PDF
Sample size determination
Augustine Gatimu
 
Epi Info- An Statistical Software
Dr-Jitendra Patel
 
Medical statistics
Amany El-seoud
 
What's Significant? Hypothesis Testing, Effect Size, Confidence Intervals, & ...
Pat Barlow
 
Biostatistics Concept & Definition
Southern Range, Berhampur, Odisha
 
Power Analysis and Sample Size Determination
Ajay Dhamija
 
Basics of Regression analysis
Mahak Vijayvargiya
 
Software packages for statistical analysis - SPSS
ANAND BALAJI
 
Statistical Power
Christiana Datubo-Brown
 
Logistic Ordinal Regression
Sri Ambati
 
Statistical Estimation
Remyagharishs
 
Introduction to STATA - Ali Rashed
Economic Research Forum
 
Epidemiology Introduction
KULDEEP VYAS
 
Standard deviation and standard error
Shahla Yasmin
 
Chi -square test
VIVEK KUMAR SINGH
 
Basic biostatistics dr.eezn
EhealthMoHS
 
Measures of association
IAU Dent
 
Analysis of variance (anova)
Sadhana Singh
 
1.introduction
abdi beshir
 
Sample size determination
Augustine Gatimu
 

Similar to 1. Introdution to Biostatistics.ppt (20)

PPTX
Biostatisitics.pptx
Fatima117039
 
PDF
Biostat 8th semester B.Pharm-Introduction Ravinandan A P.pdf
Ravinandan A P
 
PPTX
Basic of Biostatistics and epidemology_1.pptx
haiderhighland
 
PPTX
Biostatistics introduction.pptx
MohammedAbdela7
 
PPTX
Biostatistics_pinky.pptx useful video to learn
JenefaShiny
 
PPTX
Introduction to Biostatistics for beginers
amareyirga2
 
PPT
statistics.ppt
Shivraj Nile
 
PPTX
Biostatistics
Kumari Kalpana
 
PPTX
introduction.pptx
KemalAbdela2
 
PDF
ln_biostat_hss_final (1).pdf
yimamahmed1
 
PDF
Biostat training material
Yusuf Ahmed
 
PPT
What is statistics? Statistics: A field of study concerned with: collection, ...
MuheMan1
 
PPTX
introduction.presentation pptx biostatistics
kavithagowda18
 
PPT
Biostatistics lec 1
Osmanmohamed38
 
PPTX
MAIN 2._biostatistics.pptx biostatistics
kavithagowda18
 
PDF
1. Introduction to biostatistics
Anjali Upadhye
 
PDF
lecture introduction to biostatics 1.pdf
gebeyehu5
 
PPTX
Biostatistics khushbu
khushbu mishra
 
PPTX
Biostatistics community medicine psmpptx
hemanth2457888
 
PPT
Lecture 1
PublicHealth9
 
Biostatisitics.pptx
Fatima117039
 
Biostat 8th semester B.Pharm-Introduction Ravinandan A P.pdf
Ravinandan A P
 
Basic of Biostatistics and epidemology_1.pptx
haiderhighland
 
Biostatistics introduction.pptx
MohammedAbdela7
 
Biostatistics_pinky.pptx useful video to learn
JenefaShiny
 
Introduction to Biostatistics for beginers
amareyirga2
 
statistics.ppt
Shivraj Nile
 
Biostatistics
Kumari Kalpana
 
introduction.pptx
KemalAbdela2
 
ln_biostat_hss_final (1).pdf
yimamahmed1
 
Biostat training material
Yusuf Ahmed
 
What is statistics? Statistics: A field of study concerned with: collection, ...
MuheMan1
 
introduction.presentation pptx biostatistics
kavithagowda18
 
Biostatistics lec 1
Osmanmohamed38
 
MAIN 2._biostatistics.pptx biostatistics
kavithagowda18
 
1. Introduction to biostatistics
Anjali Upadhye
 
lecture introduction to biostatics 1.pdf
gebeyehu5
 
Biostatistics khushbu
khushbu mishra
 
Biostatistics community medicine psmpptx
hemanth2457888
 
Lecture 1
PublicHealth9
 
Ad

More from Fatima117039 (20)

PPTX
BREAST PROBLEMS GROUP III.pptx
Fatima117039
 
PPTX
1. Advanced Nursing Health Assessments func. pattern.pptx
Fatima117039
 
PDF
MRHN_2015_Group Assign't_G-1 & G-2.pdf
Fatima117039
 
PDF
DM IN PREGN.pdf
Fatima117039
 
PPTX
GTD.pptx
Fatima117039
 
PPTX
Preterm Baby.pptx
Fatima117039
 
PPTX
Cancer in pregnancy.pptx
Fatima117039
 
PPT
2-ANATOMY%20AND%20PHYSIOLOGY%20-%20Copy.ppt
Fatima117039
 
PPT
chapter 2 carbohydrates.ppt
Fatima117039
 
PPTX
7. Summary (1).pptx
Fatima117039
 
PPTX
4_6019495483951548103.pptx
Fatima117039
 
PPTX
4_5889004683757881420.pptx
Fatima117039
 
PPTX
cardiovascular system problems.pptx
Fatima117039
 
PPTX
Unit 2-Growth and Development.pptx
Fatima117039
 
PPTX
Unit 2. ANC (2).pptx
Fatima117039
 
PPTX
SB.pptx
Fatima117039
 
PPT
Chapter 6-2 Congenital diaphragmatic hernia.ppt
Fatima117039
 
PPT
Introduction of Neonatal Nursing.ppt
Fatima117039
 
PPTX
Adoption.pptx
Fatima117039
 
PPTX
Theorie of health education(1).pptx
Fatima117039
 
BREAST PROBLEMS GROUP III.pptx
Fatima117039
 
1. Advanced Nursing Health Assessments func. pattern.pptx
Fatima117039
 
MRHN_2015_Group Assign't_G-1 & G-2.pdf
Fatima117039
 
DM IN PREGN.pdf
Fatima117039
 
GTD.pptx
Fatima117039
 
Preterm Baby.pptx
Fatima117039
 
Cancer in pregnancy.pptx
Fatima117039
 
2-ANATOMY%20AND%20PHYSIOLOGY%20-%20Copy.ppt
Fatima117039
 
chapter 2 carbohydrates.ppt
Fatima117039
 
7. Summary (1).pptx
Fatima117039
 
4_6019495483951548103.pptx
Fatima117039
 
4_5889004683757881420.pptx
Fatima117039
 
cardiovascular system problems.pptx
Fatima117039
 
Unit 2-Growth and Development.pptx
Fatima117039
 
Unit 2. ANC (2).pptx
Fatima117039
 
SB.pptx
Fatima117039
 
Chapter 6-2 Congenital diaphragmatic hernia.ppt
Fatima117039
 
Introduction of Neonatal Nursing.ppt
Fatima117039
 
Adoption.pptx
Fatima117039
 
Theorie of health education(1).pptx
Fatima117039
 
Ad

Recently uploaded (20)

PPTX
SAMPLING: DEFINITION,PROCESS,TYPES,SAMPLE SIZE, SAMPLING ERROR.pptx
PRADEEP ABOTHU
 
PPTX
Optimizing Cancer Screening With MCED Technologies: From Science to Practical...
i3 Health
 
PPTX
How to Manage Access Rights & User Types in Odoo 18
Celine George
 
PPTX
Capitol Doctoral Presentation -July 2025.pptx
CapitolTechU
 
PDF
07.15.2025 - Managing Your Members Using a Membership Portal.pdf
TechSoup
 
PDF
1, 2, 3… E MAIS UM CICLO CHEGA AO FIM!.pdf
Colégio Santa Teresinha
 
PPTX
Blanket Order in Odoo 17 Purchase App - Odoo Slides
Celine George
 
PPTX
How to Define Translation to Custom Module And Add a new language in Odoo 18
Celine George
 
PPSX
Health Planning in india - Unit 03 - CHN 2 - GNM 3RD YEAR.ppsx
Priyanshu Anand
 
PDF
Zoology (Animal Physiology) practical Manual
raviralanaresh2
 
PPTX
CONVULSIVE DISORDERS: NURSING MANAGEMENT.pptx
PRADEEP ABOTHU
 
PPTX
ANORECTAL MALFORMATIONS: NURSING MANAGEMENT.pptx
PRADEEP ABOTHU
 
PPTX
How to Configure Access Rights of Manufacturing Orders in Odoo 18 Manufacturing
Celine George
 
PDF
Comprehensive Guide to Writing Effective Literature Reviews for Academic Publ...
AJAYI SAMUEL
 
PPTX
How to Manage Promotions in Odoo 18 Sales
Celine George
 
PPTX
SCHOOL-BASED SEXUAL HARASSMENT PREVENTION AND RESPONSE WORKSHOP
komlalokoe
 
PPTX
Modern analytical techniques used to characterize organic compounds. Birbhum ...
AyanHossain
 
PPTX
Pyhton with Mysql to perform CRUD operations.pptx
Ramakrishna Reddy Bijjam
 
PPTX
How to Configure Storno Accounting in Odoo 18 Accounting
Celine George
 
PPTX
2025 Winter SWAYAM NPTEL & A Student.pptx
Utsav Yagnik
 
SAMPLING: DEFINITION,PROCESS,TYPES,SAMPLE SIZE, SAMPLING ERROR.pptx
PRADEEP ABOTHU
 
Optimizing Cancer Screening With MCED Technologies: From Science to Practical...
i3 Health
 
How to Manage Access Rights & User Types in Odoo 18
Celine George
 
Capitol Doctoral Presentation -July 2025.pptx
CapitolTechU
 
07.15.2025 - Managing Your Members Using a Membership Portal.pdf
TechSoup
 
1, 2, 3… E MAIS UM CICLO CHEGA AO FIM!.pdf
Colégio Santa Teresinha
 
Blanket Order in Odoo 17 Purchase App - Odoo Slides
Celine George
 
How to Define Translation to Custom Module And Add a new language in Odoo 18
Celine George
 
Health Planning in india - Unit 03 - CHN 2 - GNM 3RD YEAR.ppsx
Priyanshu Anand
 
Zoology (Animal Physiology) practical Manual
raviralanaresh2
 
CONVULSIVE DISORDERS: NURSING MANAGEMENT.pptx
PRADEEP ABOTHU
 
ANORECTAL MALFORMATIONS: NURSING MANAGEMENT.pptx
PRADEEP ABOTHU
 
How to Configure Access Rights of Manufacturing Orders in Odoo 18 Manufacturing
Celine George
 
Comprehensive Guide to Writing Effective Literature Reviews for Academic Publ...
AJAYI SAMUEL
 
How to Manage Promotions in Odoo 18 Sales
Celine George
 
SCHOOL-BASED SEXUAL HARASSMENT PREVENTION AND RESPONSE WORKSHOP
komlalokoe
 
Modern analytical techniques used to characterize organic compounds. Birbhum ...
AyanHossain
 
Pyhton with Mysql to perform CRUD operations.pptx
Ramakrishna Reddy Bijjam
 
How to Configure Storno Accounting in Odoo 18 Accounting
Celine George
 
2025 Winter SWAYAM NPTEL & A Student.pptx
Utsav Yagnik
 

1. Introdution to Biostatistics.ppt

  • 1. School of Public Health Biostatistics
  • 2. Objectives General Objective ♦ The aim of biostatistical study is to provide the numbers that contain information about certain situations and present them in such a way that valid interpretations are possible Specific Objectives ♦ design, organize, present and summarize data ♦ understand the process involved in data collection and processing ♦ distinguish between categorical and numeric data ♦ understand probabilities and their applications ♦ interpret summary statistics, graphical displays and contingency tables commonly presented in the health literature ♦ carry out exploratory data analysis ♦ understand the process involved in estimations and hypothesis testing ♦ interpret the functions of confidence intervals and p-values ♦ give an interpretation or reach a conclusion about a population on the basis of information contained in a sample drown from that population.
  • 3. Course contents 1.Introduction to Biostatistics 2.Data and types of data 3.Scales of Measurement 4.Presenting and summarizing data 5.Measures of central tendency and measures of dispersion 6. Probability and probability distributions ► Sampling and Sampling distributions 7. Statistical inferences ► Point and interval estimation ► Hypothesis testing ► Test of significance ► Concept of P-value ► Interpreting and communicating results ► sample size determination 8. Using available information to measure health and disease (health information system)
  • 4. Use of Computers ♦ The use of statistical computer package for processing and analysis of data is an integral component of this course. ♦ What the microscope is to biology and what the telescope is to astronomy, the computer is to epidemiological research. ♦ Computers are reliable, portable, computationally powerful and easy to use. However they give you what you give them. Computer scientists refer to this principle as GIGO Garbage In, Garbage Out. ♦ There are many data base computer programs that can be used for data entry purposes. ♦ It is however helpful, if the data is entered into a program which is compatible with the statistical package to be used for analysis. ♦ In this course, we will use the Epi-Info, SPSS statistical package.
  • 5. References: (available in the Library of the Department of Community Health) 1. Gordis, L. (2009). Epidemiology (4th ed.). USA. Elsevier Inc. 2. Koepsell & Weiss. Epidemiologic Methods. Oxford University Press, 2003. 3. Last (ed.) Dictionary of Epidemiology, 1995 4. Rothman, Kenneth J.; Greenl and, Sander; Lash, Timothy L. Modern Epidemiology, 3rd Ed Lippincott Williams & Wilkins.2008. 5. Martin Bland. An introduction to Medical Statistics 6. Colton T. Statistics in Medicine 7. Daniel W. Biostatistics a foundation for analysis in the Health Sciences 8. Kirkwood BR. Essentials of Medical Statistics 9. Knapp RG, Miller MC. Clinical epidemiology and Biostatistics. Baltimore Williams and Wilkins, 1992 10. Pagano & Gauvereau. Principles of Biostatistics 11. Schelesslman, J.J. Case control studies, Design, Conduct, Analysis, Oxford University Press, New York, 1982 12. Breslow, N.E. Statistical Methods in cancer Research, Volume I-The analysis of case-control studies
  • 6. Teaching Methods & Evaluation ♦ Instructors: – Awgichew Kifle (Lecturer of Biostatistics) ♦ Teaching Methods – Lecture – Exercise – Group presentations – Computer ♦ Evaluation – Exercise: 20% – Final Exam: 30%
  • 8. Objectives – Define Statistics – Explain Descriptive statistics – Explain Inferential Statistics – Define Biostatistics – Able to explain the rational of studying biostatistics – Understand the use of biostatistics
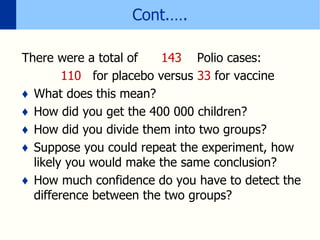
  • 9. Consider the following data ♦ Polio Vaccine: In the 1950’s polio was a serious disease that affected countless people (mostly children) ♦ In 1954, 401,974 children vaccinated 201,229 with a trial vaccine and 200,745 with a placebo There were a total of 143 Polio cases: 110 for placebo versus 33 for vaccine
  • 10. Cont.…. There were a total of 143 Polio cases: 110 for placebo versus 33 for vaccine ♦ What does this mean? ♦ How did you get the 400 000 children? ♦ How did you divide them into two groups? ♦ Suppose you could repeat the experiment, how likely you would make the same conclusion? ♦ How much confidence do you have to detect the difference between the two groups?
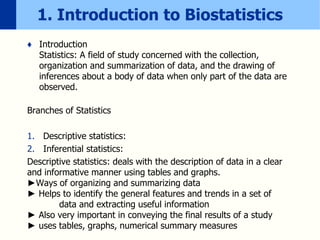
  • 11. 1. Introduction to Biostatistics ♦ Introduction Statistics: A field of study concerned with the collection, organization and summarization of data, and the drawing of inferences about a body of data when only part of the data are observed. Branches of Statistics 1. Descriptive statistics: 2. Inferential statistics: Descriptive statistics: deals with the description of data in a clear and informative manner using tables and graphs. ►Ways of organizing and summarizing data ► Helps to identify the general features and trends in a set of data and extracting useful information ► Also very important in conveying the final results of a study ► uses tables, graphs, numerical summary measures
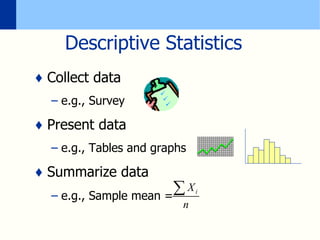
  • 12. Descriptive Statistics ♦ Collect data – e.g., Survey ♦ Present data – e.g., Tables and graphs ♦ Summarize data – e.g., Sample mean = i X n 
  • 13. Cont.… Example: the number of students in a class is 300. the number of patients in a hospital is 260. 2. Inferential statistics: deals with techniques of making conclusions about the population based on the information obtained from a sample drawn from that population. The inferences are drawn from particular properties of sample to particular properties of population. Inferential statistics builds upon descriptive statistics. Example: Principles of probability, estimation,, hypothesis testing, etc.
  • 14. Example: Adane concludes that his chance of passing the first year this academic year is at least 80% based on the statistics that 75% of the freshmen passed last year.
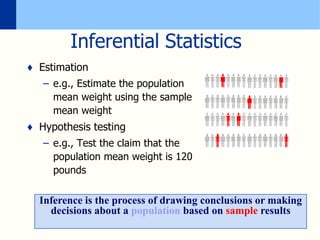
  • 15. Inferential Statistics ♦ Estimation – e.g., Estimate the population mean weight using the sample mean weight ♦ Hypothesis testing – e.g., Test the claim that the population mean weight is 120 pounds Inference is the process of drawing conclusions or making decisions about a population based on sample results
  • 17. Biostatistics: An application of statistical method to biomedical science. ► Has central role in medical investigations ► Concerned with interpretation of biological data & the communication of information about data Rationale of studying biostatistics ♦ Statistics pervades a way of organizing information on a wider and more formal basis than relying on the exchange of story or biography and personal experience. ♦ The medical and public health literatures are sated or full with reports in which statistical techniques are used extensively. ♦ The planning, conduct, and interpretation of much of medical and public health research are becoming increasingly reliant on statistical technology.
  • 18. Uses of Statistics in Public Health and Medicine  Provide a way of organizing information  Assessment of health status  Health program evaluation  Assessing risk factors  To formulate scientific questions to be answered, collect, analyze and interpret data  Cause & effect relationship E.g. Evaluation of a new vaccine or drug How effective is the vaccine (drug)? Is the effect due to chance or some bias?
  • 19. Uses of biostatistics  Drawing of inferences  Information from sample to population  Magnitude of association  Strong vs weak association between exposure and outcome
  • 20. Characteristics of statistical data  They must be in aggregates: A single fact, even though numerically stated, cannot be called statistics  They must be affected by a multiplicity of causes  They must be reasonably accurate.  They must have been collected in a systematic manner for a predetermined purpose.  They must be comparable either in point of time, space or condition.
  • 21. Characteristics of statistical data  They must be in aggregates: A single fact, even though numerically stated, cannot be called statistics  They must be affected by a multiplicity of causes  They must be reasonably accurate.  They must have been collected in a systematic manner for a predetermined purpose.  They must be comparable either in point of time, space or condition.
  • 22. Stages in statistical investigation There are five stages or steps in any statistical investigation. Data collection: is the process of measuring, gathering and assembling the raw data up on which the statistical investigation is to be used. Organization of data: it can be defined as the summarization of data in some meaningful ways. For example, table form. Presentation of data: the process of re-organization, classification, compilation, and summarization of data to present it in a meaningful form.
  • 23. Stages in statistical investigation Analysis of data: the process of extracting relevant information from the summarized data, mainly through the use of elementary mathematical operation. Inference of data: the interpretation and further observation of the various statistical measures through the analysis of the data by implementing those methods by which conclusions are formed and inferences made.
  • 24. Definition of Some Basic terms Population: is the totality of all subjects possessing certain common characteristics that are being studied. It is a collection of all units under investigation, which consists of a specified type of person or objects over a given space and time. Population should be defined on the basis of the objective of the study by the investigator. For example, it could mean the total human population of a country or village or a state; total number of school age population; total number of women in the reproductive age group, etc. Sample: is a sub group or part of the population selected by some methods in order to estimate the characteristics of the population.
  • 25. Cont.… Parameter: Characteristic or measure obtained from a population. Statistic: Characteristic or measure obtained from a sample. Sampling: The process or method of sample selection from the population. Sample size: The number of elements or observation to be included in the sample.
  • 26. Census ♦ Refers to a nation-wide periodic counting (enumeration) of the population. ♦ There are two main different schemes for enumerating a population in a census. 1. De jure: - the enumeration (or count) is done according to the usual or legal place of residence. ♦ A de jure count of the members of a household excludes temporary residents and visitors, but includes permanent residents who are temporarily away.
  • 27. Census… a) Advantage ♦ information unaffected by seasonal and other temporary movements of people. b) Disadvantages ♦ Some persons may be omitted from the count while some others may be counted twice.
  • 28. census… ♦ It is difficult to be sure just which is a person’s usual or legal residence. (in places where mobility is high and no fixed residence is indicated). ♦ Information collected regarding persons away from home is often incomplete or incorrect.
  • 29. census… 2. De facto: - the enumeration is done according to the actual place of residence on the day of the census. ♦ A de facto count includes temporary residents and visitors, but excludes permanent residents who happen to be away on the day of the census.
  • 30. census… a) Advantages – Gives less chance for the omission of persons from the count b) Disadvantages ♦ Population figures may be inflated or deflated by tourists, travelling salesmen, and other transients. ♦ In areas with high migration, the registration of vital events is subject to distortion.
  • 31. 3 Surveys ♦ A survey is a technique based on sampling methods by means of which we try to obtain specific information from part of the population considered to be representative of the whole. ♦ Surveys are made at a given moment, in a specific area; sporadically and without periodicity for the deep study of the problem.
  • 32. Limitations of statistics  It deals with only those subjects of inquiry that are capable of being quantitatively measured and numerically expressed.  It deals with aggregates of facts and no importance is attached to individual items  Statistical data are only approximately and not mathematically correct.
  • 33. Exercise Classify the following sentences as belonging to the area of descriptive statistics or inferential statistics. ♦ The average systolic blood pressure record of 15 women in a village was 140. ♦ Of all patients who received this particular type of drug at a clinic Y, 75% later developed significant side effect. ♦ For next three month it is predicted that there will be short hospital stay of patients. ♦ Among students which have been tested HIV AIDS last year in Addis Ababa University 0.05% of them are positive.