


2. Descriptive Statistics.pdf
- 1. Descriptive statistics: Tufa Kolola (MPH, Ass’t. Prof.) 1 Data Organization and Presentation
- 2. Learning objectives § At the end of this session you will be able to: • Present qualitative data using tabular methods • Present qualitative data using graphical methods • Present quantitative data using tabular methods • Present quantitative data using graphical methods 2
- 3. Descriptive summary statistics § Descriptive statistics: Techniques used to organize and summarize a set of data in more comprehensible and meaningful way – Organization of data – Summarization of data – Presentation of data § Numbers that have not been summarized and organized are called raw data 3
- 4. Raw data Definition § Data that have been collected or recorded but have not been arranged or processed yet are called raw data 4
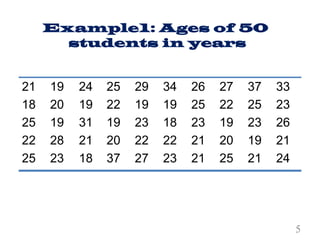
- 5. Example1: Ages of 50 students in years 21 18 25 22 25 19 20 19 28 23 24 19 31 21 18 25 22 19 20 37 29 19 23 22 27 34 19 18 22 23 26 25 23 21 21 27 22 19 20 25 37 25 23 19 21 33 23 26 21 24 5
- 6. Example2: § These are types of blood group for a sample of 50 OPD patients O AB A AB AB B O B B O O O B O A O O A B B A A AB O O O A O O B A O O O A B O O A A O A A B AB B O A O A
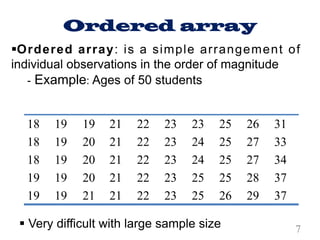
- 7. Ordered array 18 18 18 19 19 19 19 19 19 19 19 20 20 20 21 21 21 21 21 21 22 22 22 22 22 23 23 23 23 23 23 24 24 25 25 25 25 25 25 26 26 27 27 28 29 31 33 34 37 37 §Ordered array: is a simple arrangement of individual observations in the order of magnitude - Example: Ages of 50 students § Very difficult with large sample size 7
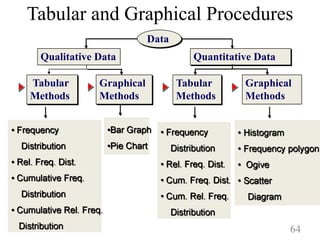
- 8. Presentation of data 8 Qualitative Data Quantitative Data Tabular Methods Tabular Methods Graphical Methods Graphical Methods Data
- 9. Frequency Distribution § Frequency distribution: is a table that summarizes a raw data into non-overlapping classes or categories along with their corresponding class frequency § Class frequency: The number of observations that fall into the class § The objective is to provide insights about the data that cannot be quickly obtained by looking only at the original data 9
- 10. Frequency Distribution § The actual summarization and organization of data starts from frequency distribution § The distribution condenses the raw data into a more useful form and allows for a quick visual interpretation of the data 10
- 11. Frequency Distribution for categorical variables § Count the number of observations (frequency) in each category and present as relative frequencies § Often presented in the form of Table, Bar and Pie charts 11
- 12. Frequency Distribution for categorical variables § Relative frequency: value for any category obtained by dividing the number of observations in that category by the total number of observations - Class relative frequency = Class frequency/ Total number of observations § This can be reported as a percentage by multiplying the resulting fraction by 100 12
- 13. Frequency Distribution for categorical variables § A relative frequency distribution: Shows the proportion of counts that fall into each class or category § For nominal and ordinal data, frequency distributions are often used as a summary § The % of times that each value occurs, or the relative frequency, is often listed § Tables make it easier to see how the data are distributed 13
- 14. Example 1: Nominal data Table 1: Type of hospitals owned by MOH in Ethiopia in 2006/07 Source: Health and health related indicator 14
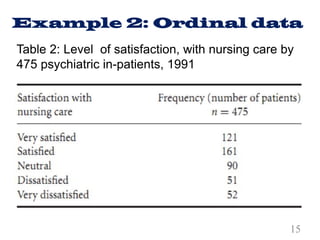
- 15. Example 2: Ordinal data Table 2: Level of satisfaction, with nursing care by 475 psychiatric in-patients, 1991 15
- 16. Frequency Distribution for numerical variables § A frequency distribution can also show the number of observations at different values or within certain ranges § There are two types of frequency distribution: – Single value (ungrouped frequency) – Interval type (classes) – grouped frequency 16
- 17. Ungrouped Frequency Distribution § Ungrouped frequency distribution: Consists of a single data with their respective frequency § Can be used when the range of values in the data set is not large § Classes are one unit in width 17
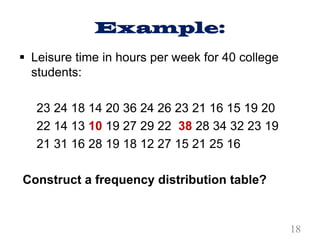
- 18. Example: § Leisure time in hours per week for 40 college students: 23 24 18 14 20 36 24 26 23 21 16 15 19 20 22 14 13 10 19 27 29 22 38 28 34 32 23 19 21 31 16 28 19 18 12 27 15 21 25 16 Construct a frequency distribution table? 18
- 20. Grouped Frequency Distribution § Can be used when the range of values in the data set is large § The data must be grouped into classes that are more than one unit in width 20
- 21. Grouped Frequency Distribution § Steps in Constructing Frequency Distribution Tables Step 1: Determine the range of the data - R = Highest Value – Lowest Value 21
- 22. Step 2: Determine the number of classes (k) and the corresponding width, we may use: Where; K = number of class intervals n = no. of observations W = width of the class interval L = the largest value S = the smallest value 22
- 23. Step 3: For each class, count the number of observations (class frequency) Step 4: Determine the relative frequency for each class Frequency of each class interval Relative frequency = Total number of observations 23
- 24. Grouped Frequency Distribution The classes must be mutually exclusive The classes must be continuous The classes must be exhaustive The class must be equal in width 24
- 25. Example: § Leisure time (hours) per week for 40 college students: 23 24 18 14 20 36 24 26 23 21 16 15 19 20 22 14 13 10 19 27 29 22 38 28 34 32 23 19 21 31 16 28 19 18 12 27 15 21 25 16 Maximum value = 38, Minimum value = 10 K = 1 + 3.322 (log40) = 6.32 6 Width = (38-10)/6 = 4.6 5 25
- 26. 26
- 27. § Cumulative frequencies: When frequencies of two or more classes are added § Cumulative relative frequency: The proportion of the total number of observations that have a value less than or equal to the upper limit of the interval § Mid-point: The value of the interval which lies midway between the lower and the upper limits of a class 27
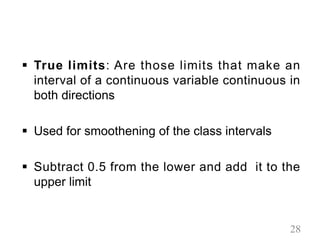
- 28. § True limits: Are those limits that make an interval of a continuous variable continuous in both directions § Used for smoothening of the class intervals § Subtract 0.5 from the lower and add it to the upper limit 28
- 29. 29
- 30. Guidelines for constructing tables § Tables should be self-explanatory § Include clear title telling what, when and where § Clearly label the rows and columns § State clearly the unit of measurement used § Explain codes and abbreviations in the foot-note § Show totals § If data is not original, indicate the source in foot- note 30
- 31. Graphical presentation of data § Help users to obtain at a glance an intuitive feeling of the data § Should be self-explanatory § Must have a descriptive title, labeled axes and indication of the units of measurement 31
- 32. Graphical presentation Importance of Graphical presentation: § Diagrams have greater attraction than mere figures § They give quick overall impression of the data § They have great memorizing value than mere figures § They facilitate comparison § Used to understand patterns and trends 32
- 33. Graphical presentation § Well designed graphs can be powerful means of communicating a great deal of information § When graphs are poorly designed, they not only ineffectively convey message, but they are often misleading 33
- 34. Types of graphs § Categorical data – Bar chart – Pie-chart § Quantitative data – Histogram – Frequency Polygon – Ogive – Stem-and-leaf plot – Box plot – Scatter Diagram 34
- 35. Bar chart Definition: § A graph made of bars whose heights represent the frequencies of respective categories is called a bar graph. 35
- 36. Bar chart § Used to display frequency contained in the frequency distribution of categorical variable § It is used with categorical data § Each bar represent one category and its height is the frequency or relative frequency o y – axis: Frequency or the relative frequency or percentage o x – axis: Category 36
- 37. Bar chart Rules o Bars should be separated o The gap between each bar is uniform o All bars should be of the same width o All the bars should rest on the same line called the base o It is very important that Y axis begin with 0 o Label both axes clearly 37
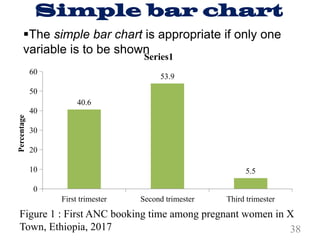
- 38. Simple bar chart 38 40.6 53.9 5.5 0 10 20 30 40 50 60 First trimester Second trimester Third trimester Percentage Series1 Figure 1 : First ANC booking time among pregnant women in X Town, Ethiopia, 2017 §The simple bar chart is appropriate if only one variable is to be shown
- 39. Clustered bar chart 39 Urban Rural 0 5 10 15 20 25 30 35 40 45 50 55 60 65 70 75 80 85 90 95 Percent Residence First day Second and subsquent days 25.7 74.3 10.0 90 Figure 2 : Timing of health care seeking reported by place of residence, X District, Ethiopia, 2011.
- 40. Pie-chart A pie chart: is a circle that is divided into sections according to the percentage of frequencies in each category of the distribution § Used for a single categorical variable relative frequency § Each slice of pie correspond at relative frequency of categories of variable 40
- 41. Pie-chart Steps to construct a pie-chart § Construct a frequency table § Change the frequency into percentage (P) § Change the percentages into degrees, where: degree = Percentage X 360o § Draw a circle and divide it accordingly 41
- 42. Example ciculatory system 42% Neoplasmas 30% Respiratory system 13% Injury and Poisoning 3% Digestive System 4% Others 8% Figure 3: Distribution for cause of death for females, in England and Wales, 1989 42
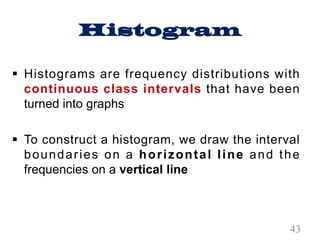
- 43. Histogram § Histograms are frequency distributions with continuous class intervals that have been turned into graphs § To construct a histogram, we draw the interval boundaries on a horizontal line and the frequencies on a vertical line 43
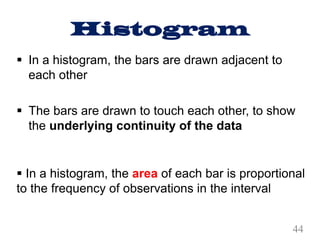
- 44. Histogram § In a histogram, the bars are drawn adjacent to each other § The bars are drawn to touch each other, to show the underlying continuity of the data § In a histogram, the area of each bar is proportional to the frequency of observations in the interval 44
- 45. Example Total Home Runs f 124 – 145 146 – 167 168 – 189 190 – 211 212 - 233 6 13 4 4 3 §Using the following frequency distribution of the home runs hit by Major League Baseball teams during the 2002 season, construct the histogram 45
- 46. Total Home Runs Class Boundaries Frequency Cumulative frequency 124 – 145 146 – 167 168 – 189 190 – 211 212 - 233 123.5 - 145.5 145.5 - 167.5 167.5 - 189.5 189.5 - 211.5 211.5 - 233.5 6 13 4 4 3 6 19 23 27 30 Total 30 § Class boundaries and their Frequency and cumulative frequency distributions 46
- 47. Histogram 15 12 9 6 3 0 Frequency 123.5 145.5 167.5 189.5 211.5 233.5 Figure 4: Total home runs hit by all players of each of the 30 Major League Baseball teams during the 2002 season 47
- 48. Frequency polygon § Frequency polygon: Is a graph formed by joining the midpoints of the tops of successive bars in a histogram with straight lines § The total area under the frequency polygon is equal to the area under the histogram 48
- 49. Frequency polygon 15 12 9 6 3 0 Frequency 134.5 156.5 178.5 200.5 222.5 Figure 5: Total home runs hit by all players of each of the 30 Major League Baseball teams during the 2002 season 49
- 50. Ogive § Ogive: Is a curve drawn for the cumulative frequency distribution by joining with straight lines the dots marked above the upper boundaries of classes at heights equal to the cumulative frequencies of respective classes 50
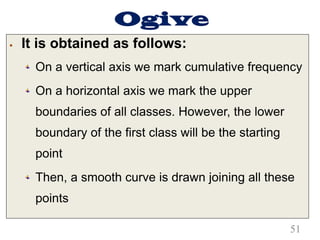
- 51. Ogive § It is obtained as follows: On a vertical axis we mark cumulative frequency On a horizontal axis we mark the upper boundaries of all classes. However, the lower boundary of the first class will be the starting point Then, a smooth curve is drawn joining all these points 51
- 52. Total Home Runs Class Boundaries Frequency Cumulative frequency 124 – 145 146 – 167 168 – 189 190 – 211 212 - 233 123.5 - 145.5 145.5 - 167.5 167.5 - 189.5 189.5 - 211.5 211.5 - 233.5 6 13 4 4 3 6 19 23 27 30 Total 30 § Class boundaries and their Frequency and cumulative frequency distributions 52
- 53. Ogive 123.5 145.5 167.5 189.5 211.5 233.5 30 25 20 15 10 5 Figure 6: Total home runs hit by all players of each of the 30 Major League Baseball teams during the 2002 season Cumulative frequency 53
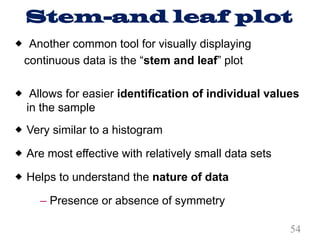
- 54. Stem-and leaf plot ® Another common tool for visually displaying continuous data is the “stem and leaf” plot ® Allows for easier identification of individual values in the sample ® Very similar to a histogram ® Are most effective with relatively small data sets ® Helps to understand the nature of data – Presence or absence of symmetry 54
- 55. Stem-and leaf plot § Can be constructed as follows: (1) Separate each data point into a stem component and a leaf component The stem component consists of the number formed by all but the rightmost digit of the number, and the leaf component consists of the rightmost digit. Thus the stem of the number 483 is 48, and the leaf is 3 (2) Write the smallest stem in the data set in the upper left-hand corner of the plot 55
- 56. Data of birth weights from 100 consecutive deliveries 56
- 57. Stem-and-leaf plot for the birth weight data (N=100) 57 Stem Leaves
- 58. Stem-and-leaf plot can be constructed as follows: (3) Write the second stem, which equals the fist stem + 1, below the fist stem (4) Continue with step until you reach the largest stem in the data set (5) Draw a vertical bar to the right of the column of stems (6) For each number in the data set, find the appropriate stem and write the leaf to the right of the vertical bar 58
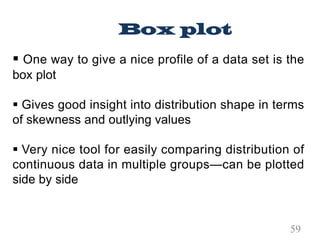
- 59. § One way to give a nice profile of a data set is the box plot § Gives good insight into distribution shape in terms of skewness and outlying values § Very nice tool for easily comparing distribution of continuous data in multiple groups—can be plotted side by side Box plot 59
- 60. Box plot: BP for 113 Males Boxplot of Systolic Blood Pressures Sample of 113 Men 60
- 61. Box plot: BP for 113 Males Sample Median Blood Pressure Box plot of Systolic Blood Pressures Sample of 113 Men 61
- 62. Box plot: BP for 113 Males 75th Percentile 25th Percentile Boxplot of Systolic Blood Pressures Sample of 113 Men 62
- 63. Box plot: BP for 113 Males Largest Observation Smallest Observation Boxplot of Systolic Blood Pressures Sample of 113 Men 63
- 64. Tabular and Graphical Procedures Qualitative Data Quantitative Data Tabular Methods Tabular Methods Graphical Methods Graphical Methods Data 64
- 65. 65 Thank you