SlideShare a Scribd company logo
Advanced Statistics
with Computer
Application
GROUP 1
MPA 1Y1-1
Advanced Statistics with Computer Application
Marivic De Gracia, Azenith Gonzalgo-Pua, Jaime Anne Larracas,
Djeriel Estrella, Florence Villpando-Mendoza, and Lyka Merilles
Introduction of Statistics and Importance of Statistics
Frequency Distribution and their Graphic Presentation
Collection and Presentation of Data
Outline
Measure of Central Tendency
STATISTICS
It is a branch of mathematics
that deals with collecting,
analyzing, interpreting,
organizing and presenting data.
It is a powerful tool used to make
sense of large amounts of
information, drawing
conclusions, making predictions,
and informing decisions based
on data.
Uses of Statistics
Economics
Weather Forecast
Medicine
Social sciences Decision making
Importance of Statistics
It is essential for analyzing and interpreting data,
providing the tools needed to make informed
decisions based on empirical evidence.
It helps people make informed decisions.
Governments, organizations, and businesses all collect
statistics to help them track progress, measure
performance, analyze problems, and prioritize.
• Data Driven Decision Making
• Understanding and Managing
Uncertainty
• Scientific Research and Innovation
• Social Understanding and Policy
Development
• Quality Control and Improvement
• Education and Learning
• Personal Decision Making
• Global Development and Sustainability
If Statistics is effectively utilized ....
Data Collection
DATA
Refers to any facts or figures that
are collated with the intention of
being presented, interpreted, and
analyzed.
Qualitative Quantitative
Data may be:
Data that describes
characteristics or
qualities.
Data that is
quantified or
measured.
Usually deals with
language
Usually deals with
numbers.
is descriptive. It
includes things like
color, texture, and
taste.
is numerical. It
includes things like
height, rate, and
speed.
TYPES OF QUANTITATIVE DATA
Discrete Data
The data that have fixed value is
called discrete data, discrete data can easily
be counted
Continuous Data
The data that has no fixed value and has a
range of data is called continuous data. It can
be measured
Identify each of the following pieces of data about
the girl pictured to the right as either qualitative or
quantitative:
1. Pink pants
2. Short hair
3.Five feet, three inches tall
4.Twenty years old
5.Outgoing personality
CHECK FOR UNDERSTANDING
Identify each of the following pieces of data about
the girl pictured to the right as either qualitative or
quantitative:
1. Pink pants = qualitative
2. Short hair = qualitative
3.Five feet, three inches tall = quantitative
4.Twenty two years old = quantitative
5.Outgoing personality = qualitative
CHECK FOR UNDERSTANDING
SOURCES OF DATA
Primary Data
is a type of information that is
obtained directly from the first-
hand source through experiments,
surveys or observations.
Secondary Data
is data collected by someone other
than the actual user. It means that
the information is already
available, and someone analyses
it.
DATA
COLLECTION
METHODS
Surveys and Questionnaires
Description: A method of gathering information from a sample of
people, typically by asking them a series of questions.
Application: Useful for collecting a large amount of data quickly from a
diverse group.
Experiments
Description: A method where variables are controlled and
manipulated to observe their effect on other variables.
Application: Commonly used in scientific research to test
hypotheses.
Observational Studies
Description: A method of collecting data by observing subjects in their
natural environment without interference.
Application: Useful when manipulation of variables is not possible or
ethical
Interviews
Description: A method involving direct, face-to-face, or telephonic
interaction to gather detailed information.
Application: Useful for collecting in-depth qualitative data.
Focus Group
Description: A method where a small group of people discuss a topic,
guided by a moderator, to gather opinions and attitudes.
Application: Useful for exploring complex issues and generating ideas.
Existing Records and Database
Description: A method that involves using pre-existing data from
sources like government databases, business records, or
academic research.
Application: Cost-effective and time-saving, but may require
careful evaluation of data reliability.
Presentation
of Data
Graphical
• exhibits the relation
between data, ideas,
information and concepts in
a diagram
• easy to understand
• depends on the type of
information in a particular
domain
Tabular
• A systematic
organization of
data in columns
and rows
Three Methods to Present Data
Textual
• presented in
paragraph form
• written and read
• a combination of
texts and figures.
Using Graphs to Represent
Data
S TAT I S T I CS
LI NE GRA P H
• Shows trends over time
• Can use more than one on the
same graph to compare data
sets
• Good for small amounts of
data
• Counts how many times data
occurs (frequency)
• Good for small amounts of
data
DOT P LOT
BAR GR AP H
• Used to compare groups.
• Used rectangular bars to
present the frequency or
value of data.
• Bars can be vertical or
horizontal.
• Used to depict parts of a
whole.
• A Circular chart divided
into sectors, with each
sector representing a
proportion of the whole.
P IE CHA RT
• Can use more than one to
compare data on the same
graph
• Good for large amounts of
data
B O X & W H I S K E R P L OT
• Counts how many times data
occurs between set ranges
• Good for large amounts of
data
HI STO GR AM
• Used images or symbols to
represent data .
• Each symbol represents a
specific quality, making it
easy to visualize and
compare.
P I C T O G R A P H
SCAT T ER P LOT
• Great for analyzing correlation
between two variables
• Good for large amounts of
data
Statistics provide single values to represent
data sets, but graphs are another tool for
analyzing data. Graphs represent data
visually, and serve to make trends in data
more clear.
ANALYZING GRAPHS
The same researcher is finished with her
experiment on the effects of music on plant
growth. She has calculated the average
amount of growth done by each group of
plants (Group One: 4 in., Group Two: 2 in.,
Group Three: 5 in.). What type of graph
would be best for this data set?
CHECK FOR UNDERSTANDING
...she has calculated the average amount of
growth done by each group of plants (Group One:
4 in., Group Two: 2 in., Group Three: 5 in.). What
type of graph would be best for this data set?
CHECK FOR UNDERSTANDING
A bar graph would be best for this data set
because she is comparing groups of plants.

More Related Content

Similar to Advanced Statistics with Computer Application (20)

PDF
Data presentation by nndd data presentation.pdf
ppmiitkgp
 
PPTX
Chapter 2 business mathematics for .pptx
nursophia27
 
PPTX
DATA PRESENTATION METHODS - 1.pptx
vineetarun1
 
PPTX
Unit 10 Data Management in epidemiology.pptx
samadali11085
 
PPTX
Biostatistics ppt
santhoshikayithi
 
DOCX
Edited economic statistics note
haramaya university
 
PPTX
Basics of Statistics
Manu Antony
 
PPT
NOTES1.ppt
NabilaZaid1
 
PPTX
Biostatistics pt 1
BipulBorthakur
 
PPTX
Artificial Intelligence - Data Analysis, Creative & Critical Thinking and AI...
Deboshree Chatterjee
 
PDF
datacollection and presentation.pdf
DibyenduBiswas31
 
PPT
Introduction to statistics
Shaamma(Simi_ch) Fiverr
 
PPTX
Module 1 Introduction to Statistics.pptx
Kishlay Kumar
 
PPTX
Stat-Lesson.pptx
JennilynFeliciano2
 
PPTX
Data presentation.pptx
ssusera0e0e9
 
PPT
Manpreet kay bhatia Business Statistics.ppt
Noorien3
 
PPTX
datacollectionandpresentation-181117043733-converted.pptx
anjaliagarwal93
 
PPTX
Chapter IV -Presentation of Data.pptx
MinardASaladino
 
DOCX
Note.docx
ashiquepa3
 
PPT
Introduction To Statistics.ppt
Manish Agarwal
 
Data presentation by nndd data presentation.pdf
ppmiitkgp
 
Chapter 2 business mathematics for .pptx
nursophia27
 
DATA PRESENTATION METHODS - 1.pptx
vineetarun1
 
Unit 10 Data Management in epidemiology.pptx
samadali11085
 
Biostatistics ppt
santhoshikayithi
 
Edited economic statistics note
haramaya university
 
Basics of Statistics
Manu Antony
 
NOTES1.ppt
NabilaZaid1
 
Biostatistics pt 1
BipulBorthakur
 
Artificial Intelligence - Data Analysis, Creative & Critical Thinking and AI...
Deboshree Chatterjee
 
datacollection and presentation.pdf
DibyenduBiswas31
 
Introduction to statistics
Shaamma(Simi_ch) Fiverr
 
Module 1 Introduction to Statistics.pptx
Kishlay Kumar
 
Stat-Lesson.pptx
JennilynFeliciano2
 
Data presentation.pptx
ssusera0e0e9
 
Manpreet kay bhatia Business Statistics.ppt
Noorien3
 
datacollectionandpresentation-181117043733-converted.pptx
anjaliagarwal93
 
Chapter IV -Presentation of Data.pptx
MinardASaladino
 
Note.docx
ashiquepa3
 
Introduction To Statistics.ppt
Manish Agarwal
 

Recently uploaded (20)

PPTX
classroom based quiz bee.pptx...................
ferdinandsanbuenaven
 
PDF
FULL DOCUMENT: Read the full Deloitte and Touche audit report on the National...
Kweku Zurek
 
PPTX
Views on Education of Indian Thinkers Mahatma Gandhi.pptx
ShrutiMahanta1
 
PDF
07.15.2025 - Managing Your Members Using a Membership Portal.pdf
TechSoup
 
PPTX
THE HUMAN INTEGUMENTARY SYSTEM#MLT#BCRAPC.pptx
Subham Panja
 
PPTX
How to Define Translation to Custom Module And Add a new language in Odoo 18
Celine George
 
PPTX
Nutri-QUIZ-Bee-Elementary.pptx...................
ferdinandsanbuenaven
 
PPTX
2025 Winter SWAYAM NPTEL & A Student.pptx
Utsav Yagnik
 
PPTX
SCHOOL-BASED SEXUAL HARASSMENT PREVENTION AND RESPONSE WORKSHOP
komlalokoe
 
PDF
IMP NAAC-Reforms-Stakeholder-Consultation-Presentation-on-Draft-Metrics-Unive...
BHARTIWADEKAR
 
PPT
digestive system for Pharm d I year HAP
rekhapositivity
 
PPTX
LEGAL ASPECTS OF PSYCHIATRUC NURSING.pptx
PoojaSen20
 
PPTX
Explorando Recursos do Summer '25: Dicas Essenciais - 02
Mauricio Alexandre Silva
 
PPTX
Latest Features in Odoo 18 - Odoo slides
Celine George
 
PDF
IMP NAAC REFORMS 2024 - 10 Attributes.pdf
BHARTIWADEKAR
 
PDF
Comprehensive Guide to Writing Effective Literature Reviews for Academic Publ...
AJAYI SAMUEL
 
PPTX
How to Configure Storno Accounting in Odoo 18 Accounting
Celine George
 
PPTX
HEAD INJURY IN CHILDREN: NURSING MANAGEMENGT.pptx
PRADEEP ABOTHU
 
PPTX
Maternal and Child Tracking system & RCH portal
Ms Usha Vadhel
 
PPTX
Modern analytical techniques used to characterize organic compounds. Birbhum ...
AyanHossain
 
classroom based quiz bee.pptx...................
ferdinandsanbuenaven
 
FULL DOCUMENT: Read the full Deloitte and Touche audit report on the National...
Kweku Zurek
 
Views on Education of Indian Thinkers Mahatma Gandhi.pptx
ShrutiMahanta1
 
07.15.2025 - Managing Your Members Using a Membership Portal.pdf
TechSoup
 
THE HUMAN INTEGUMENTARY SYSTEM#MLT#BCRAPC.pptx
Subham Panja
 
How to Define Translation to Custom Module And Add a new language in Odoo 18
Celine George
 
Nutri-QUIZ-Bee-Elementary.pptx...................
ferdinandsanbuenaven
 
2025 Winter SWAYAM NPTEL & A Student.pptx
Utsav Yagnik
 
SCHOOL-BASED SEXUAL HARASSMENT PREVENTION AND RESPONSE WORKSHOP
komlalokoe
 
IMP NAAC-Reforms-Stakeholder-Consultation-Presentation-on-Draft-Metrics-Unive...
BHARTIWADEKAR
 
digestive system for Pharm d I year HAP
rekhapositivity
 
LEGAL ASPECTS OF PSYCHIATRUC NURSING.pptx
PoojaSen20
 
Explorando Recursos do Summer '25: Dicas Essenciais - 02
Mauricio Alexandre Silva
 
Latest Features in Odoo 18 - Odoo slides
Celine George
 
IMP NAAC REFORMS 2024 - 10 Attributes.pdf
BHARTIWADEKAR
 
Comprehensive Guide to Writing Effective Literature Reviews for Academic Publ...
AJAYI SAMUEL
 
How to Configure Storno Accounting in Odoo 18 Accounting
Celine George
 
HEAD INJURY IN CHILDREN: NURSING MANAGEMENGT.pptx
PRADEEP ABOTHU
 
Maternal and Child Tracking system & RCH portal
Ms Usha Vadhel
 
Modern analytical techniques used to characterize organic compounds. Birbhum ...
AyanHossain
 
Ad

Advanced Statistics with Computer Application

  • 1. Advanced Statistics with Computer Application GROUP 1 MPA 1Y1-1 Advanced Statistics with Computer Application Marivic De Gracia, Azenith Gonzalgo-Pua, Jaime Anne Larracas, Djeriel Estrella, Florence Villpando-Mendoza, and Lyka Merilles
  • 2. Introduction of Statistics and Importance of Statistics Frequency Distribution and their Graphic Presentation Collection and Presentation of Data Outline Measure of Central Tendency
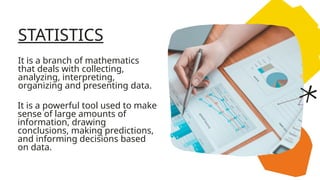
  • 3. STATISTICS It is a branch of mathematics that deals with collecting, analyzing, interpreting, organizing and presenting data. It is a powerful tool used to make sense of large amounts of information, drawing conclusions, making predictions, and informing decisions based on data.
  • 4. Uses of Statistics Economics Weather Forecast Medicine Social sciences Decision making
  • 5. Importance of Statistics It is essential for analyzing and interpreting data, providing the tools needed to make informed decisions based on empirical evidence. It helps people make informed decisions. Governments, organizations, and businesses all collect statistics to help them track progress, measure performance, analyze problems, and prioritize.
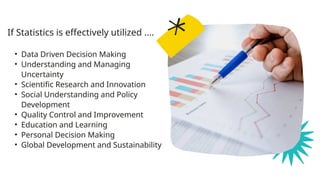
  • 6. • Data Driven Decision Making • Understanding and Managing Uncertainty • Scientific Research and Innovation • Social Understanding and Policy Development • Quality Control and Improvement • Education and Learning • Personal Decision Making • Global Development and Sustainability If Statistics is effectively utilized ....
  • 8. DATA Refers to any facts or figures that are collated with the intention of being presented, interpreted, and analyzed.
  • 9. Qualitative Quantitative Data may be: Data that describes characteristics or qualities. Data that is quantified or measured. Usually deals with language Usually deals with numbers. is descriptive. It includes things like color, texture, and taste. is numerical. It includes things like height, rate, and speed.
  • 10. TYPES OF QUANTITATIVE DATA Discrete Data The data that have fixed value is called discrete data, discrete data can easily be counted Continuous Data The data that has no fixed value and has a range of data is called continuous data. It can be measured
  • 11. Identify each of the following pieces of data about the girl pictured to the right as either qualitative or quantitative: 1. Pink pants 2. Short hair 3.Five feet, three inches tall 4.Twenty years old 5.Outgoing personality CHECK FOR UNDERSTANDING
  • 12. Identify each of the following pieces of data about the girl pictured to the right as either qualitative or quantitative: 1. Pink pants = qualitative 2. Short hair = qualitative 3.Five feet, three inches tall = quantitative 4.Twenty two years old = quantitative 5.Outgoing personality = qualitative CHECK FOR UNDERSTANDING
  • 13. SOURCES OF DATA Primary Data is a type of information that is obtained directly from the first- hand source through experiments, surveys or observations. Secondary Data is data collected by someone other than the actual user. It means that the information is already available, and someone analyses it.
  • 15. Surveys and Questionnaires Description: A method of gathering information from a sample of people, typically by asking them a series of questions. Application: Useful for collecting a large amount of data quickly from a diverse group. Experiments Description: A method where variables are controlled and manipulated to observe their effect on other variables. Application: Commonly used in scientific research to test hypotheses.
  • 16. Observational Studies Description: A method of collecting data by observing subjects in their natural environment without interference. Application: Useful when manipulation of variables is not possible or ethical Interviews Description: A method involving direct, face-to-face, or telephonic interaction to gather detailed information. Application: Useful for collecting in-depth qualitative data.
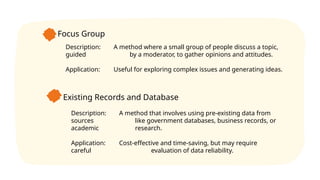
  • 17. Focus Group Description: A method where a small group of people discuss a topic, guided by a moderator, to gather opinions and attitudes. Application: Useful for exploring complex issues and generating ideas. Existing Records and Database Description: A method that involves using pre-existing data from sources like government databases, business records, or academic research. Application: Cost-effective and time-saving, but may require careful evaluation of data reliability.
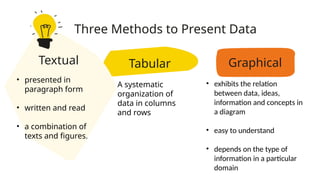
  • 19. Graphical • exhibits the relation between data, ideas, information and concepts in a diagram • easy to understand • depends on the type of information in a particular domain Tabular • A systematic organization of data in columns and rows Three Methods to Present Data Textual • presented in paragraph form • written and read • a combination of texts and figures.
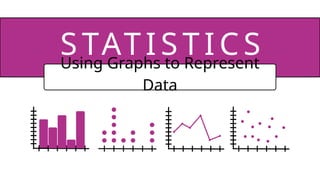
  • 20. Using Graphs to Represent Data S TAT I S T I CS
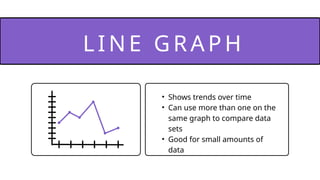
  • 21. LI NE GRA P H • Shows trends over time • Can use more than one on the same graph to compare data sets • Good for small amounts of data
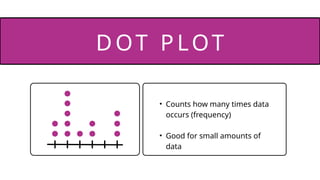
  • 22. • Counts how many times data occurs (frequency) • Good for small amounts of data DOT P LOT
  • 23. BAR GR AP H • Used to compare groups. • Used rectangular bars to present the frequency or value of data. • Bars can be vertical or horizontal.
  • 24. • Used to depict parts of a whole. • A Circular chart divided into sectors, with each sector representing a proportion of the whole. P IE CHA RT
  • 25. • Can use more than one to compare data on the same graph • Good for large amounts of data B O X & W H I S K E R P L OT
  • 26. • Counts how many times data occurs between set ranges • Good for large amounts of data HI STO GR AM
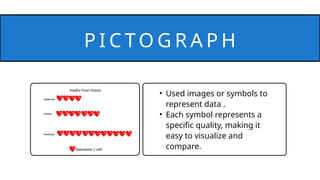
  • 27. • Used images or symbols to represent data . • Each symbol represents a specific quality, making it easy to visualize and compare. P I C T O G R A P H
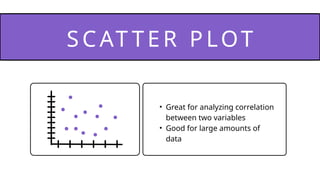
  • 28. SCAT T ER P LOT • Great for analyzing correlation between two variables • Good for large amounts of data
  • 29. Statistics provide single values to represent data sets, but graphs are another tool for analyzing data. Graphs represent data visually, and serve to make trends in data more clear. ANALYZING GRAPHS
  • 30. The same researcher is finished with her experiment on the effects of music on plant growth. She has calculated the average amount of growth done by each group of plants (Group One: 4 in., Group Two: 2 in., Group Three: 5 in.). What type of graph would be best for this data set? CHECK FOR UNDERSTANDING
  • 31. ...she has calculated the average amount of growth done by each group of plants (Group One: 4 in., Group Two: 2 in., Group Three: 5 in.). What type of graph would be best for this data set? CHECK FOR UNDERSTANDING A bar graph would be best for this data set because she is comparing groups of plants.