


Basic business statistics 2
- 1. Basic Business Statistics, 10e © 2006 Prentice-Hall, Inc. Chap 2-1 Chapter 2 Presenting Data in Tables and Charts Basic Business Statistics 10th Edition
- 2. Basic Business Statistics, 10e © 2006 Prentice-Hall, Inc. Chap 2-2 Learning Objectives In this chapter you learn: To develop tables and charts for categorical data To develop tables and charts for numerical data The principles of properly presenting graphs
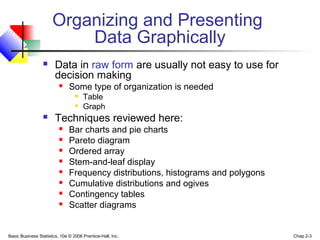
- 3. Basic Business Statistics, 10e © 2006 Prentice-Hall, Inc. Chap 2-3 Organizing and Presenting Data Graphically Data in raw form are usually not easy to use for decision making Some type of organization is needed Table Graph Techniques reviewed here: Bar charts and pie charts Pareto diagram Ordered array Stem-and-leaf display Frequency distributions, histograms and polygons Cumulative distributions and ogives Contingency tables Scatter diagrams
- 4. Basic Business Statistics, 10e © 2006 Prentice-Hall, Inc. Chap 2-4 Tables and Charts for Categorical Data Categorical Data Graphing Data Pie Charts Pareto Diagram Bar Charts Tabulating Data Summary Table
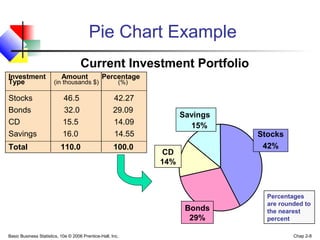
- 5. Basic Business Statistics, 10e © 2006 Prentice-Hall, Inc. Chap 2-5 The Summary Table Example: Current Investment Portfolio Investment Amount Percentage Type (in thousands $) (%) Stocks 46.5 42.27 Bonds 32.0 29.09 CD 15.5 14.09 Savings 16.0 14.55 Total 110.0 100.0 (Variables are Categorical) Summarize data by category
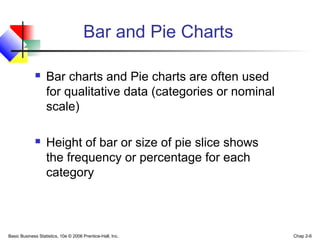
- 6. Basic Business Statistics, 10e © 2006 Prentice-Hall, Inc. Chap 2-6 Bar and Pie Charts Bar charts and Pie charts are often used for qualitative data (categories or nominal scale) Height of bar or size of pie slice shows the frequency or percentage for each category
- 7. Basic Business Statistics, 10e © 2006 Prentice-Hall, Inc. Chap 2-7 Bar Chart Example Investor's Portfolio 0 10 20 30 40 50 Stocks Bonds CD Savings Amount in $1000's Investment Amount Percentage Type (in thousands $) (%) Stocks 46.5 42.27 Bonds 32.0 29.09 CD 15.5 14.09 Savings 16.0 14.55 Total 110.0 100.0 Current Investment Portfolio
- 8. Basic Business Statistics, 10e © 2006 Prentice-Hall, Inc. Chap 2-8 Pie Chart Example Percentages are rounded to the nearest percent Current Investment Portfolio Savings 15% CD 14% Bonds 29% Stocks 42% Investment Amount Percentage Type (in thousands $) (%) Stocks 46.5 42.27 Bonds 32.0 29.09 CD 15.5 14.09 Savings 16.0 14.55 Total 110.0 100.0
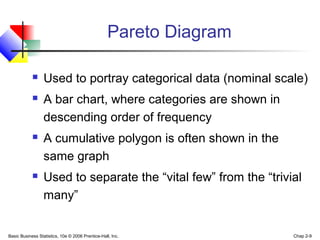
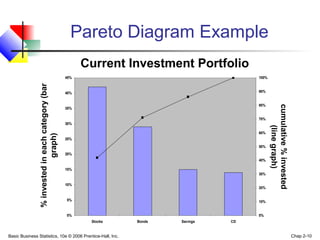
- 9. Basic Business Statistics, 10e © 2006 Prentice-Hall, Inc. Chap 2-9 Pareto Diagram Used to portray categorical data (nominal scale) A bar chart, where categories are shown in descending order of frequency A cumulative polygon is often shown in the same graph Used to separate the “vital few” from the “trivial many”
- 10. Basic Business Statistics, 10e © 2006 Prentice-Hall, Inc. Chap 2-10 Pareto Diagram Example cumulative%invested (linegraph) %investedineachcategory(bar graph) 0% 5% 10% 15% 20% 25% 30% 35% 40% 45% Stocks Bonds Savings CD 0% 10% 20% 30% 40% 50% 60% 70% 80% 90% 100% Current Investment Portfolio
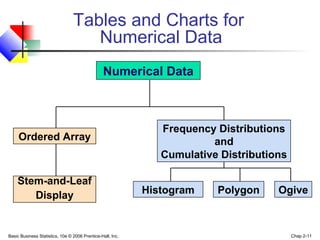
- 11. Basic Business Statistics, 10e © 2006 Prentice-Hall, Inc. Chap 2-11 Tables and Charts for Numerical Data Numerical Data Ordered Array Stem-and-Leaf Display Histogram Polygon Ogive Frequency Distributions and Cumulative Distributions
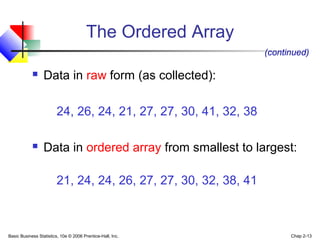
- 12. Basic Business Statistics, 10e © 2006 Prentice-Hall, Inc. Chap 2-12 The Ordered Array A sequence of data in rank order: Shows range (min to max) Provides some signals about variability within the range May help identify outliers (unusual observations) If the data set is large, the ordered array is less useful
- 13. Basic Business Statistics, 10e © 2006 Prentice-Hall, Inc. Chap 2-13 Data in raw form (as collected): 24, 26, 24, 21, 27, 27, 30, 41, 32, 38 Data in ordered array from smallest to largest: 21, 24, 24, 26, 27, 27, 30, 32, 38, 41 (continued) The Ordered Array
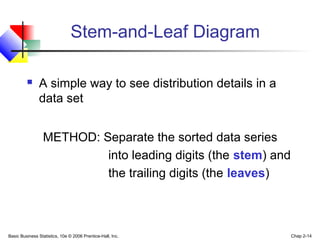
- 14. Basic Business Statistics, 10e © 2006 Prentice-Hall, Inc. Chap 2-14 Stem-and-Leaf Diagram A simple way to see distribution details in a data set METHOD: Separate the sorted data series into leading digits (the stem) and the trailing digits (the leaves)
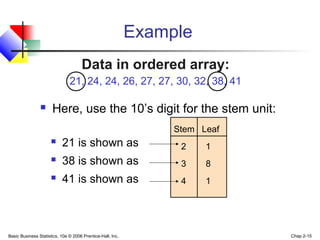
- 15. Basic Business Statistics, 10e © 2006 Prentice-Hall, Inc. Chap 2-15 Example Here, use the 10’s digit for the stem unit: Data in ordered array: 21, 24, 24, 26, 27, 27, 30, 32, 38, 41 21 is shown as 38 is shown as 41 is shown as Stem Leaf 2 1 3 8 4 1
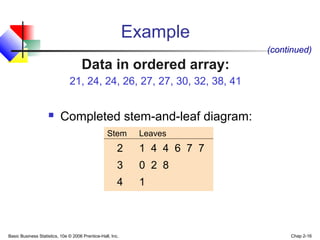
- 16. Basic Business Statistics, 10e © 2006 Prentice-Hall, Inc. Chap 2-16 Example Completed stem-and-leaf diagram: Stem Leaves 2 1 4 4 6 7 7 3 0 2 8 4 1 (continued) Data in ordered array: 21, 24, 24, 26, 27, 27, 30, 32, 38, 41
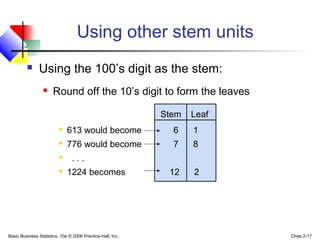
- 17. Basic Business Statistics, 10e © 2006 Prentice-Hall, Inc. Chap 2-17 Using other stem units Using the 100’s digit as the stem: Round off the 10’s digit to form the leaves 613 would become 6 1 776 would become 7 8 . . . 1224 becomes 12 2 Stem Leaf
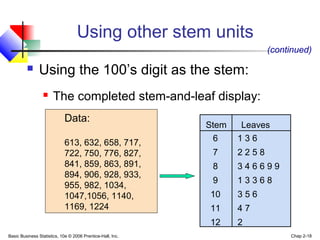
- 18. Basic Business Statistics, 10e © 2006 Prentice-Hall, Inc. Chap 2-18 Using other stem units Using the 100’s digit as the stem: The completed stem-and-leaf display: Stem Leaves (continued) 6 1 3 6 7 2 2 5 8 8 3 4 6 6 9 9 9 1 3 3 6 8 10 3 5 6 11 4 7 12 2 Data: 613, 632, 658, 717, 722, 750, 776, 827, 841, 859, 863, 891, 894, 906, 928, 933, 955, 982, 1034, 1047,1056, 1140, 1169, 1224
- 19. Basic Business Statistics, 10e © 2006 Prentice-Hall, Inc. Chap 2-19 What is a Frequency Distribution? A frequency distribution is a list or a table … containing class groupings (ranges within which the data fall) ... and the corresponding frequencies with which data fall within each grouping or category Tabulating Numerical Data: Frequency Distributions
- 20. Basic Business Statistics, 10e © 2006 Prentice-Hall, Inc. Chap 2-20 Why Use a Frequency Distribution? It is a way to summarize numerical data It condenses the raw data into a more useful form... It allows for a quick visual interpretation of the data
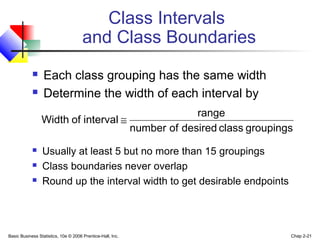
- 21. Basic Business Statistics, 10e © 2006 Prentice-Hall, Inc. Chap 2-21 Class Intervals and Class Boundaries Each class grouping has the same width Determine the width of each interval by Usually at least 5 but no more than 15 groupings Class boundaries never overlap Round up the interval width to get desirable endpoints groupingsclassdesiredofnumber range intervalofWidth ≅
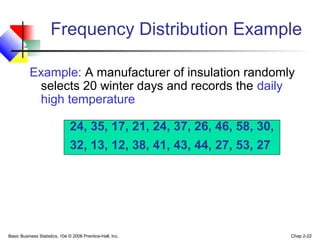
- 22. Basic Business Statistics, 10e © 2006 Prentice-Hall, Inc. Chap 2-22 Frequency Distribution Example Example: A manufacturer of insulation randomly selects 20 winter days and records the daily high temperature 24, 35, 17, 21, 24, 37, 26, 46, 58, 30, 32, 13, 12, 38, 41, 43, 44, 27, 53, 27
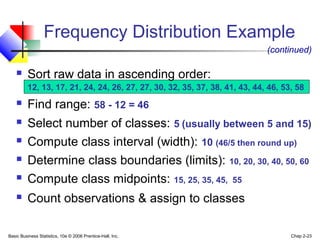
- 23. Basic Business Statistics, 10e © 2006 Prentice-Hall, Inc. Chap 2-23 Sort raw data in ascending order: 12, 13, 17, 21, 24, 24, 26, 27, 27, 30, 32, 35, 37, 38, 41, 43, 44, 46, 53, 58 Find range: 58 - 12 = 46 Select number of classes: 5 (usually between 5 and 15) Compute class interval (width): 10 (46/5 then round up) Determine class boundaries (limits): 10, 20, 30, 40, 50, 60 Compute class midpoints: 15, 25, 35, 45, 55 Count observations & assign to classes Frequency Distribution Example (continued)
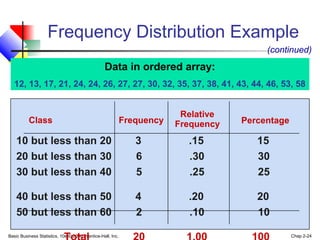
- 24. Basic Business Statistics, 10e © 2006 Prentice-Hall, Inc. Chap 2-24 Frequency Distribution Example Class Frequency 10 but less than 20 3 .15 15 20 but less than 30 6 .30 30 30 but less than 40 5 .25 25 40 but less than 50 4 .20 20 50 but less than 60 2 .10 10 Relative Frequency Percentage Data in ordered array: 12, 13, 17, 21, 24, 24, 26, 27, 27, 30, 32, 35, 37, 38, 41, 43, 44, 46, 53, 58 (continued)
- 25. Basic Business Statistics, 10e © 2006 Prentice-Hall, Inc. Chap 2-25 Tabulating Numerical Data: Cumulative Frequency Class 10 but less than 20 3 15 3 15 20 but less than 30 6 30 9 45 30 but less than 40 5 25 14 70 40 but less than 50 4 20 18 90 50 but less than 60 2 10 20 100 Total 20 100 Percentage Cumulative Percentage Data in ordered array: 12, 13, 17, 21, 24, 24, 26, 27, 27, 30, 32, 35, 37, 38, 41, 43, 44, 46, 53, 58 Frequency Cumulative Frequency
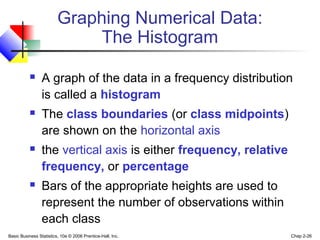
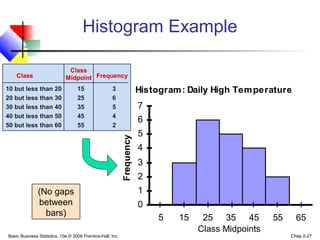
- 26. Basic Business Statistics, 10e © 2006 Prentice-Hall, Inc. Chap 2-26 Graphing Numerical Data: The Histogram A graph of the data in a frequency distribution is called a histogram The class boundaries (or class midpoints) are shown on the horizontal axis the vertical axis is either frequency, relative frequency, or percentage Bars of the appropriate heights are used to represent the number of observations within each class
- 27. Basic Business Statistics, 10e © 2006 Prentice-Hall, Inc. Chap 2-27 Histogram: Daily High Temperature 0 1 2 3 4 5 6 7 5 15 25 35 45 55 65 Frequency Class Midpoints Histogram Example (No gaps between bars) Class 10 but less than 20 15 3 20 but less than 30 25 6 30 but less than 40 35 5 40 but less than 50 45 4 50 but less than 60 55 2 Frequency Class Midpoint
- 28. Basic Business Statistics, 10e © 2006 Prentice-Hall, Inc. Chap 2-28 Frequency Polygon: Daily High Temperature 0 1 2 3 4 5 6 7 5 15 25 35 45 55 65 Frequency Graphing Numerical Data: The Frequency Polygon Class Midpoints Class 10 but less than 20 15 3 20 but less than 30 25 6 30 but less than 40 35 5 40 but less than 50 45 4 50 but less than 60 55 2 Frequency Class Midpoint (In a percentage polygon the vertical axis would be defined to show the percentage of observations per class)
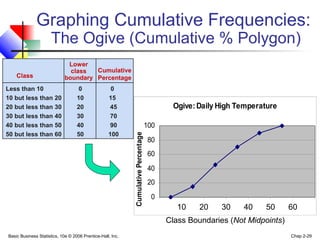
- 29. Basic Business Statistics, 10e © 2006 Prentice-Hall, Inc. Chap 2-29 Graphing Cumulative Frequencies: The Ogive (Cumulative % Polygon) Ogive:Daily High Temperature 0 20 40 60 80 100 10 20 30 40 50 60 CumulativePercentage Class Boundaries (Not Midpoints) Class Less than 10 0 0 10 but less than 20 10 15 20 but less than 30 20 45 30 but less than 40 30 70 40 but less than 50 40 90 50 but less than 60 50 100 Cumulative Percentage Lower class boundary 10 20 30 40 50 60
- 30. Basic Business Statistics, 10e © 2006 Prentice-Hall, Inc. Chap 2-30 Tabulating and Graphing Multivariate Categorical Data Contingency Table for Investment Choices ($1000’s) Investment Investor A Investor B Investor C Total Category Stocks 46.5 55 27.5 129 Bonds 32.0 44 19.0 95 CD 15.5 20 13.5 49 Savings 16.0 28 7.0 51 Total 110.0 147 67.0 324 (Individual values could also be expressed as percentages of the overall total, percentages of the row totals, or percentages of the column totals)
- 31. Basic Business Statistics, 10e © 2006 Prentice-Hall, Inc. Chap 2-31 Side-by-side bar charts (continued) Tabulating and Graphing Multivariate Categorical Data Comparing Investors 0 10 20 30 40 50 60 S tocks B onds CD S avings Investor A Investor B Investor C
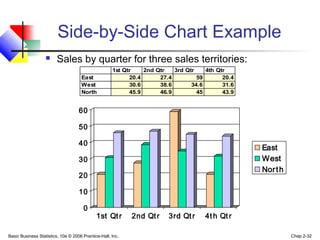
- 32. Basic Business Statistics, 10e © 2006 Prentice-Hall, Inc. Chap 2-32 Side-by-Side Chart Example Sales by quarter for three sales territories: 0 10 20 30 40 50 60 1st Qtr 2nd Qtr 3rd Qtr 4th Qtr East West North 1st Qtr 2nd Qtr 3rd Qtr 4th Qtr East 20.4 27.4 59 20.4 West 30.6 38.6 34.6 31.6 North 45.9 46.9 45 43.9
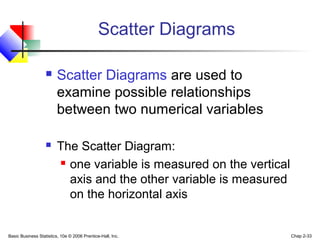
- 33. Basic Business Statistics, 10e © 2006 Prentice-Hall, Inc. Chap 2-33 Scatter Diagrams are used to examine possible relationships between two numerical variables The Scatter Diagram: one variable is measured on the vertical axis and the other variable is measured on the horizontal axis Scatter Diagrams
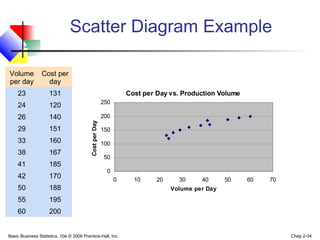
- 34. Basic Business Statistics, 10e © 2006 Prentice-Hall, Inc. Chap 2-34 Scatter Diagram Example Cost per Day vs. Production Volume 0 50 100 150 200 250 0 10 20 30 40 50 60 70 Volume per Day CostperDay Volume per day Cost per day 23 131 24 120 26 140 29 151 33 160 38 167 41 185 42 170 50 188 55 195 60 200
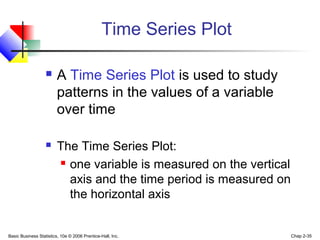
- 35. Basic Business Statistics, 10e © 2006 Prentice-Hall, Inc. Chap 2-35 A Time Series Plot is used to study patterns in the values of a variable over time The Time Series Plot: one variable is measured on the vertical axis and the time period is measured on the horizontal axis Time Series Plot
- 36. Basic Business Statistics, 10e © 2006 Prentice-Hall, Inc. Chap 2-36 Scatter Diagram Example Number of Franchises, 1996-2004 0 20 40 60 80 100 120 1994 1996 1998 2000 2002 2004 2006 Year Numberof Franchises Year Number of Franchises 1996 43 1997 54 1998 60 1999 73 2000 82 2001 95 2002 107 2003 99 2004 95
- 37. Basic Business Statistics, 10e © 2006 Prentice-Hall, Inc. Chap 2-37 Misusing Graphs and Ethical Issues Guidelines for good graphs: Do not distort the data Avoid unnecessary adornments (no “chart junk”) Use a scale for each axis on a two-dimensional graph The vertical axis scale should begin at zero Properly label all axes The graph should contain a title Use the simplest graph for a given set of data
- 38. Basic Business Statistics, 10e © 2006 Prentice-Hall, Inc. Chap 2-38 Chapter Summary Data in raw form are usually not easy to use for decision making -- Some type of organization is needed: ♦ Table ♦ Graph Techniques reviewed in this chapter: Bar charts, pie charts, and Pareto diagrams Ordered array and stem-and-leaf display Frequency distributions, histograms and polygons Cumulative distributions and ogives Contingency tables and side-by-side bar charts Scatter diagrams and time series plots