SlideShare a Scribd company logo
2
Most read
4
Most read
17
Most read
Basics of
Statistics
By
Ganesh Raju
What is Statistics?
“Statistics is concerned with the inferential process, in particular with planning and
analysis of experiments or surveys, with the nature of observational errors and sources of
variability that obscure underlying patters, and with efficient summarizing of set of data”
= Kruskal
Why should we use statistics?
Statistical methods are required to ensure that data are interpreted correctly and the
apparent relationship are meaningful and not simply chance occurrence.
Statistics in Different Field
1. Business
2. Economics
3. Banking
4. Accounts and Auditing etc.,
Every day example…
1. Weather forecast
2. Emergency preparedness
3. Predicting diseases
4. Medical study
5. Political campaigns etc.,
Types of Data
Qualitative Quantitative
Discrete Continuous
• Qualitative Data
Qualitative data can be arranged into categories that are non numerical. These
categories can be physical traits, gender, colors or anything that does not have a number
associated to it. Qualitative data is sometimes referred to as categorical data
•Examples:
•Hair color (black, brown, blonde, white, grey, mahogany)
•Make of car (Dodge, Honda, Ford, Toyota)
•Gender (male, female)
•Place of birth (Riyadh, Jeddah, Yanbu)
• Quantitative Data
Quantitative data are measures of values or counts and are
expressed in numeric variables.
Examples:
For each orange tree, the number of oranges is measured
For a particular day, the number of cars entering a college
campus is measured
Time until a light bulb burns out
Etc.,
Four Basic Scale of Measurement
Nominal Scale:
This scale is the crudest among all measurement scales but is also the simplest scale.
In this scale the different scores on a measurement simply indicate different
categories.
The nominal scale is often referred to as a categorical scale. The assigned numbers
have no arithmetic properties and act only as labels. The only statistical operation that
can be performed on nominal scales is a frequency count. We cannot determine an
average except mode.
Examples:
Gender (1= male, 0=female)
ZIP code (7000=Philippines, …)
Plate numbers of vehicles (JK3429, MC001, …)
Course (Biology, Mathematics, History, …)
Race (Asian, American, …)
Eye color (Brown, Blue, …)
Ordinal Scale:
It involves the ranking of items along the continuum of the characteristic being scales.
In this scale, the items are classified according to whether they have more or less of
characteristic.
The main characteristic of the ordinal scale is that the categories have a logical or
ordered relationship. This type of scale permits the measurement of degrees of
difference, (i.e. 'more’ or ‘less’) but not the specific amount of differences (i.e. how
much ‘more’ or ‘less’).
Examples:
Ranks in a race (first, second, third, …)
Sizes of shirts (small, medium, large, …)
Order of birth (first child, second child , third child , …)
Socio-economic status (lower, middle, upper, …)
Difficulty level of a test (easy, average, difficult, …)
Degree of agreement (SD, D, A, SA)
Interval scale
Interval scale is a scale in which the numbers are used to rank attributes such that
numerically equal distance on the scale represent equal distance in the characteristic
being measured. An interval scale contains all the information of an ordinal scale, but
it also one allows to compare the difference/distance between attributes. Interval
scales may be either in numeric or semantic formats.
Examples:
Temperature (in oF or oC)
IQ Scores
Ratio scale
The highest scale, it allows the researcher to identify or classify objects, and compare
intervals or differences. It is also meaningful to compute ratios of scale values.
Is a possesses all the properties of the nomincal, ordinal and interval scale and in
addition an absolute zero point.
It is also meaningful to compute ratios of scale values. In the marketing , sales, costs,
market share and number of customers are available measure on ratio scale.
Examples:
I. Height (165cm, 154cm, 144cm, …)
II. Reaction time (20sec, 43sec, 37sec, …)
III. Number of siblings (2, 5, 8, …)
IV. Hours spent on studying for an exam (0, 2, 3, …)
Primary Scales of Measurement
Discrete and Continuous Data
 Numerical data could be either discrete or continuous.
 Continuous data can take any numerical value (within a range);
For example, weight, height, etc.,
 There can be an infinite number of possible values in continuous
data.
 Discrete data can take only certain values by a finite ;jumps;, i., it
‘jumps’ from one value to another but does not take any
intermediate value between them (For example, umber of
students in the class)
Example for Discrete and Continuous Data
A good example to distinguish discrete data from continuous data
is digital and analogue meter or clock were digital is discrete and
analog is continuous.
Examples of conversion of
discrete to continuous Data
Area of Statistics
Descriptive statistical limits generalization to
the particular group of individuals observed.
That is:
1. No conclusions are extended beyond
this group
2. Any similarity to those outside the
group cannot be assumed.
3. The data describe one group and that
group only.
Example: Assessment findings, findings a
much simpler action research.
Inferential analysis selects a small group out
of larger group an the findings are applied to
the larger group. It is used to estimate a
parameter, the corresponding value in the
population from the which the sample is
selected.
It is necessary to carefully select the sample
or the inferences may not apply to the
population.
Descriptive Statistics
Measures of Central Tendency and Dispersion
Measures of Central Tendency
Mean Median Mode
Definition The Arithmetic Average
The middle score in a
distribution of scores
organized from highest or
lowest or lowest to
highest
The score occurring with
greatest frequency
Use With
Interval and Ratio Ordinal, interval and Ratio
data
Nominal, Ordinal, Interval
or ratio data
Caution
Not for use with
distributions with a few
extreme scores.
Not a reliable measure of
central tendency
Measures of Dispersion
Range Ave.Deviation Std.Deviation
Definition
The difference between the
lowest and highest scores
in the distribution.
The average distance of all of the
scores from the mean of the
distribution
The square root of the
average squared
deviation from the mean
of a distribution
Use With
Primarily interval and ratio
data, but can be used with
any type of data
Only interval and ratio data
Only interval and ratio
data
Caution
A simple measure that does
not use all scores in the
distribution in its
calculation.
A more sophisticated measure in
which all scores are used, but which
may not weight extreme scores
adequately.
The most sophisticated
and most frequently
used measure of
variation.
Inferential Statistics
Inferences and
Generalizations
Smaller Set
(n units/observations)
Larger Set
(N units/observations)
https://w55e7twkl7vq3lexl8-s-a2157.bj.tsgdht.cn/kotharivr/02-descriptive-statistics

More Related Content

What's hot (20)

PPTX
Data and its Types
RajaKrishnan M
 
PPTX
Measurementand scaling-10
University of Balochistan
 
PPSX
Types of Statistics
loranel
 
PPTX
Data measurement techniques
Janki Pandya
 
PPTX
Basic Descriptive statistics
Ajendra Sharma
 
PPTX
Statistics
itutor
 
PPTX
Descriptive statistics
University of Jaffna
 
PPT
Statistics final seminar
Tejas Jagtap
 
PPTX
Systematic sampling in probability sampling
Sachin H
 
PPT
Data Preparation and Processing
Mehul Gondaliya
 
PPTX
Data Collection Preparation
Business Student
 
PPT
Manova
Arun Nagarajan
 
PPTX
1.2 types of data
Long Beach City College
 
PPTX
Data Presentation & Analysis.pptx
heencomm
 
PPTX
Descriptive statistics
Abdelrahman Alkilani
 
PPT
Inferential Statistics
ewhite00
 
PPTX
Measures of central tendancy
Pranav Krishna
 
PPTX
STAT 1 - Basic-Concepts-in-Statistics.pptx
JerryJunCuizon
 
PPTX
Data analysis using spss
Syed Faisal
 
PPTX
Judgement-Sampling PowerPoint presentation
samoraysweetchell701
 
Data and its Types
RajaKrishnan M
 
Measurementand scaling-10
University of Balochistan
 
Types of Statistics
loranel
 
Data measurement techniques
Janki Pandya
 
Basic Descriptive statistics
Ajendra Sharma
 
Statistics
itutor
 
Descriptive statistics
University of Jaffna
 
Statistics final seminar
Tejas Jagtap
 
Systematic sampling in probability sampling
Sachin H
 
Data Preparation and Processing
Mehul Gondaliya
 
Data Collection Preparation
Business Student
 
1.2 types of data
Long Beach City College
 
Data Presentation & Analysis.pptx
heencomm
 
Descriptive statistics
Abdelrahman Alkilani
 
Inferential Statistics
ewhite00
 
Measures of central tendancy
Pranav Krishna
 
STAT 1 - Basic-Concepts-in-Statistics.pptx
JerryJunCuizon
 
Data analysis using spss
Syed Faisal
 
Judgement-Sampling PowerPoint presentation
samoraysweetchell701
 

Similar to Basic statistics (20)

PPTX
lesson-1_Introduction-to-Statistics.pptx
RizalieIco
 
PPTX
Introduction to statistics
ScholarsPoint1
 
PDF
Data Analysis with SPSS PPT.pdf
Thanavathi C
 
PPTX
AGRICULTURAL-STATISTICS.pptx
DianeJieRobuca1
 
PPTX
Statistics.pptx
lavanya209529
 
PDF
Biostatistics ppt.pdf
AbdulrezakHusein
 
PPT
Emba502 day 2
Nahid Amin
 
PPTX
edu.Chapter-3.1-Statistic-Refresher-1.pptx
lmareno
 
PPTX
Chapter 1 of the book Basic Statistics as described by teacher
karamjit18
 
PPTX
Probability_and_Statistics_lecture_notes_1.pptx
AliMurat5
 
PPTX
Introduction to Statistics and Arithmetic Mean
Mamatha Upadhya
 
PDF
Day1, session i- spss
abir hossain
 
PDF
SPSS
Abir Hossain
 
PPTX
Introduction to statistics.pptx
Unfold1
 
PPT
Week 7 a statistics
wawaaa789
 
PPT
Aed1222 lesson 2
nurun2010
 
PPTX
Presentation1.pptx
IndhuGreen
 
PPTX
Types of Data, Key Concept
Long Beach City College
 
PPTX
fundamentals of data science and analytics on descriptive analysis.pptx
kumaragurusv
 
PPT
Ebd1 lecture 3 2010
Reko Kemo
 
lesson-1_Introduction-to-Statistics.pptx
RizalieIco
 
Introduction to statistics
ScholarsPoint1
 
Data Analysis with SPSS PPT.pdf
Thanavathi C
 
AGRICULTURAL-STATISTICS.pptx
DianeJieRobuca1
 
Statistics.pptx
lavanya209529
 
Biostatistics ppt.pdf
AbdulrezakHusein
 
Emba502 day 2
Nahid Amin
 
edu.Chapter-3.1-Statistic-Refresher-1.pptx
lmareno
 
Chapter 1 of the book Basic Statistics as described by teacher
karamjit18
 
Probability_and_Statistics_lecture_notes_1.pptx
AliMurat5
 
Introduction to Statistics and Arithmetic Mean
Mamatha Upadhya
 
Day1, session i- spss
abir hossain
 
Introduction to statistics.pptx
Unfold1
 
Week 7 a statistics
wawaaa789
 
Aed1222 lesson 2
nurun2010
 
Presentation1.pptx
IndhuGreen
 
Types of Data, Key Concept
Long Beach City College
 
fundamentals of data science and analytics on descriptive analysis.pptx
kumaragurusv
 
Ebd1 lecture 3 2010
Reko Kemo
 
Ad

Recently uploaded (20)

PPTX
Cells are the fundamental structural and functional units of life, and their ...
tarun35435605
 
PPT
Nitration is a key chemical reaction where a nitro group (-NO₂) is introduced...
PravinKhatale2
 
PPTX
2.0 PRO RESPONSIBILITIES of COMMUNITY PHARMACISTS.pptx
Raveendra Hullolikar
 
PDF
Best Diet Plan For The Hairfall & Healthy Hair
Toxic Free India
 
PPTX
Leukemia / Acute Leukemia/ AML/ ALL.pptx
Ayesha Fatima
 
PPTX
ICCA Training - Non ICU Staff V1.pptx Slides
digitalcriticalcare
 
PDF
Seen and Celebrated! Bassem Matta Vanderbilt, 2
Smiling Lungs
 
PDF
Concept of theater privatization; prospect and challenges to patients and hea...
Nr. Halliru Kabir
 
PPTX
basic nutrition and diet plan for caregiving
KingSonDismaya1
 
PDF
Craig Kent served as Chair of American Board of Surgery.pdf
Craig Kent
 
PPTX
Visual Inspection with Ascetic Acid Cervicography(VIAC).pptx
IrvineMusara
 
PPTX
NEONATAL SEPSIS AND MANAGEMENT......pptx
KalupsaDick
 
PPTX
CAP-IDSA-2019 MANAGEMENT GUIDELINES.pptx
Gajendra Shekhawat
 
PPTX
Diabetic keto acidosis and some recommendations .pptx
KubamBranndone
 
PPTX
Leukemia / CHRONIC LEUKEMIA / CML / CLL.pptx
Ayesha Fatima
 
PDF
2030 Analysis: Dental Anesthesia Market Trends Reshaping Patient Comfort
Kumar Satyam
 
PDF
MEET OUR TEAM AT DOCTORS DENTAL SERVICES
bagalanazizi
 
PDF
NURS FPX 4015 Assessment 4_ Caring for Special Populations Teaching.pdf
experttutors1
 
PPTX
6) ASSR-KB.pptxgghjjttyjjjjvbnjgfffujjbjjm
kaurmuskanpreet2504
 
PPTX
pptejkfhdwjfbwdkfhbdsnfbsdmfbsdfsdbhmfsdfnmsdnf
AbdulRehman385433
 
Cells are the fundamental structural and functional units of life, and their ...
tarun35435605
 
Nitration is a key chemical reaction where a nitro group (-NO₂) is introduced...
PravinKhatale2
 
2.0 PRO RESPONSIBILITIES of COMMUNITY PHARMACISTS.pptx
Raveendra Hullolikar
 
Best Diet Plan For The Hairfall & Healthy Hair
Toxic Free India
 
Leukemia / Acute Leukemia/ AML/ ALL.pptx
Ayesha Fatima
 
ICCA Training - Non ICU Staff V1.pptx Slides
digitalcriticalcare
 
Seen and Celebrated! Bassem Matta Vanderbilt, 2
Smiling Lungs
 
Concept of theater privatization; prospect and challenges to patients and hea...
Nr. Halliru Kabir
 
basic nutrition and diet plan for caregiving
KingSonDismaya1
 
Craig Kent served as Chair of American Board of Surgery.pdf
Craig Kent
 
Visual Inspection with Ascetic Acid Cervicography(VIAC).pptx
IrvineMusara
 
NEONATAL SEPSIS AND MANAGEMENT......pptx
KalupsaDick
 
CAP-IDSA-2019 MANAGEMENT GUIDELINES.pptx
Gajendra Shekhawat
 
Diabetic keto acidosis and some recommendations .pptx
KubamBranndone
 
Leukemia / CHRONIC LEUKEMIA / CML / CLL.pptx
Ayesha Fatima
 
2030 Analysis: Dental Anesthesia Market Trends Reshaping Patient Comfort
Kumar Satyam
 
MEET OUR TEAM AT DOCTORS DENTAL SERVICES
bagalanazizi
 
NURS FPX 4015 Assessment 4_ Caring for Special Populations Teaching.pdf
experttutors1
 
6) ASSR-KB.pptxgghjjttyjjjjvbnjgfffujjbjjm
kaurmuskanpreet2504
 
pptejkfhdwjfbwdkfhbdsnfbsdmfbsdfsdbhmfsdfnmsdnf
AbdulRehman385433
 
Ad

Basic statistics

  • 2. What is Statistics? “Statistics is concerned with the inferential process, in particular with planning and analysis of experiments or surveys, with the nature of observational errors and sources of variability that obscure underlying patters, and with efficient summarizing of set of data” = Kruskal Why should we use statistics? Statistical methods are required to ensure that data are interpreted correctly and the apparent relationship are meaningful and not simply chance occurrence. Statistics in Different Field 1. Business 2. Economics 3. Banking 4. Accounts and Auditing etc., Every day example… 1. Weather forecast 2. Emergency preparedness 3. Predicting diseases 4. Medical study 5. Political campaigns etc.,
  • 3. Types of Data Qualitative Quantitative Discrete Continuous
  • 4. • Qualitative Data Qualitative data can be arranged into categories that are non numerical. These categories can be physical traits, gender, colors or anything that does not have a number associated to it. Qualitative data is sometimes referred to as categorical data •Examples: •Hair color (black, brown, blonde, white, grey, mahogany) •Make of car (Dodge, Honda, Ford, Toyota) •Gender (male, female) •Place of birth (Riyadh, Jeddah, Yanbu)
  • 5. • Quantitative Data Quantitative data are measures of values or counts and are expressed in numeric variables. Examples: For each orange tree, the number of oranges is measured For a particular day, the number of cars entering a college campus is measured Time until a light bulb burns out Etc.,
  • 6. Four Basic Scale of Measurement
  • 7. Nominal Scale: This scale is the crudest among all measurement scales but is also the simplest scale. In this scale the different scores on a measurement simply indicate different categories. The nominal scale is often referred to as a categorical scale. The assigned numbers have no arithmetic properties and act only as labels. The only statistical operation that can be performed on nominal scales is a frequency count. We cannot determine an average except mode. Examples: Gender (1= male, 0=female) ZIP code (7000=Philippines, …) Plate numbers of vehicles (JK3429, MC001, …) Course (Biology, Mathematics, History, …) Race (Asian, American, …) Eye color (Brown, Blue, …)
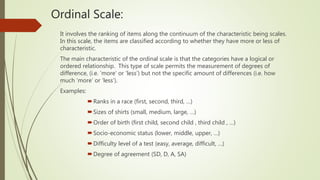
  • 8. Ordinal Scale: It involves the ranking of items along the continuum of the characteristic being scales. In this scale, the items are classified according to whether they have more or less of characteristic. The main characteristic of the ordinal scale is that the categories have a logical or ordered relationship. This type of scale permits the measurement of degrees of difference, (i.e. 'more’ or ‘less’) but not the specific amount of differences (i.e. how much ‘more’ or ‘less’). Examples: Ranks in a race (first, second, third, …) Sizes of shirts (small, medium, large, …) Order of birth (first child, second child , third child , …) Socio-economic status (lower, middle, upper, …) Difficulty level of a test (easy, average, difficult, …) Degree of agreement (SD, D, A, SA)
  • 9. Interval scale Interval scale is a scale in which the numbers are used to rank attributes such that numerically equal distance on the scale represent equal distance in the characteristic being measured. An interval scale contains all the information of an ordinal scale, but it also one allows to compare the difference/distance between attributes. Interval scales may be either in numeric or semantic formats. Examples: Temperature (in oF or oC) IQ Scores
  • 10. Ratio scale The highest scale, it allows the researcher to identify or classify objects, and compare intervals or differences. It is also meaningful to compute ratios of scale values. Is a possesses all the properties of the nomincal, ordinal and interval scale and in addition an absolute zero point. It is also meaningful to compute ratios of scale values. In the marketing , sales, costs, market share and number of customers are available measure on ratio scale. Examples: I. Height (165cm, 154cm, 144cm, …) II. Reaction time (20sec, 43sec, 37sec, …) III. Number of siblings (2, 5, 8, …) IV. Hours spent on studying for an exam (0, 2, 3, …)
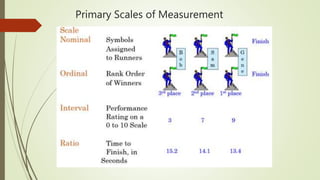
  • 11. Primary Scales of Measurement
  • 12. Discrete and Continuous Data  Numerical data could be either discrete or continuous.  Continuous data can take any numerical value (within a range); For example, weight, height, etc.,  There can be an infinite number of possible values in continuous data.  Discrete data can take only certain values by a finite ;jumps;, i., it ‘jumps’ from one value to another but does not take any intermediate value between them (For example, umber of students in the class)
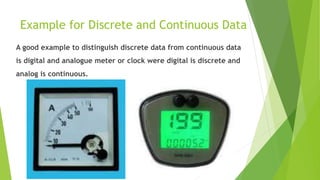
  • 13. Example for Discrete and Continuous Data A good example to distinguish discrete data from continuous data is digital and analogue meter or clock were digital is discrete and analog is continuous.
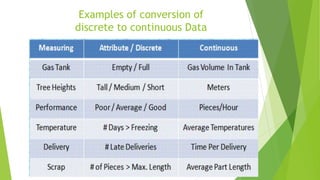
  • 14. Examples of conversion of discrete to continuous Data
  • 15. Area of Statistics Descriptive statistical limits generalization to the particular group of individuals observed. That is: 1. No conclusions are extended beyond this group 2. Any similarity to those outside the group cannot be assumed. 3. The data describe one group and that group only. Example: Assessment findings, findings a much simpler action research. Inferential analysis selects a small group out of larger group an the findings are applied to the larger group. It is used to estimate a parameter, the corresponding value in the population from the which the sample is selected. It is necessary to carefully select the sample or the inferences may not apply to the population.
  • 17. Measures of Central Tendency and Dispersion
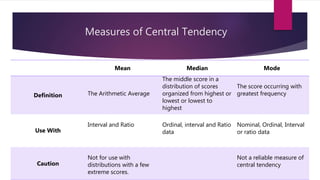
  • 18. Measures of Central Tendency Mean Median Mode Definition The Arithmetic Average The middle score in a distribution of scores organized from highest or lowest or lowest to highest The score occurring with greatest frequency Use With Interval and Ratio Ordinal, interval and Ratio data Nominal, Ordinal, Interval or ratio data Caution Not for use with distributions with a few extreme scores. Not a reliable measure of central tendency
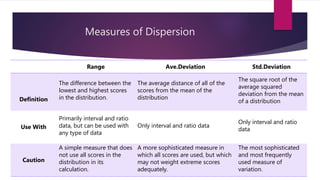
  • 19. Measures of Dispersion Range Ave.Deviation Std.Deviation Definition The difference between the lowest and highest scores in the distribution. The average distance of all of the scores from the mean of the distribution The square root of the average squared deviation from the mean of a distribution Use With Primarily interval and ratio data, but can be used with any type of data Only interval and ratio data Only interval and ratio data Caution A simple measure that does not use all scores in the distribution in its calculation. A more sophisticated measure in which all scores are used, but which may not weight extreme scores adequately. The most sophisticated and most frequently used measure of variation.
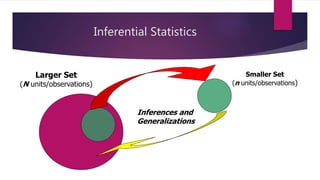
  • 20. Inferential Statistics Inferences and Generalizations Smaller Set (n units/observations) Larger Set (N units/observations)