SlideShare a Scribd company logo
BASIC TERMS
IN
STATISTICS
OVERVIEW OF THE LESSON
As continuation of Lesson 2 (where we
contextualize data) in this lesson we
define basic terms in statistics as we
continue to explore data. These basic
terms include the universe, variable,
population and sample. In detail we will
discuss other concepts in relation to a
variable.
LEARNING OUTCOMES
•Define universe and differentiate it
with population; and
•Define and differentiate between
qualitative and quantitative variables,
and between discrete and continuous
variables (that are quantitative);
[CONSOLIDATED
DATA]
RECALL
1. Who provided the data?
•The students in this class provided
the data.
WHAT? WHAT ARE THE INFORMATION
FROM THE RESPONDENTS?
• The information gathered include Class
Student Number, Sex, Number of
Siblings, Weight, Height, Age of Mother,
Usual Daily Allowance in School, Usual
Daily Food Expenditure in School,
Usual Number of Text Messages Sent in
a Day, Most Preferred Color, Usual
Sleeping Time and Happiness Index for
the Day.
WHAT? WHAT IS THE UNIT OF
MEASUREMENT USED FOR EACH OF THE
INFORMATION (IF THERE ARE ANY)?
• The units of measurement for the
information on Number of Siblings,
Weight, Height, Age of Mother, Usual
Daily Allowance in School, Usual Daily
Food Expenditure in School, and Usual
Number of Text Messages Sent in a Day
are person, kilogram, centimeter, year,
pesos, pesos and message,
respectively
DEFINITION OF BASIC TERMS
UNIVERSE
• the collection or set of units or entities from
whom we got the data
• a universe is not necessarily composed of
people. Since there are studies where the
observations were taken from plants or
animals or even from non-living things like
buildings, vehicles, farms, etc.
• This set of units answers the first W’s of
data contextualization.
VARIABLE
• a characteristic that is observable or
measurable in every unit of the
universe
• the information that you were asked are
referred to as the variables of the study
and in the data collection activity, we have
12 variables including Class Student
Number
EXAMPLES OF VARIABLE FROM
THE ACTIVITY
• age, number of siblings, weight, height, age
of mother, usual daily allowance in school,
usual daily food expenditure in school,
usual number of text messages sent in a
day, most preferred color, usual sleeping
time and happiness index for the day.
• these characteristics are observable in each
and every student of the class, then these
are referred to as variables.
POPULATION
• The set of all possible values of a
variable is referred to as a population.
• Thus for each variable we observed, we
have a population of values. The number of
population in a study will be equal to the
number of variables observed.
• In the data collection activity we had, there
are 12 populations corresponding to 12
variables.
SAMPLE
• A subgroup of a universe or of a
population is a sample.
• There are several ways to take a sample
from a universe or a population and the
way we draw the sample dictates the kind
of analysis we do with our data.
Basic Terms in Statistics
BROAD CLASSIFICATION OF
VARIABLES
• A variable takes on several values. But
occasionally, a variable can only assume
one value, then it is called a constant. For
instance, in a class of fifteen-year olds, the
age in years of students is constant.
• Variables can be broadly classified as either
qualitative or quantitative, with the latter
further classified into discrete and
continuous types
Basic Terms in Statistics
QUALITATIVE
• variables express a categorical attribute,
such as sex (male or female), religion,
marital status, region of residence, highest
educational attainment.
• Qualitative variables do not strictly take on
numeric values (although we can have
numeric codes for them, e.g., for sex
variable, 1 and 2 may refer to male, and
female, respectively).
QUALITATIVE
• Qualitative data answer questions “what
kind.” Sometimes, there is a sense of
ordering in qualitative data, e.g., income data
grouped into high, middle and low-income
status. Data on sex or religion do not have
the sense of ordering, as there is no such
thing as a weaker or stronger sex, and a
better or worse religion.
• Qualitative variables are sometimes referred
to as categorical variables.
QUANTITATIVE
• (otherwise called numerical) data, whose
sizes are meaningful, answer questions
such as “how much” or “how many”.
Quantitative variables have actual units of
measure. Examples of quantitative
variables include the height, weight,
number of registered cars, household size,
and total household expenditures/income
of survey respondents.
CLASSIFICATIONS OF
QUANTITATIVE DATA
DISCRETE
• data are those data that can be counted,
e.g., the number of days for cellphones to
fail, the ages of survey respondents
measured to the nearest year, and the
number of patients in a hospital. These
data assume only (a finite or infinitely)
countable number of values.
CONTINUOUS
•data are those that can be
measured, e.g. the exact height of
a survey respondent and the
exact volume of some liquid
substance. The possible values
are uncountably infinite.
Basic Terms in Statistics
VARIABLE TYPE OF
VARIABLE
TYPE OF QUANTITATIVE
VARIABLE
CLASS STUDENT NUMBER
SEX
NUMBER OF SIBLINGS
WEIGHT
HEIGHT
AGE OF MOTHER
USUAL DAILY ALLOWANCE
USUAL DALY FOOD
EXPENDITURE
USUAL NUMBER OF TEXT
MESSAGES SENT
USUAL SLEEPING TIME
MOST PREFERRED COLOR
HAPPINESS INDEX
QUALITATIVE
QUALITATIVE
QUANTITATIVE
QUANTITATIVE
QUANTITATIVE
QUANTITATIVE
QUANTITATIVE
QUANTITATIVE
QUANTITATIVE
QUALITATIVE
QUALITATIVE
QUALITATIVE
DISCRETE
CONTINUOUS
CONTINUOUS
DISCRETE
DISCRETE
DISCRETE
DISCRETE
SPECIAL NOTE
For quantitative data, arithmetical operations have
some physical interpretation. One can add 301 and
302 if these have quantitative meanings, but if, these
numbers refer to room numbers, then adding these
numbers does not make any sense. Even though a
variable may take numerical values, it does not make
the corresponding variable quantitative! The issue is
whether performing arithmetical operations on these
data would make any sense. It would certainly not
make sense to sum two zip codes or multiply two
room numbers
KEY POINTS
• A universe is a collection of units from which the data were
gathered.
• A variable is a characteristic we observed or measured from
every element of the
universe.
• A population is a set of all possible values of a variable.
• A sample is a subgroup of a universe or a population.
• In a study there is only one universe but could have several
populations.
• Variables could be classified as qualitative or quantitative,
and the latter could be further
classified as discrete or continuous.
ASSESSMENT
1/4
A market researcher company requested all teachers of a
particular school to fill up a questionnaire in relation to
their product market study. The following are some of the
information supplied by the teachers:
• highest educational attainment
• predominant hair color
• body temperature
• civil status
• brand of laundry soap being used
• total household expenditures last month in pesos
• number of children in the household
• number of hours standing in queue while waiting to be served
by a bank teller
• amount spent on rice last week by the household
• distance travelled by the teacher in going to school
• time (in hours) consumed on Facebook on a particular day
a. If we are to consider the collection of information gathered
through the completed questionnaire, what is the universe
for this data set?
b. Which of the variables are qualitative? Which are
quantitative? Among the quantitative variables, classify
them further as discrete or continuous.
• highest educational attainment
• predominant hair color
• body temperature
• civil status
• brand of laundry soap being used
• total household expenditures last month in pesos
• number of children in a household
• number of hours standing in queue while waiting to be served
by a bank teller
• amount spent on rice last week by a household
• distance travelled by the teacher in going to school
• time (in hours) consumed on Facebook on a particular day
ANSWERS
A. IF WE ARE TO CONSIDER THE COLLECTION OF
INFORMATION GATHERED THROUGH THE COMPLETED
QUESTIONNAIRE, WHAT IS THE UNIVERSE FOR THIS DATA
SET?
(The universe is the set of all
teachers in that school)
WHICH OF THE VARIABLES ARE QUALITATIVE? WHICH ARE
QUANTITATIVE? AMONG THE QUANTITATIVE VARIABLES,
CLASSIFY THEM FURTHER AS DISCRETE OR CONTINUOUS.
• highest educational attainment (qualitative)
• predominant hair color (qualitative)
• body temperature (quantitative: continuous)
• civil status (qualitative)
• brand of laundry soap being used (qualitative)
• total household expenditures last month in pesos (quantitative: discrete)
• number of children in a household (quantitative: discrete)
• number of hours standing in queue while waiting to be served by a bank teller
(quantitative: discrete)
• amount spent on rice last week by a household (quantitative: discrete)
• distance travelled by the teacher in going to school (quantitative:
continuous)
• time (in hours) consumed on Facebook on a particular day(quantitative:
continuous
ASSIGNMENT
The Engineering Department of a big city did a listing
of all buildings in their locality. If you are planning to
gather the characteristics of these buildings,
a. what is the universe of this data collection activity?
b. what are the crucial variables to observe? It would
also be better if you could classify the variables as
to whether it is qualitative or quantitative.
Furthermore, classify the quantitative variable as
discrete or continuous.
ANSWERS
The Engineering Department of a big city did a listing of all
buildings in their locality. If you are planning to gather the
characteristics of these buildings,
a. what is the universe of this data collection activity?
(Set of all buildings in the big city)
b. what are the crucial variables to observe? It would also be
better if you could classify the variables as to whether it is
qualitative or quantitative. Furthermore, classify the
quantitative variable as discrete or continuous.
(A possible answer is the number of floors in the building,
quantitative, discrete)

More Related Content

What's hot (20)

PPTX
Pagbasa
Iris Joy Yabyabin
 
PPTX
Statistics and probability lesson 1
MARIA CHRISTITA POLINAG
 
PPTX
Kabanata 4 (presentasyon at interpretasyon) pinal
Nancy jane Fadol
 
PPTX
Statistics and probability lesson2&3
MARIA CHRISTITA POLINAG
 
PPTX
Pagsulat ng liham (report)
Vraille Ayesha Maguire
 
PPTX
Lesson 26 presenting and interpreting data in tabular and graphical froms
mjlobetos
 
PPTX
Other Measures of Location
Samuel John Parreño
 
PDF
Lakbay sanaysay lesson
Myrna Guinto
 
PPTX
Introducing Statistics
Samuel John Parreño
 
PPTX
Komunikasyon
Ann Kelly Cutero
 
DOCX
Statistical treatment of data
senseiDelfin
 
PPTX
Mathematics in the modern world
donna ruth talo
 
PPTX
Panitikan sa panahon ng kalayaan
charlhen1017
 
PPTX
Kabanata iii(pananaliksik)
isabel guape
 
PPTX
Ang pagbasa
Paul Mitchell Chua
 
PPTX
Barayti ng Wika: Dayalek, Idyolek, Sosyolek
Ida Regine
 
PPTX
Layunin sa pagsulat -Filipino
Avigail Gabaleo Maximo
 
PPTX
Kabanata 1 sa pananaliksik (suliranin at kaligiran)
NicoleGala
 
PDF
Halimbawa ng Panukalang Proyekto.pdf
Niña Paulette Agsaullo
 
PPTX
Development Stage in Middle and late Adolescence
Edmundo Dantes
 
Statistics and probability lesson 1
MARIA CHRISTITA POLINAG
 
Kabanata 4 (presentasyon at interpretasyon) pinal
Nancy jane Fadol
 
Statistics and probability lesson2&3
MARIA CHRISTITA POLINAG
 
Pagsulat ng liham (report)
Vraille Ayesha Maguire
 
Lesson 26 presenting and interpreting data in tabular and graphical froms
mjlobetos
 
Other Measures of Location
Samuel John Parreño
 
Lakbay sanaysay lesson
Myrna Guinto
 
Introducing Statistics
Samuel John Parreño
 
Komunikasyon
Ann Kelly Cutero
 
Statistical treatment of data
senseiDelfin
 
Mathematics in the modern world
donna ruth talo
 
Panitikan sa panahon ng kalayaan
charlhen1017
 
Kabanata iii(pananaliksik)
isabel guape
 
Ang pagbasa
Paul Mitchell Chua
 
Barayti ng Wika: Dayalek, Idyolek, Sosyolek
Ida Regine
 
Layunin sa pagsulat -Filipino
Avigail Gabaleo Maximo
 
Kabanata 1 sa pananaliksik (suliranin at kaligiran)
NicoleGala
 
Halimbawa ng Panukalang Proyekto.pdf
Niña Paulette Agsaullo
 
Development Stage in Middle and late Adolescence
Edmundo Dantes
 

Similar to Basic Terms in Statistics (20)

PPTX
DATA COLLECTION-STATISTICS AND PROBABILITY-PPT
ChelsTero
 
PPTX
Basic terms in Statistics Statistics and Probability-1.pptx
elcalisbe1
 
PPTX
Lesson 3 basic terms in statistics
Maris Ganace
 
PDF
Basic Terms in Business Statistic jsjajjaja jajjajajwjhw hwhwjajjw.pdf
dextergozo087
 
PPTX
INTRODUCTION TO STATISTICS.pptx Grade-7 Slides
BiscochoY
 
PPTX
1-Introduction to Statistics ppt xv.pptx
NoreenRafique3
 
PDF
03 Basic Terms in Statistics.pdf
binoy ly
 
PPT
Statistics
Sayed Burhan Atal
 
PPTX
Biostatistic 2.pptx
imrantestmails
 
PPTX
STATISTICS ppt. G11.pptx
jarred16
 
PPTX
Introduction to Statistics.pptx
JacobGil3
 
DOCX
English
sehrish shahid
 
DOCX
intro to statistics
sehrish shahid
 
PDF
Nature of Statistics Nature of Statistics Nature of Statistics
ShannaClarito
 
PDF
Data, Distribution Introduction and Types - Biostatistics - Ravinandan A P.pdf
Ravinandan A P
 
PPTX
Introduction to basics of bio statistics.
AB Rajar
 
PPTX
Probability Chapter 1 (Introduction to Statistics)
prhaseeb
 
PPTX
Introduction to Statistics
Ruby Ocenar
 
DOCX
Statistik Chapter 1
WanBK Leo
 
PPTX
MATH 7 NATURE OF DATA under the Simple Statistical Instruments.pptx
rosaliearcala
 
DATA COLLECTION-STATISTICS AND PROBABILITY-PPT
ChelsTero
 
Basic terms in Statistics Statistics and Probability-1.pptx
elcalisbe1
 
Lesson 3 basic terms in statistics
Maris Ganace
 
Basic Terms in Business Statistic jsjajjaja jajjajajwjhw hwhwjajjw.pdf
dextergozo087
 
INTRODUCTION TO STATISTICS.pptx Grade-7 Slides
BiscochoY
 
1-Introduction to Statistics ppt xv.pptx
NoreenRafique3
 
03 Basic Terms in Statistics.pdf
binoy ly
 
Statistics
Sayed Burhan Atal
 
Biostatistic 2.pptx
imrantestmails
 
STATISTICS ppt. G11.pptx
jarred16
 
Introduction to Statistics.pptx
JacobGil3
 
intro to statistics
sehrish shahid
 
Nature of Statistics Nature of Statistics Nature of Statistics
ShannaClarito
 
Data, Distribution Introduction and Types - Biostatistics - Ravinandan A P.pdf
Ravinandan A P
 
Introduction to basics of bio statistics.
AB Rajar
 
Probability Chapter 1 (Introduction to Statistics)
prhaseeb
 
Introduction to Statistics
Ruby Ocenar
 
Statistik Chapter 1
WanBK Leo
 
MATH 7 NATURE OF DATA under the Simple Statistical Instruments.pptx
rosaliearcala
 
Ad

More from Samuel John Parreño (7)

PPTX
Measures of Variation
Samuel John Parreño
 
PPTX
More on Describing Data: Summary Measures and Graphs
Samuel John Parreño
 
PPTX
Measures of Central Tendency
Samuel John Parreño
 
PPTX
Data Presenetation
Samuel John Parreño
 
PPTX
Levels of Measurement
Samuel John Parreño
 
PPTX
Data Collection Activity
Samuel John Parreño
 
PDF
Sets of Axioms and Finite Geometries
Samuel John Parreño
 
Measures of Variation
Samuel John Parreño
 
More on Describing Data: Summary Measures and Graphs
Samuel John Parreño
 
Measures of Central Tendency
Samuel John Parreño
 
Data Presenetation
Samuel John Parreño
 
Levels of Measurement
Samuel John Parreño
 
Data Collection Activity
Samuel John Parreño
 
Sets of Axioms and Finite Geometries
Samuel John Parreño
 
Ad

Recently uploaded (20)

PPTX
Optimizing Cancer Screening With MCED Technologies: From Science to Practical...
i3 Health
 
PPTX
Modern analytical techniques used to characterize organic compounds. Birbhum ...
AyanHossain
 
PPTX
Optimizing Cancer Screening With MCED Technologies: From Science to Practical...
i3 Health
 
PPTX
Mrs Mhondiwa Introduction to Algebra class
sabinaschimanga
 
PPTX
Folding Off Hours in Gantt View in Odoo 18.2
Celine George
 
PPTX
Optimizing Cancer Screening With MCED Technologies: From Science to Practical...
i3 Health
 
PPTX
PPT on the Development of Education in the Victorian England
Beena E S
 
PDF
Federal dollars withheld by district, charter, grant recipient
Mebane Rash
 
PPTX
How to Configure Prepayments in Odoo 18 Sales
Celine George
 
PPTX
Nutrition Month 2025 TARP.pptx presentation
FairyLouHernandezMej
 
PPTX
ANORECTAL MALFORMATIONS: NURSING MANAGEMENT.pptx
PRADEEP ABOTHU
 
PPTX
How to Define Translation to Custom Module And Add a new language in Odoo 18
Celine George
 
PDF
IMP NAAC-Reforms-Stakeholder-Consultation-Presentation-on-Draft-Metrics-Unive...
BHARTIWADEKAR
 
PPTX
CLEFT LIP AND PALATE: NURSING MANAGEMENT.pptx
PRADEEP ABOTHU
 
PDF
FULL DOCUMENT: Read the full Deloitte and Touche audit report on the National...
Kweku Zurek
 
PPTX
Latest Features in Odoo 18 - Odoo slides
Celine George
 
PPTX
Gall bladder, Small intestine and Large intestine.pptx
rekhapositivity
 
PPTX
nutriquiz grade 4.pptx...............................................
ferdinandsanbuenaven
 
PPTX
Nutri-QUIZ-Bee-Elementary.pptx...................
ferdinandsanbuenaven
 
PPTX
PYLORIC STENOSIS: NURSING MANAGEMENT.pptx
PRADEEP ABOTHU
 
Optimizing Cancer Screening With MCED Technologies: From Science to Practical...
i3 Health
 
Modern analytical techniques used to characterize organic compounds. Birbhum ...
AyanHossain
 
Optimizing Cancer Screening With MCED Technologies: From Science to Practical...
i3 Health
 
Mrs Mhondiwa Introduction to Algebra class
sabinaschimanga
 
Folding Off Hours in Gantt View in Odoo 18.2
Celine George
 
Optimizing Cancer Screening With MCED Technologies: From Science to Practical...
i3 Health
 
PPT on the Development of Education in the Victorian England
Beena E S
 
Federal dollars withheld by district, charter, grant recipient
Mebane Rash
 
How to Configure Prepayments in Odoo 18 Sales
Celine George
 
Nutrition Month 2025 TARP.pptx presentation
FairyLouHernandezMej
 
ANORECTAL MALFORMATIONS: NURSING MANAGEMENT.pptx
PRADEEP ABOTHU
 
How to Define Translation to Custom Module And Add a new language in Odoo 18
Celine George
 
IMP NAAC-Reforms-Stakeholder-Consultation-Presentation-on-Draft-Metrics-Unive...
BHARTIWADEKAR
 
CLEFT LIP AND PALATE: NURSING MANAGEMENT.pptx
PRADEEP ABOTHU
 
FULL DOCUMENT: Read the full Deloitte and Touche audit report on the National...
Kweku Zurek
 
Latest Features in Odoo 18 - Odoo slides
Celine George
 
Gall bladder, Small intestine and Large intestine.pptx
rekhapositivity
 
nutriquiz grade 4.pptx...............................................
ferdinandsanbuenaven
 
Nutri-QUIZ-Bee-Elementary.pptx...................
ferdinandsanbuenaven
 
PYLORIC STENOSIS: NURSING MANAGEMENT.pptx
PRADEEP ABOTHU
 

Basic Terms in Statistics

  • 2. OVERVIEW OF THE LESSON As continuation of Lesson 2 (where we contextualize data) in this lesson we define basic terms in statistics as we continue to explore data. These basic terms include the universe, variable, population and sample. In detail we will discuss other concepts in relation to a variable.
  • 3. LEARNING OUTCOMES •Define universe and differentiate it with population; and •Define and differentiate between qualitative and quantitative variables, and between discrete and continuous variables (that are quantitative);
  • 5. RECALL 1. Who provided the data? •The students in this class provided the data.
  • 6. WHAT? WHAT ARE THE INFORMATION FROM THE RESPONDENTS? • The information gathered include Class Student Number, Sex, Number of Siblings, Weight, Height, Age of Mother, Usual Daily Allowance in School, Usual Daily Food Expenditure in School, Usual Number of Text Messages Sent in a Day, Most Preferred Color, Usual Sleeping Time and Happiness Index for the Day.
  • 7. WHAT? WHAT IS THE UNIT OF MEASUREMENT USED FOR EACH OF THE INFORMATION (IF THERE ARE ANY)? • The units of measurement for the information on Number of Siblings, Weight, Height, Age of Mother, Usual Daily Allowance in School, Usual Daily Food Expenditure in School, and Usual Number of Text Messages Sent in a Day are person, kilogram, centimeter, year, pesos, pesos and message, respectively
  • 9. UNIVERSE • the collection or set of units or entities from whom we got the data • a universe is not necessarily composed of people. Since there are studies where the observations were taken from plants or animals or even from non-living things like buildings, vehicles, farms, etc. • This set of units answers the first W’s of data contextualization.
  • 10. VARIABLE • a characteristic that is observable or measurable in every unit of the universe • the information that you were asked are referred to as the variables of the study and in the data collection activity, we have 12 variables including Class Student Number
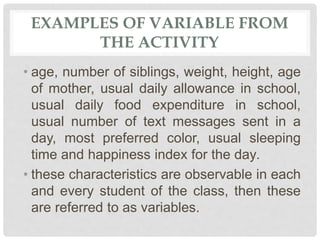
  • 11. EXAMPLES OF VARIABLE FROM THE ACTIVITY • age, number of siblings, weight, height, age of mother, usual daily allowance in school, usual daily food expenditure in school, usual number of text messages sent in a day, most preferred color, usual sleeping time and happiness index for the day. • these characteristics are observable in each and every student of the class, then these are referred to as variables.
  • 12. POPULATION • The set of all possible values of a variable is referred to as a population. • Thus for each variable we observed, we have a population of values. The number of population in a study will be equal to the number of variables observed. • In the data collection activity we had, there are 12 populations corresponding to 12 variables.
  • 13. SAMPLE • A subgroup of a universe or of a population is a sample. • There are several ways to take a sample from a universe or a population and the way we draw the sample dictates the kind of analysis we do with our data.
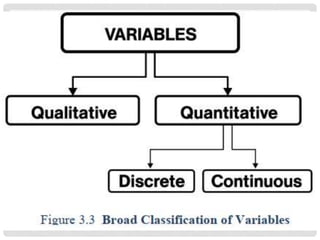
  • 16. • A variable takes on several values. But occasionally, a variable can only assume one value, then it is called a constant. For instance, in a class of fifteen-year olds, the age in years of students is constant. • Variables can be broadly classified as either qualitative or quantitative, with the latter further classified into discrete and continuous types
  • 18. QUALITATIVE • variables express a categorical attribute, such as sex (male or female), religion, marital status, region of residence, highest educational attainment. • Qualitative variables do not strictly take on numeric values (although we can have numeric codes for them, e.g., for sex variable, 1 and 2 may refer to male, and female, respectively).
  • 19. QUALITATIVE • Qualitative data answer questions “what kind.” Sometimes, there is a sense of ordering in qualitative data, e.g., income data grouped into high, middle and low-income status. Data on sex or religion do not have the sense of ordering, as there is no such thing as a weaker or stronger sex, and a better or worse religion. • Qualitative variables are sometimes referred to as categorical variables.
  • 20. QUANTITATIVE • (otherwise called numerical) data, whose sizes are meaningful, answer questions such as “how much” or “how many”. Quantitative variables have actual units of measure. Examples of quantitative variables include the height, weight, number of registered cars, household size, and total household expenditures/income of survey respondents.
  • 22. DISCRETE • data are those data that can be counted, e.g., the number of days for cellphones to fail, the ages of survey respondents measured to the nearest year, and the number of patients in a hospital. These data assume only (a finite or infinitely) countable number of values.
  • 23. CONTINUOUS •data are those that can be measured, e.g. the exact height of a survey respondent and the exact volume of some liquid substance. The possible values are uncountably infinite.
  • 25. VARIABLE TYPE OF VARIABLE TYPE OF QUANTITATIVE VARIABLE CLASS STUDENT NUMBER SEX NUMBER OF SIBLINGS WEIGHT HEIGHT AGE OF MOTHER USUAL DAILY ALLOWANCE USUAL DALY FOOD EXPENDITURE USUAL NUMBER OF TEXT MESSAGES SENT USUAL SLEEPING TIME MOST PREFERRED COLOR HAPPINESS INDEX QUALITATIVE QUALITATIVE QUANTITATIVE QUANTITATIVE QUANTITATIVE QUANTITATIVE QUANTITATIVE QUANTITATIVE QUANTITATIVE QUALITATIVE QUALITATIVE QUALITATIVE DISCRETE CONTINUOUS CONTINUOUS DISCRETE DISCRETE DISCRETE DISCRETE
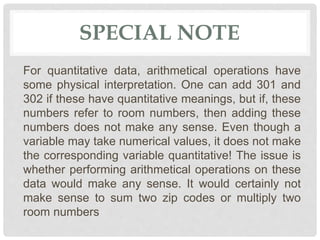
  • 26. SPECIAL NOTE For quantitative data, arithmetical operations have some physical interpretation. One can add 301 and 302 if these have quantitative meanings, but if, these numbers refer to room numbers, then adding these numbers does not make any sense. Even though a variable may take numerical values, it does not make the corresponding variable quantitative! The issue is whether performing arithmetical operations on these data would make any sense. It would certainly not make sense to sum two zip codes or multiply two room numbers
  • 27. KEY POINTS • A universe is a collection of units from which the data were gathered. • A variable is a characteristic we observed or measured from every element of the universe. • A population is a set of all possible values of a variable. • A sample is a subgroup of a universe or a population. • In a study there is only one universe but could have several populations. • Variables could be classified as qualitative or quantitative, and the latter could be further classified as discrete or continuous.
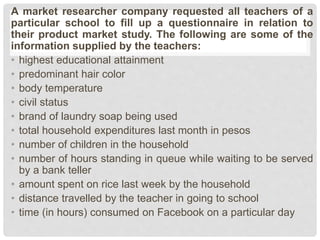
  • 29. A market researcher company requested all teachers of a particular school to fill up a questionnaire in relation to their product market study. The following are some of the information supplied by the teachers: • highest educational attainment • predominant hair color • body temperature • civil status • brand of laundry soap being used • total household expenditures last month in pesos • number of children in the household • number of hours standing in queue while waiting to be served by a bank teller • amount spent on rice last week by the household • distance travelled by the teacher in going to school • time (in hours) consumed on Facebook on a particular day
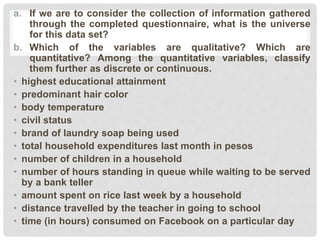
  • 30. a. If we are to consider the collection of information gathered through the completed questionnaire, what is the universe for this data set? b. Which of the variables are qualitative? Which are quantitative? Among the quantitative variables, classify them further as discrete or continuous. • highest educational attainment • predominant hair color • body temperature • civil status • brand of laundry soap being used • total household expenditures last month in pesos • number of children in a household • number of hours standing in queue while waiting to be served by a bank teller • amount spent on rice last week by a household • distance travelled by the teacher in going to school • time (in hours) consumed on Facebook on a particular day
  • 32. A. IF WE ARE TO CONSIDER THE COLLECTION OF INFORMATION GATHERED THROUGH THE COMPLETED QUESTIONNAIRE, WHAT IS THE UNIVERSE FOR THIS DATA SET? (The universe is the set of all teachers in that school)
  • 33. WHICH OF THE VARIABLES ARE QUALITATIVE? WHICH ARE QUANTITATIVE? AMONG THE QUANTITATIVE VARIABLES, CLASSIFY THEM FURTHER AS DISCRETE OR CONTINUOUS. • highest educational attainment (qualitative) • predominant hair color (qualitative) • body temperature (quantitative: continuous) • civil status (qualitative) • brand of laundry soap being used (qualitative) • total household expenditures last month in pesos (quantitative: discrete) • number of children in a household (quantitative: discrete) • number of hours standing in queue while waiting to be served by a bank teller (quantitative: discrete) • amount spent on rice last week by a household (quantitative: discrete) • distance travelled by the teacher in going to school (quantitative: continuous) • time (in hours) consumed on Facebook on a particular day(quantitative: continuous
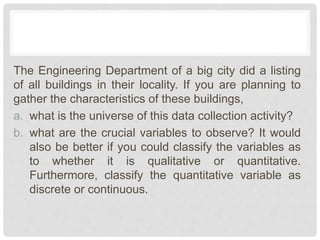
  • 35. The Engineering Department of a big city did a listing of all buildings in their locality. If you are planning to gather the characteristics of these buildings, a. what is the universe of this data collection activity? b. what are the crucial variables to observe? It would also be better if you could classify the variables as to whether it is qualitative or quantitative. Furthermore, classify the quantitative variable as discrete or continuous.
  • 37. The Engineering Department of a big city did a listing of all buildings in their locality. If you are planning to gather the characteristics of these buildings, a. what is the universe of this data collection activity? (Set of all buildings in the big city) b. what are the crucial variables to observe? It would also be better if you could classify the variables as to whether it is qualitative or quantitative. Furthermore, classify the quantitative variable as discrete or continuous. (A possible answer is the number of floors in the building, quantitative, discrete)