


Bio statistics 1
- 1. Biostatistics 1Biostatistics 1 Sivasankaran V Clinical Research Professional Bangalore
- 2. BiostatisticsBiostatistics The application of statistics to a wide range of topics in biology. some statistical methods are more heavily used in health applications than elsewhere e.g : survival analysis, longitudinal data analysis
- 3. BiostatisticsBiostatistics It is the science which deals with development and application of the most appropriate methods for the: Collection of data. Presentation of the collected data. Analysis and interpretation of the results. Making decisions on the basis of such analysis
- 4. Statistics The study and use of theory and methods for the analysis of data arising from random processes The study and use of theory and methods for the analysis of data arising from random processes Statistics provides some of the most fundamental tools and techniques of the scientific method • forming hypotheses • designing experiments and observational studies • gathering data • summarizing data • drawing inferences from data e g testing hypotheses
- 5. Other definitions for “Statistics” Frequently used in referral to recorded data Denotes characteristics calculated for a set of data : sample mean
- 6. Role of Biostatisticians To guide the design of an experiment or survey prior to data collection To analyze data using proper statistical procedures and techniques To present and interpret the results to researchers and other decision makers
- 7. Sources of data Records Surveys Experiments Comprehensive Sample
- 8. Types of dataTypes of data Constan t Variable s
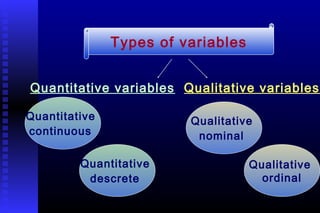
- 9. Quantitative continuous Types of variables Quantitative variables Qualitative variables Quantitative descrete Qualitative nominal Qualitative ordinal
- 10. Data Data are observations of random variables made on the elements of a population or sample. Data are the 1.Quantities -numbers or 2.Qualities -attributes are measured or observed that are to be collected and or analyzed
- 11. Numerical presentationNumerical presentation Graphical presentationGraphical presentation Mathematical presentationMathematical presentation Methods of presentation of data
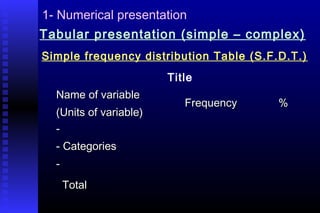
- 12. 1- Numerical presentation Tabular presentation (simple – complex) Simple frequency distribution Table (S.F.D.T.) Title Name of variableName of variable (Units of variable)(Units of variable) FrequencyFrequency %% -- - Categories- Categories -- TotalTotal
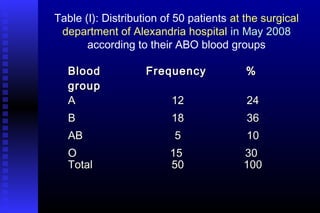
- 13. Table (I): Distribution of 50 patients at the surgical department of Alexandria hospital in May 2008 according to their ABO blood groups BloodBlood groupgroup FrequencyFrequency %% AA BB ABAB OO 1212 1818 55 1515 2424 3636 1010 3030 TotalTotal 5050 100100
- 14. Table (II): Distribution of 50 patients at the surgical department of Alexandria hospital in May 2008 according to their age AgeAge (years)(years) FrequencyFrequency %% 20-<3020-<30 30-30- 40-40- 50+50+ 1212 1818 55 1515 2424 3636 1010 3030 TotalTotal 5050 100100
- 15. Complex frequency distribution Table Table (III): Distribution of 20 lung cancer patients at the chest department of Alexandria hospital and 40 controls in May 2008 according to smoking Smoking Lung cancer Total Cases Control No. % No. % No. % Smoker 15 75% 8 20% 23 38.33 Non smoker 5 25% 32 80% 37 61.67 Total 20 100 40 100 60 100
- 16. Complex frequency distribution Table Table (IV): Distribution of 60 patients at the chest department of Alexandria hospital in May 2008 according to smoking & lung cancer Smoking Lung cancer Total positive negative No. % No. % No. % Smoker 15 65.2 8 34.8 23 100 Non smoker 5 13.5 32 86.5 37 100 Total 20 33.3 40 66.7 60 100
- 17. 2- Graphical presentation Graphs drawn using Cartesian coordinates • Line graph • Frequency polygon • Frequency curve • Histogram • Bar graph • Scatter plot Pie chart Statistical maps rules
- 18. Line Graph A line graph is preferred when emphasis isA line graph is preferred when emphasis is on the trend of the time series over theon the trend of the time series over the period rather than on the comparison ofperiod rather than on the comparison of relative size of the different figures in therelative size of the different figures in the series.series.
- 19. Line Graph 0 10 20 30 40 50 60 1960 1970 1980 1990 2000 Year MMR/1000 Year MMR 1960 50 1970 45 1980 26 1990 15 2000 12 Figure (1): Maternal mortality rate of (country), 1960-2000
- 20. Graphical representation HistogramHistogram Histogram is specialHistogram is special kind of bar diagramkind of bar diagram used to present aused to present a frequency distributionfrequency distribution of a characteristicof a characteristic measured on ameasured on a continuous scalecontinuous scale Frequency PolygonFrequency Polygon A frequency polygon is aA frequency polygon is a variation of histogram.variation of histogram. Instead rectangles areInstead rectangles are erected over the intervals,erected over the intervals, points are plotted at thepoints are plotted at the midpoints of the tops of themidpoints of the tops of the corresponding rectangles incorresponding rectangles in a histogram. Points area histogram. Points are joined by straight line.joined by straight line.
- 21. Frequency polygon Age (years) Sex Mid-point of intervalMales Female s 20 - 3 (12%) 2 (10%) (20+30) / 2 = 25 30 - 9 (36%) 6 (30%) (30+40) / 2 = 35 40- 7 (8%) 5 (25%) (40+50) / 2 = 45 50 - 4 (16%) 3 (15%) (50+60) / 2 = 55 60 - 70 2 (8%) 4 (20%) (60+70) / 2 = 65 Total 25(100%) 20(100%)
- 22. Frequency polygon Age Sex M-P M F 20- (12%) (10%) 25 30- (36%) (30%) 35 40- (8%) (25%) 45 50- (16%) (15%) 55 60-70 (8%) (20%) 65 0 5 10 15 20 25 30 35 40 25 35 45 55 65 Age % Males Females Figure (2): Distribution of 45 patients at (place) , in (time) by age and sex
- 23. 0 1 2 3 4 5 6 7 8 9 20- 30- 40- 50- 60-69 Age in years Frequency Female Male Frequency curve
- 24. HistogramHistogram 0 5 10 15 20 25 30 35 0 25 30 40 45 60 65 Age (years) % Figure (2): Distribution of 100 cholera patients at (place) , in (time) by age
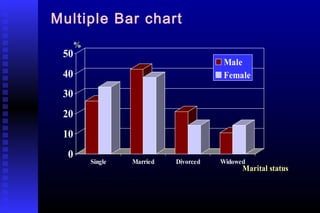
- 25. Presentation by space: Data are classified by location of occurance BAR CHARTBAR CHART Bar diagram isBar diagram is commonly used tocommonly used to provide visualprovide visual comparison of figurescomparison of figures in a time seriesin a time series MULTIPLE BAR CHART.MULTIPLE BAR CHART. This is another type of barThis is another type of bar diagram used fordiagram used for comparison purpose.comparison purpose.
- 26. Bar chart 0 5 10 15 20 25 30 35 40 45 % Single Married Divorced Widowed Marital status
- 27. Multiple Bar chart 0 10 20 30 40 50 % Single Married Divorced Widowed Marital status Male Female
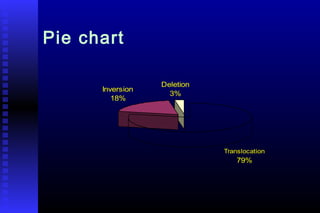
- 28. PIE CHART Pie chart is chosen when component parts of the figure to each category are to be shown. Pie chart is a circular diagram.
- 30. Doughnut chart Hospital A Hospital B DM IHD Renal
- 31. 3-Mathematical presentation Summery statistics Measures of locationMeasures of location 1- Measures of central tendency1- Measures of central tendency 2- Measures of non central locations2- Measures of non central locations (Quartiles, Percentiles )(Quartiles, Percentiles ) Measures of dispersionMeasures of dispersion
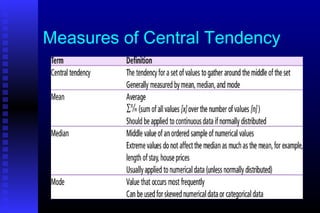
- 32. Measures of Central Tendency
- 33. Classification of Measures of central tendency
- 34. Central Tendency for Non frequency data
- 35. Central Tendency for grouped data
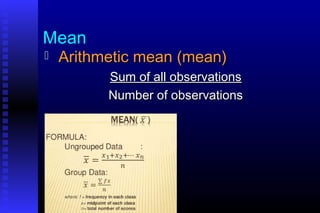
- 36. Mean Arithmetic mean (mean)Arithmetic mean (mean) Sum of all observationsSum of all observations Number of observationsNumber of observations
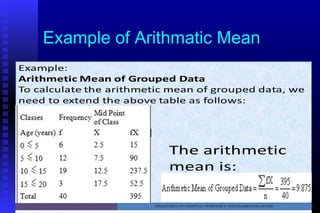
- 37. Example of Arithmatic Mean
- 38. 1- Measures of central tendency (cont.) MedianMedian the observation which lies in the middle ofthe observation which lies in the middle of the ordered observation.the ordered observation. Summery statistics
- 39. Median for odd number and even number
- 40. Calculate Median for ungrouped data
- 41. Mode
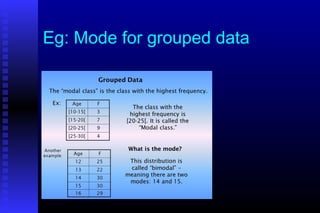
- 42. Eg: Mode for grouped data
- 43. Advantage and disadvantage of Central tendency
- 44. Measures of dispersion RangeRange VarianceVariance Standard deviationStandard deviation Semi-interquartile rangeSemi-interquartile range Coefficient of variationCoefficient of variation ““Standard error”Standard error”
- 45. Range The range of group of observations is theThe range of group of observations is the interval between the smallest and the biggestinterval between the smallest and the biggest observation.observation. Range = Xmax-Xmin= A-BRange = Xmax-Xmin= A-B
- 46. Variance An amount of difference or change in theAn amount of difference or change in the observations or in dataobservations or in data The square of the standard deviationThe square of the standard deviation Varience = S squareVarience = S square
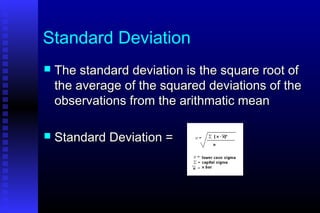
- 47. Standard Deviation The standard deviation is the square root ofThe standard deviation is the square root of the average of the squared deviations of thethe average of the squared deviations of the observations from the arithmatic meanobservations from the arithmatic mean Standard Deviation =Standard Deviation =
- 48. Standard deviation SD 7 7 7 7 7 7 7 8 7 7 7 6 3 2 7 8 13 9Mean = 7 SD=0 Mean = 7 SD=0.63 Mean = 7 SD=4.04
- 49. Standard error of mean SE A measure of variability among means of samples selected from certain population