Biostatistics i
Download as pptx, pdf3 likes286 views

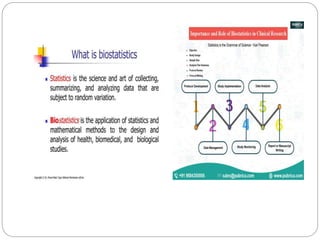
The document discusses concepts related to measurement, scaling, and data analysis in statistics. It defines measurement as assigning numbers or symbols to characteristics of interest according to set rules. There are different types of scales (nominal, ordinal, interval, ratio) that provide varying levels of information based on their scaling properties of description, order, distance, and origin. The document also discusses topics like descriptive statistics, types of data collection and processing, methods of data presentation, and measures of relationships between variables like correlation and regression.

![THE CONCEPT OF MEASUREMENT AND
SCALING (Meaning of scaling)
Measurement can be
defined as a standardized
process of assigning
numbers or other symbols
to certain characteristics
of the objects of interest
Measurement is “the
assignment of numbers
to observations [or
responses] according to
some set of rules”
Researchers engage in
using the
measurement process
by assigning
either numbers
or labels](https://izqule7twkl7vq3ljkxejyz-s-a2157.bj.tsgdht.cn/biostatisticsi-211220140314/85/Biostatistics-i-6-320.jpg)


More Related Content
What's hot (20)
Similar to Biostatistics i (20)


More from Thangamani Ramalingam (20)


Recently uploaded (20)


Biostatistics i
- 6. THE CONCEPT OF MEASUREMENT AND SCALING (Meaning of scaling) Measurement can be defined as a standardized process of assigning numbers or other symbols to certain characteristics of the objects of interest Measurement is “the assignment of numbers to observations [or responses] according to some set of rules” Researchers engage in using the measurement process by assigning either numbers or labels
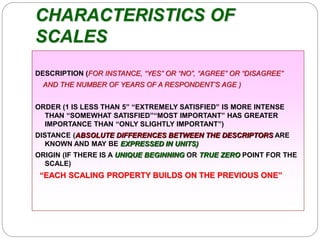
- 7. CHARACTERISTICS OF SCALES DESCRIPTION (FOR INSTANCE, “YES” OR “NO”, “AGREE” OR “DISAGREE” AND THE NUMBER OF YEARS OF A RESPONDENT’S AGE ) ORDER (1 IS LESS THAN 5” “EXTREMELY SATISFIED” IS MORE INTENSE THAN “SOMEWHAT SATISFIED”“MOST IMPORTANT” HAS GREATER IMPORTANCE THAN “ONLY SLIGHTLY IMPORTANT”) DISTANCE (ABSOLUTE DIFFERENCES BETWEEN THE DESCRIPTORS ARE KNOWN AND MAY BE EXPRESSED IN UNITS) ORIGIN (IF THERE IS A UNIQUE BEGINNING OR TRUE ZERO POINT FOR THE SCALE) “EACH SCALING PROPERTY BUILDS ON THE PREVIOUS ONE”
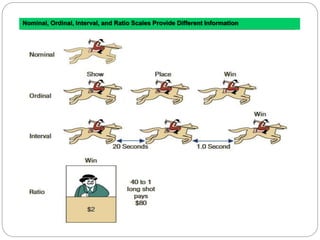
- 8. Nominal, Ordinal, Interval, and Ratio Scales Provide Different Information
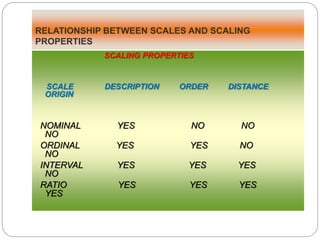
- 9. RELATIONSHIP BETWEEN SCALES AND SCALING PROPERTIES SCALING PROPERTIES SCALE DESCRIPTION ORDER DISTANCE ORIGIN NOMINAL YES NO NO NO ORDINAL YES YES NO NO INTERVAL YES YES YES NO RATIO YES YES YES YES
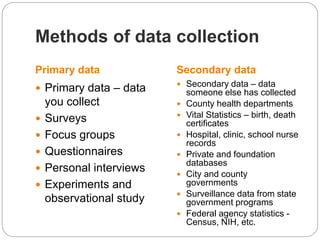
- 10. Primary data Secondary data Primary data – data you collect Surveys Focus groups Questionnaires Personal interviews Experiments and observational study Secondary data – data someone else has collected County health departments Vital Statistics – birth, death certificates Hospital, clinic, school nurse records Private and foundation databases City and county governments Surveillance data from state government programs Federal agency statistics - Census, NIH, etc. Methods of data collection
- 11. Data Processing operations Editing (fieldediting,central editing) Coding Classification(based on attributes or class interval) Tabulation (simple or complex)
- 13. Data Processing Cycle Collected data is transformed into a form that computer can understand. (input data). Verification (errors occur in collected data) Coding(Male-1,female-2) Storing
- 14. Data Processing Cycle Processing denotes the actual data manipulation techniques such as classifying, sorting, calculating, summarizing, comparing, etc. that convert data into information. Classification -The data is classified into different groups and subgroups, so that each group or sub-group of data can be handled separately. ii) Sorting -The data is arranged into an order so that it can be accessed very quickly as and when required. iii) Calculations -The arithmetic operations are performed on the numeric data to get the required results. iv) Summarizing -The data is processed to represent it in a summarized form.
- 15. Data Processing Cycle Output-After completing the processing step, output is generated. The main purpose of data processing is to get the required result. Mostly, the output is stored on the storage media for later user i) Retrieval Output stored on the storage media can be retrieved at any time. ii) Conversion The generated output can be converted into different forms. For example, it can be represented into graphical form. iii) Communication -The generated output is sent to different places.
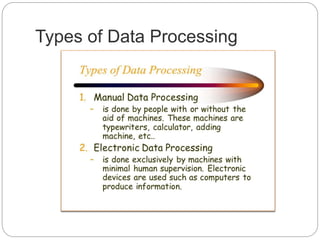
- 16. Types of Data Processing
- 17. Problems in processing Don’t know responses Missing forms internal consistency of the data e.g. age &date of birth Validity checks e.g. :extreme values
- 18. Types of analysis Descriptive Inferential Univariate Bivariate Multivariate(regressio n ,manova, canonical and discrimnant) Causal analysis Correlational analysis
- 28. Common descriptive statistics Count (frequencies) Percentage Mean Mode Median Range Standard deviation Variance Ranking
- 29. Basic Concepts Population: the whole set of a “universe” Sample: a sub-set of a population Parameter: an unknown “fixed” value of population characteristic Statistic: a known/calculable value of sample characteristic representing that of the population. E.g. μ = mean of population, = mean of sample
- 30. “Central Tendency” Measur e Advantages Disadvantages Mean (Sum of all values ÷ no. of values) Best known average Exactly calculable Make use of all data Useful for statistical analysis Affected by extreme values Can be absurd for discrete data (e.g. Family size = 4.5 person) Cannot be obtained graphically Median (middle value) Not influenced by extreme values Obtainable even if data distribution unknown (e.g. group/aggregate data) Unaffected by irregular class width Unaffected by open-ended class Needs interpolation for group/ aggregate data (cumulative frequency curve) May not be characteristic of group when: (1) items are only few; (2) distribution irregular Very limited statistical use Mode (most frequent value) Unaffected by extreme values Easy to obtain from histogram Determinable from only values near the modal class Cannot be determined exactly in group data Very limited statistical use
- 31. Central Tendency – “Mean”, For individual observations, . E.g. X = {3,5,7,7,8,8,8,9,9,10,10,12} = 96 ; n = 12 Thus, = 96/12 = 8 The above observations can be organised into a frequency table and mean calculated on the basis of frequencies = 96; = 12 Thus, = 96/12 = 8 x 3 5 7 8 9 1 0 1 2 f 1 1 2 3 2 2 1 f 3 5 1 4 2 4 1 8 2 0 1 2
- 32. Central Tendency–“Mean of Grouped Data” House rental or prices in the PMR are frequently tabulated as a range of values. E.g. What is the mean rental across the areas? ∑f = 23; ∑fx= 3317.5 Thus, ∑fx/ ∑f = 3317.5/23 = 144.24 Rental (RM/month) 135-140 140-145 145-150 150-155 155-160 Mid-point value (x) 137.5 142.5 147.5 152.5 157.5 Number of Taman (f) 5 9 6 2 1 fx 687.5 1282.5 885.0 305.0 157.5
- 35. Central Tendency – “Median” Let say house rentals in a particular town are tabulated as follows: Calculation of “median” rental needs a graphical aids→ Rental (RM/month) 130-135 135-140 140-145 155-50 150-155 Number of Taman (f) 3 5 9 6 2 Rental (RM/month) >135 > 140 > 145 > 150 > 155 Cumulative frequency 3 8 17 23 25 1. Median = (n+1)/2 = (25+1)/2 =13th. Taman 2. (i.e. between 10 – 15 points on the vertical axis of ogive). 3. Corresponds to RM 140- 145/month on the horizontal axis 4. There are (17-8) = 9 Taman in the range of RM 140-145/month 5. Taman 13th. is 5th. out of the 9 Taman 6. The interval width is 5 7. Therefore, the median rental can be calculated as: 140 + (5/9 x 5) = RM 142.8
- 36. Central Tendency – “Median” (contd.)
- 39. Central Tendency – “Quartiles” Upper quartile = ¾(n+1) = 19.5th. Taman UQ = 145 + (3/7 x 5) = RM 147.1/month Lower quartile = (n+1)/4 = 26/4 = 6.5 th. Taman LQ = 135 + (3.5/5 x 5) = RM138.5/month Inter-quartile = UQ – LQ = 147.1 – 138.5 = 8.6th. Taman IQ = 138.5 + (4/5 x 5) = RM 142.5/month
- 40. Partition values
- 41. IQR
- 44. “Variability” Indicates dispersion, spread, variation, deviation For single population or sample data: where σ2 and s2 = population and sample variance respectively, xi = individual observations, μ = population mean, = sample mean, and n = total number of individual observations. The square roots are: standard deviation standard deviation
- 45. “Variability” Why “measure of dispersion” important? Consider returns from two categories of shares: * Shares A (%) = {1.8, 1.9, 2.0, 2.1, 3.6} * Shares B (%) = {1.0, 1.5, 2.0, 3.0, 3.9} Mean A = mean B = 2.28% But, different variability! Var(A) = 0.557, Var(B) = 1.367 * Would you invest in category A shares or category B shares?
- 46. “Variability” Coefficient of variation – COV – std. deviation as % of the mean: Could be a better measure compared to std. dev. COV(A) = 32.73%, COV(B) = 51.28%
- 47. “Variability” Std. dev. of a frequency distribution The following table shows the age distribution of second-time home buyers: x^
- 48. Skewness is a measure of asymmetry and shows the manner in which the items are clustered around the average.
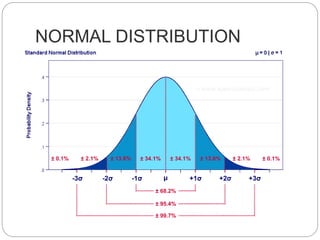
- 49. Kurtosis is the measure of flat- toppedness of a curve. A bell shaped curve or the normal curve is Mesokurtic because it is kurtic in the centre; but if the curve is relatively more peaked than the normal curve, it is called Leptokurtic whereas a curve is more flat than the normal curve, it is called Platykurtic
- 53. MEASURES OF RELATIONSHIP Correlation can be studied through (a) cross tabulation; (b) Charles Spearman’s coefficient of correlation (c) Karl Pearson’s coefficient of correlation; whereas cause and effect relationship can be studied through simple regression equations.
- 54. Forms of “statistical” relationship Correlation Contingency Cause-and-effect * Causal * Feedback * Multi-directional * Recursive The last two categories are normally dealt with through regression