


Biostatistics in Orthodontics -ARATHY.pptx
- 1. BIOSTATISTICS Dr. ARATHY M N 1st year PG
- 2. INTRODUCTION
- 3. USES OF BIOSTATISTICS IN DENTISTRY To assess the state of oral health in the community & to determine the availability & utilization of dental care facilities. To indicate the basic factors underlying the state of oral health by diagnosing the community & solutions to such problems. To determine success or failure of specific oral health care program or to evaluate the programme action. To promote health legislation and in creating administrative standards for oral health
- 4. BASIS FOR STATISTICAL ANALYSIS Statistical analysis are based on 3 primary entities : The population (u) that is of interest Variables (v) : set of characteristics of the units of this population The probability distribution (p) of these characteristics in the population
- 5. The population Collection of units of observation that are of interest and is the target of the investigation For eg: in determining the effectiveness of a particular drug for a disease, the population would consist of all possible pts with this disease Success of the investigation will depend to a large extend on the identification of the population of interest The variables A variable is a state, condition, concept or event whose value is free to vary within the population Once population is identified, we should clearly define what characteristics of the units of this population are we planning to investigate
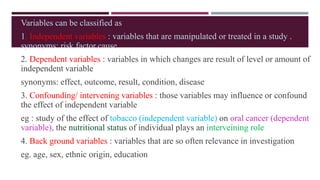
- 6. Variables can be classified as 1. Independent variables : variables that are manipulated or treated in a study . synonyms: risk factor,cause 2. Dependent variables : variables in which changes are result of level or amount of independent variable synonyms: effect, outcome, result, condition, disease 3. Confounding/ intervening variables : those variables may influence or confound the effect of independent variable eg : study of the effect of tobacco (independent variable) on oral cancer (dependent variable), the nutritional status of individual plays an interveining role 4. Back ground variables : variables that are so often relevance in investigation eg. age, sex, ethnic origin, education
- 7. The probability distribution (p) The probability distribution is a way to enumerate the different values the variable can have, and how frequently each value appears in the population
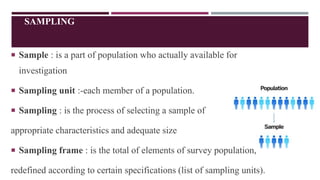
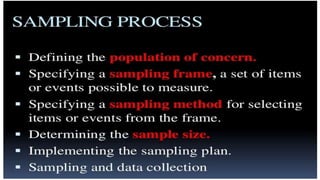
- 8. SAMPLING Sample : is a part of population who actually available for investigation Sampling unit :-each member of a population. Sampling : is the process of selecting a sample of appropriate characteristics and adequate size Sampling frame : is the total of elements of survey population, redefined according to certain specifications (list of sampling units).
- 9. ADVANTAGES OF SAMPLING It reduces the cost of investigation, the time required and the number of personnel involved It allows thorough investigation of the units of observation It helps to provide adequate and in depth coverage of sample units
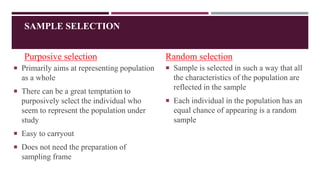
- 11. SAMPLE SELECTION Purposive selection Primarily aims at representing population as a whole There can be a great temptation to purposively select the individual who seem to represent the population under study Easy to carryout Does not need the preparation of sampling frame Random selection Sample is selected in such a way that all the characteristics of the population are reflected in the sample Each individual in the population has an equal chance of appearing is a random sample
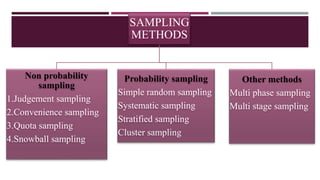
- 12. SAMPLING METHODS Non probability sampling 1.Judgement sampling 2.Convenience sampling 3.Quota sampling 4.Snowball sampling Probability sampling Simple random sampling Systematic sampling Stratified sampling Cluster sampling Other methods Multi phase sampling Multi stage sampling
- 13. JUDGEMENT SAMPLING Also called purposive/ deliberate sampling Sample members are chosen only on the basis of the researcher’s knowledge and judgement Merits Small no of sample unit Study unknown traits/ case Demerits Personal prejudice and bias No objective way of evaluating reliability of results
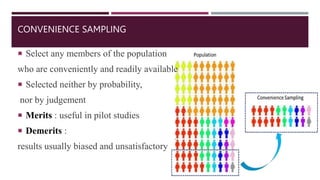
- 14. CONVENIENCE SAMPLING Select any members of the population who are conveniently and readily available Selected neither by probability, nor by judgement Merits : useful in pilot studies Demerits : results usually biased and unsatisfactory
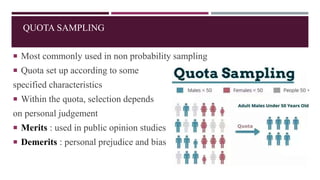
- 15. QUOTA SAMPLING Most commonly used in non probability sampling Quota set up according to some specified characteristics Within the quota, selection depends on personal judgement Merits : used in public opinion studies Demerits : personal prejudice and bias
- 16. SNOWBALL SAMPLING A special non probability method used when the desired sample characteristic is rare Snowball sampling relies on referrals from initial subjects to generate additional subjects
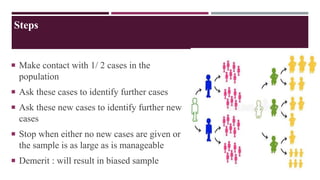
- 17. Steps Make contact with 1/ 2 cases in the population Ask these cases to identify further cases Ask these new cases to identify further new cases Stop when either no new cases are given or the sample is as large as is manageable Demerit : will result in biased sample
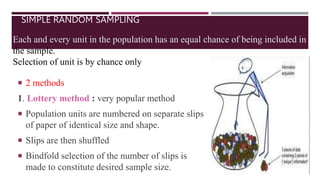
- 18. SIMPLE RANDOM SAMPLING 2 methods 1. Lottery method : very popular method Population units are numbered on separate slips of paper of identical size and shape. Slips are then shuffled Bindfold selection of the number of slips is made to constitute desired sample size. Each and every unit in the population has an equal chance of being included in the sample. Selection of unit is by chance only
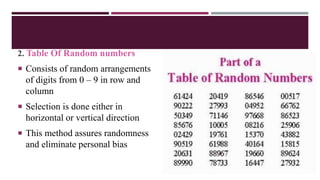
- 19. 2. Table Of Random numbers Consists of random arrangements of digits from 0 – 9 in row and column Selection is done either in horizontal or vertical direction This method assures randomness and eliminate personal bias
- 20. Merits No personal bias Sample more representative of population Demerits Cases too widely dispersed – more time and cost
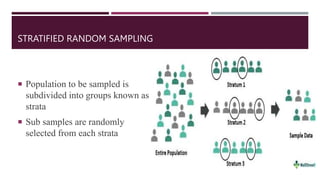
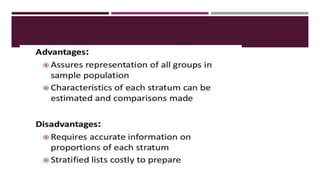
- 21. STRATIFIED RANDOM SAMPLING Population to be sampled is subdivided into groups known as strata Sub samples are randomly selected from each strata
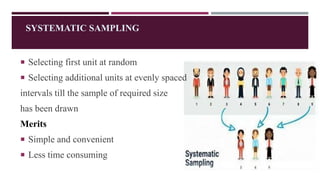
- 23. SYSTEMATIC SAMPLING Selecting first unit at random Selecting additional units at evenly spaced intervals till the sample of required size has been drawn Merits Simple and convenient Less time consuming
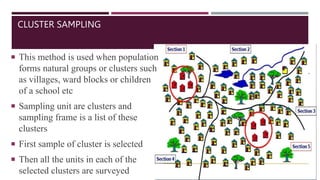
- 24. CLUSTER SAMPLING This method is used when population forms natural groups or clusters such as villages, ward blocks or children of a school etc Sampling unit are clusters and sampling frame is a list of these clusters First sample of cluster is selected Then all the units in each of the selected clusters are surveyed
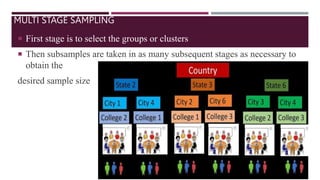
- 25. MULTI STAGE SAMPLING First stage is to select the groups or clusters Then subsamples are taken in as many subsequent stages as necessary to obtain the desired sample size
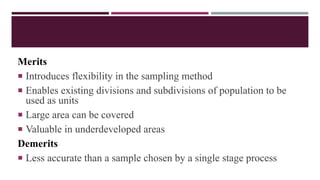
- 26. Merits Introduces flexibility in the sampling method Enables existing divisions and subdivisions of population to be used as units Large area can be covered Valuable in underdeveloped areas Demerits Less accurate than a sample chosen by a single stage process
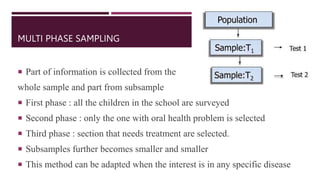
- 27. MULTI PHASE SAMPLING Part of information is collected from the whole sample and part from subsample First phase : all the children in the school are surveyed Second phase : only the one with oral health problem is selected Third phase : section that needs treatment are selected. Subsamples further becomes smaller and smaller This method can be adapted when the interest is in any specific disease
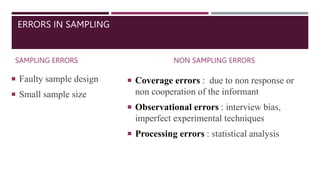
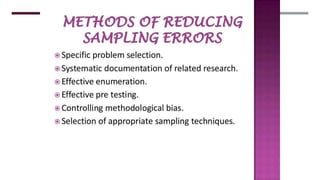
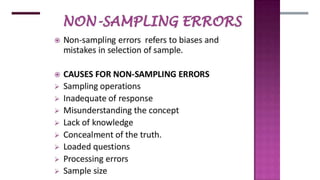
- 28. ERRORS IN SAMPLING SAMPLING ERRORS Faulty sample design Small sample size NON SAMPLING ERRORS Coverage errors : due to non response or non cooperation of the informant Observational errors : interview bias, imperfect experimental techniques Processing errors : statistical analysis
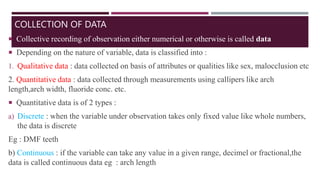
- 32. COLLECTION OF DATA Collective recording of observation either numerical or otherwise is called data Depending on the nature of variable, data is classified into : 1. Qualitative data : data collected on basis of attributes or qualities like sex, malocclusion etc 2. Quantitative data : data collected through measurements using callipers like arch length,arch width, fluoride conc. etc. Quantitative data is of 2 types : a) Discrete : when the variable under observation takes only fixed value like whole numbers, the data is discrete Eg : DMF teeth b) Continuous : if the variable can take any value in a given range, decimel or fractional,the data is called continuous data eg : arch length
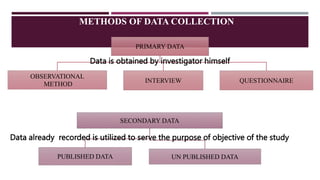
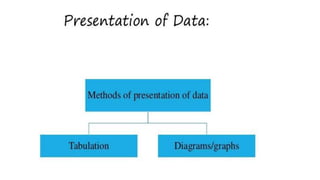
- 33. PRIMARY DATA OBSERVATIONAL METHOD INTERVIEW QUESTIONNAIRE METHODS OF DATA COLLECTION SECONDARY DATA PUBLISHED DATA UN PUBLISHED DATA Data is obtained by investigator himself Data already recorded is utilized to serve the purpose of objective of the study
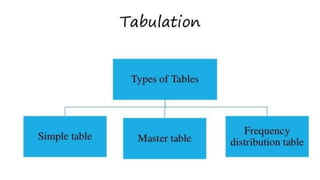
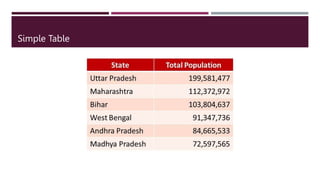
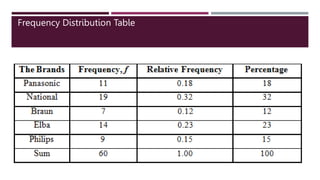
- 36. Simple Table
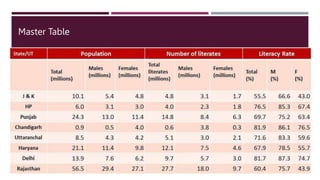
- 37. Master Table
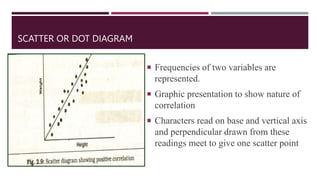
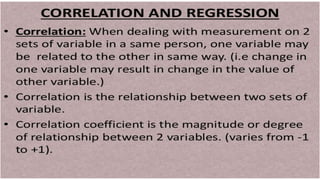
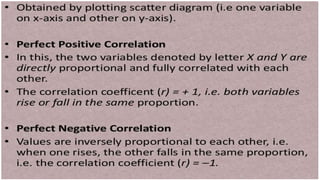
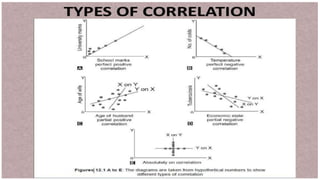
- 48. SCATTER OR DOT DIAGRAM Frequencies of two variables are represented. Graphic presentation to show nature of correlation Characters read on base and vertical axis and perpendicular drawn from these readings meet to give one scatter point
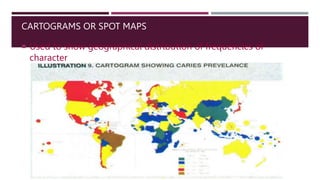
- 49. CARTOGRAMS OR SPOT MAPS Used to show geographical distribution of frequencies of character
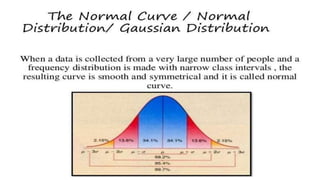
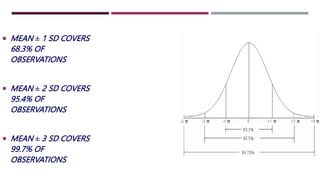
- 63. MEAN ± 1 SD COVERS 68.3% OF OBSERVATIONS MEAN ± 2 SD COVERS 95.4% OF OBSERVATIONS MEAN ± 3 SD COVERS 99.7% OF OBSERVATIONS
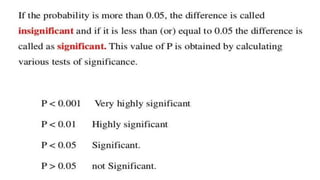
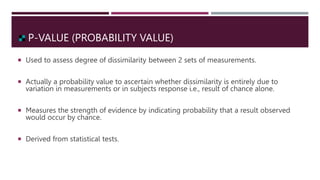
- 66. P-VALUE (PROBABILITY VALUE) Used to assess degree of dissimilarity between 2 sets of measurements. Actually a probability value to ascertain whether dissimilarity is entirely due to variation in measurements or in subjects response i.e., result of chance alone. Measures the strength of evidence by indicating probability that a result observed would occur by chance. Derived from statistical tests.
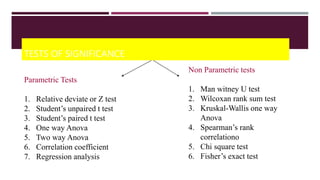
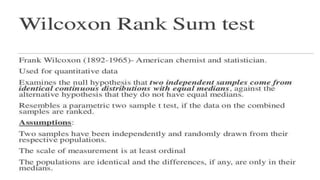
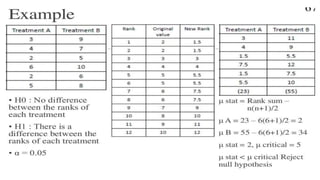
- 68. TESTS OF SIGNIFICANCE Parametric Tests 1. Relative deviate or Z test 2. Student’s unpaired t test 3. Student’s paired t test 4. One way Anova 5. Two way Anova 6. Correlation coefficient 7. Regression analysis Non Parametric tests 1. Man witney U test 2. Wilcoxan rank sum test 3. Kruskal-Wallis one way Anova 4. Spearman’s rank correlationo 5. Chi square test 6. Fisher’s exact test
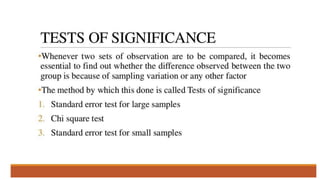
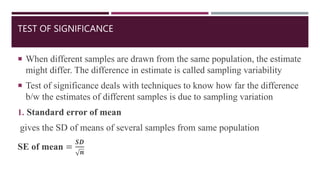
- 69. TEST OF SIGNIFICANCE When different samples are drawn from the same population, the estimate might differ. The difference in estimate is called sampling variability Test of significance deals with techniques to know how far the difference b/w the estimates of different samples is due to sampling variation 1. Standard error of mean gives the SD of means of several samples from same population SE of mean = 𝑺𝑫 𝒏
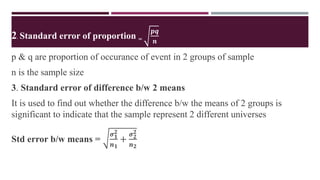
- 70. 2. Standard error of proportion = 𝒑𝒒 𝒏 p & q are proportion of occurance of event in 2 groups of sample n is the sample size 3. Standard error of difference b/w 2 means It is used to find out whether the difference b/w the means of 2 groups is significant to indicate that the sample represent 2 different universes Std error b/w means = 𝝈𝟏 𝟐 𝒏𝟏 + 𝝈𝟐 𝟐 𝒏𝟐
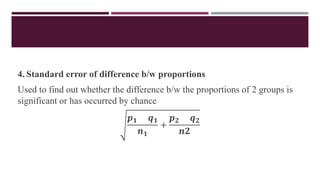
- 71. 4. Standard error of difference b/w proportions Used to find out whether the difference b/w the proportions of 2 groups is significant or has occurred by chance 𝒑𝟏 𝒒𝟏 𝒏𝟏 + 𝒑𝟐 𝒒𝟐 𝒏𝟐
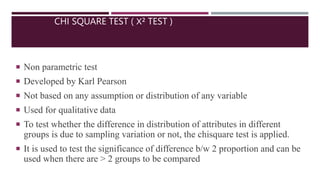
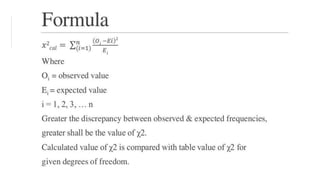
- 72. CHI SQUARE TEST ( Χ² TEST ) Non parametric test Developed by Karl Pearson Not based on any assumption or distribution of any variable Used for qualitative data To test whether the difference in distribution of attributes in different groups is due to sampling variation or not, the chisquare test is applied. It is used to test the significance of difference b/w 2 proportion and can be used when there are > 2 groups to be compared
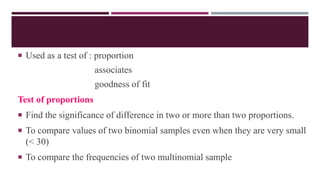
- 73. Used as a test of : proportion associates goodness of fit Test of proportions Find the significance of difference in two or more than two proportions. To compare values of two binomial samples even when they are very small (< 30) To compare the frequencies of two multinomial sample
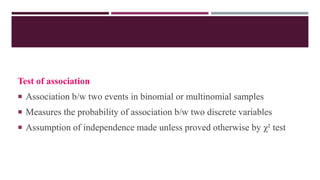
- 74. Test of association Association b/w two events in binomial or multinomial samples Measures the probability of association b/w two discrete variables Assumption of independence made unless proved otherwise by χ² test
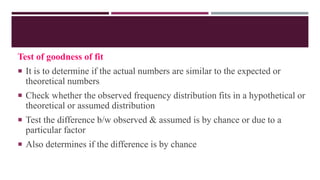
- 75. Test of goodness of fit It is to determine if the actual numbers are similar to the expected or theoretical numbers Check whether the observed frequency distribution fits in a hypothetical or theoretical or assumed distribution Test the difference b/w observed & assumed is by chance or due to a particular factor Also determines if the difference is by chance
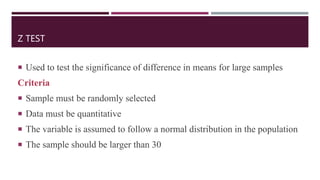
- 79. Z TEST Used to test the significance of difference in means for large samples Criteria Sample must be randomly selected Data must be quantitative The variable is assumed to follow a normal distribution in the population The sample should be larger than 30
- 80. A null hypothesis / hypothesis of no difference (H0) asserts that there is no real difference in sample and the population in particular matter under consideration and the difference found is accidental and arised out of sampling variations The alternate hypothesis of significant difference (H1) stated that there is a difference b/w the 2 groups compared A test of significance such as Z test is performed to accept the null hypothesis H0 or to reject it and accept the alternate hypothesis H1
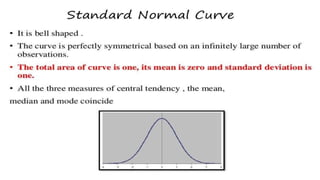
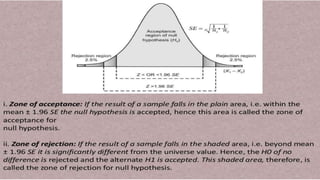
- 81. To make minimum error in rejection or acceptance of H0, we divide the sampling distribution or the area under the normal curve into 2 regions or zone Zone of acceptance Zone of rejection The distance from the mean at which H0 is rejected is called the level of significance
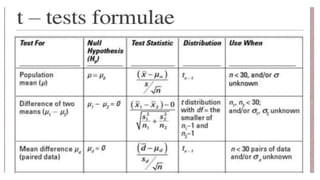
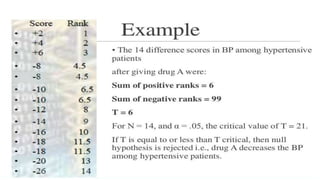
- 83. T – TEST Designed by W.S. Gosset; whose pen name was “student”. Hence this test is named so To test the significance of difference between 2 means in small sample. There are 2 types of Student’s t-test:- -paired t-test. -unpaired t-test.
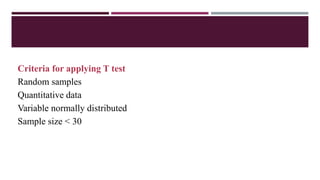
- 84. Criteria for applying T test Random samples Quantitative data Variable normally distributed Sample size < 30
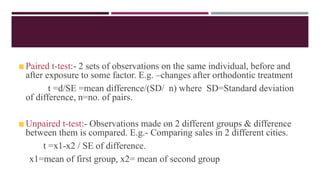
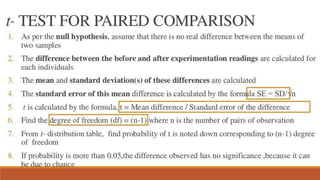
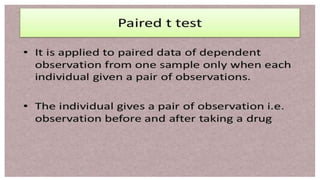
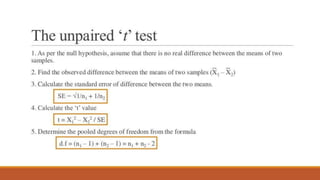
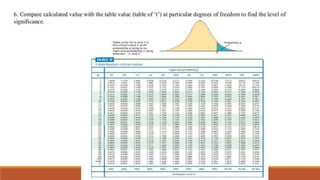
- 85. Paired t-test:- 2 sets of observations on the same individual, before and after exposure to some factor. E.g. –changes after orthodontic treatment t =d/SE =mean difference/(SD/ n) where SD=Standard deviation of difference, n=no. of pairs. Unpaired t-test:- Observations made on 2 different groups & difference between them is compared. E.g.- Comparing sales in 2 different cities. t =x1-x2 / SE of difference. x1=mean of first group, x2= mean of second group
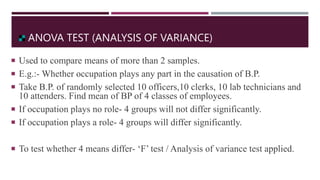
- 91. ANOVA TEST (ANALYSIS OF VARIANCE) Used to compare means of more than 2 samples. E.g.:- Whether occupation plays any part in the causation of B.P. Take B.P. of randomly selected 10 officers,10 clerks, 10 lab technicians and 10 attenders. Find mean of BP of 4 classes of employees. If occupation plays no role- 4 groups will not differ significantly. If occupation plays a role- 4 groups will differ significantly. To test whether 4 means differ- ‘F’ test / Analysis of variance test applied.
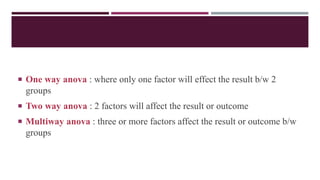
- 92. One way anova : where only one factor will effect the result b/w 2 groups Two way anova : 2 factors will affect the result or outcome Multiway anova : three or more factors affect the result or outcome b/w groups
- 108. REFERENCES Essentials of preventive and community dentistry – Soben peter (4th edition) Parks textbook of preventive and social medicine (18th edition)