
Biostatistics Lecture 1 8th Sem B.Pharm AKTU
- 1. Branch – PHARMACY Biostatistics And Research Methodology (BP801T) DR. APJ ABDUL KALAM TECHNICAL UNIVERSITY By Dr. MANOJ KUMAR SHARMA Associate Professor I.T.S College of Pharmacy, MURADNAGAR Lecture – 1 Introduction
- 2. Contents • Statistics, • Biostatistics, • Frequency distribution
- 3. Introduction The word statistics conveys a variety of meaning to people in different walks of life. The word statistics comes from the Italian words Statista ( Statement).
- 4. CONT…INTRODUCTION The German word Statistik Political state The word Statistics today refers to either quantitative information or a method of delaling with quantitative or qualitative information.
- 5. DEFINITION “Statistics is defined as collection, Presentation, analysis and interpretation of numerical data”.Acc. Croxton & cowden Statistics is the sciences and art of dealing with figure and facts.
- 6. WHAT IS STATISTICS? • Statistics is a field of mathematical sciences that deals with data. • The word statistics is used both to refer to a set of data and to a field of study. • It is concerned with making decisions under uncertainties that occur when the data are subjected to variation.
- 7. Biostatistics Biostatistics-a portmanteau word made from biology and statistics Biostatistics is also called “Biometry” In Greek, Bios- Life Metron- Measured So, it is measurement of life
- 8. Biostatistics cont… Biostatistics is the branch of statistics applied to biological or medical sciences. Biostatistics is the methods used in dealing with statistics in the field of health sciences such as biology, medicine, nursing, public health etc
- 9. Biostatistics It is the science which deals with development and application of the most appropriate methods for the: Collection of data. Presentation of the collected data. Analysis and interpretation of the results. Making decisions on the basis of such analysis
- 10. Frequency Distribution • It is a statistical method for summarizing the data. • A statistical data consist of a list of numbers related to a research, among those numbers , few may be repeated twice and more than twice. • The repeating numbers in a data set is termed as ‘frequency’; that frequencies are listed in a table is known as ‘frequency distribution/table’.
- 11. Objectives of Frequency Distribution 1-To estimate the frequencies of the population . 2-To facilitate the analysis of data. 3-To facilitate computation of various statistical measures.
- 12. Components of Frequency Distribution 1-Class Groups according to size of data. 2-Class limit The smallest and largest possible measurements in each classes. *lower limit *upper limit
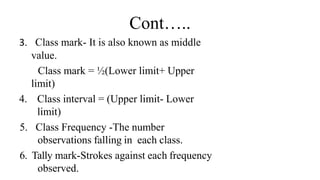
- 13. Cont….. 3. Class mark- It is also known as middle value. Class mark = ½(Lower limit+ Upper limit) 4. Class interval = (Upper limit- Lower limit) 5. Class Frequency -The number observations falling in each class. 6. Tally mark-Strokes against each frequency observed.
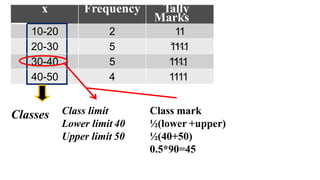
- 14. x Frequency Tally Marks 10-20 2 11 20-30 5 1111 30-40 5 1111 40-50 4 1111 Classes Class limit Lower limit 40 Upper limit 50 Class mark ½(lower +upper) ½(40+50) 0.5*90=45
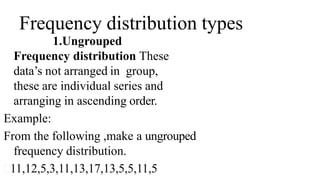
- 15. Frequency distribution types 1.Ungrouped Frequency distribution These data’s not arranged in group, these are individual series and arranging in ascending order. Example: From the following ,make a ungrouped frequency distribution. 11,12,5,3,11,13,17,13,5,5,11,5
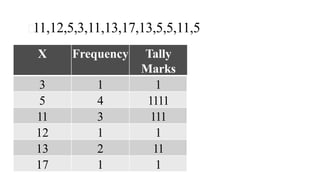
- 16. 11,12,5,3,11,13,17,13,5,5,11,5 X Frequency Tally Marks 3 1 1 5 4 1111 11 3 111 12 1 1 13 2 11 17 1 1
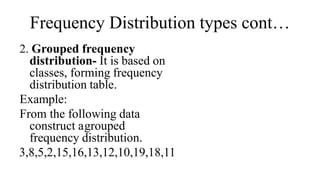
- 17. Frequency Distribution types cont… 2. Grouped frequency distribution- It is based on classes, forming frequency distribution table. Example: From the following data construct agrouped frequency distribution. 3,8,5,2,15,16,13,12,10,19,18,11
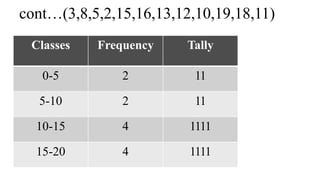
- 18. cont…(3,8,5,2,15,16,13,12,10,19,18,11) Classes Frequency Tally 0-5 2 11 5-10 2 11 10-15 4 1111 15-20 4 1111
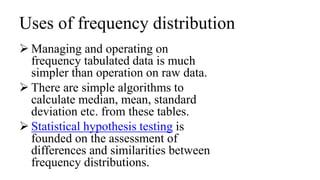
- 19. Uses of frequency distribution Managing and operating on frequency tabulated data is much simpler than operation on raw data. There are simple algorithms to calculate median, mean, standard deviation etc. from these tables. Statistical hypothesis testing is founded on the assessment of differences and similarities between frequency distributions.
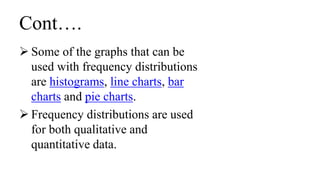
- 20. Cont…. Some of the graphs that can be used with frequency distributions are histograms, line charts, bar charts and pie charts. Frequency distributions are used for both qualitative and quantitative data.
- 21. THANK YOU