SlideShare a Scribd company logo
Biostatistics
Chapter-10
Chi-square Test
Lecture Objective
• To understand the concept of Chi-square test
• To learn about two main types of Chi-square test
• Chi-square for independence test
• Chi-square for Goodness of fit test
• To determine uses of two main types of chi-square test.
• To recognize contingency table and its appropriate for Chi-square independence
test
• To learn about formula in Chi-square test
Introduction to Chi-square
• Definition
• Chi-squared test is a statistical test used to find the relationship between the
observed values and the expected values of raw variables.
• The chi-square test is a non-parametric test that compares two or more
variables from randomly selected data.
• A chi-square test is a statistical test that can figure out;
• if there is any statistical significance between categorical variables.
• It is used to determine if results are due to chance or due to some relationship
between the studied variables.
• To determine whether the association between two qualitative variables is
statistically significant, researchers must conduct a test of significance called
the Chi-Square Test.
Assumptions
• Assumptions
1.One categorical variable - can be dichotomous, nominal, or ordinal
2.Independence of observations
3.Groups are mutually exclusive - participants can only belong to one group
4.At least 5 expected frequencies in each group
Uses of the Chi-Squared test Statistic
• The purpose of chi-square test is;
• To compare for categorical data.
• The chi-squared statistic provides a test of the association between two or more
groups, populations,
• The chi-square test can be used to test the strength of the association between
exposure and disease in a cohort study, an unmatched case-control study, or a cross-
sectional study.
• To determine if the observed experimental variables are independent each other by
calculating their statistical significance.
• If statistical significance is present, the null hypothesis is rejecting.
• If statistical significance is absent, the null hypothesis fail to reject.
Types of chi-square test
• Pearson's chi-square tests are classified into two types:
1.Chi-square of independence test
2.Chi-square goodness-of-fit test
• Mathematically, these are actually the same test formula.
• However, we often think of them as different tests because they’re used for
different purposes.
Chi-square test of independence
• Definition:
• A Chi-Square Test of Independence is used to determine whether or not there
is a statistically significant association between two categorical
variables( Qualitative variables).
• This test is used when we have two categorical variables (nominal or ordinal)
• When to use the chi-square test of independence
• The chi-square test of independence is used to when we have two categorical
variables and you want to test a hypothesis about their relationship.
• In this case there will be two qualitative survey questions or experiments and a
contingency table will be constructed.
Formula for Chi-square Test
• The chi-square formula
• Both of Pearson’s chi-square tests use the same formula to calculate the test
statistic, chi-square (Χ2):
• Where:
• Χ2 is the chi-square test statistic
• Σ is the summation operator (it means “take the sum of”)
• O is the observed frequency
• E is the expected frequency
Tests Using Contingency Tables
• Contingency tables
• When you want to perform a chi-square test of independence, the best way to
organize your data is a type of frequency distribution table called
a contingency table.
• A contingency table, also known as a cross tabulation or crosstab, shows the
number of observations in each combination of groups.
• The goal of the contingency table that will be constructed is to see if the two
variables are unrelated (independent) or related (dependent).
• It also usually includes row total and column totals.
Real-life examples in chi-square for independence
• A Test about the Covid-19 vaccine preventive the following result found;
• Solution
Attacked Not- Attacked
Vaccinated 24 60
Not- vaccinated 36 20
Attacked Not- Attacked Total
Vaccinated 24 60 84
Not- vaccinated 36 20 56
Total 60 80 140
Cont..
• We look for expected value; to find we applied for its formula
•
• = 36
• = 48
• = 24
• = 32
Cont..
• The solution will be follow five steps procedure hypothesis
• 1. H : there is no effect a vaccine on Covid-19
₀
• H : there is effect a vaccine on Covid-19
₁
• 2. 0.05
• 3. = + + + = 17.5
• Degrees of freedom = 1 for a 2x2 table
• Df = (r- 1)(c – 1) = 1*1 = 1
• When the degree of freedom of chi-square is 1, the table value of chi-square
is always equal to 3.841.
Cont..
• 4. decision rule; if > we reject H . Otherwise we fail to reject H . At 5% level of
₀ ₀
confidence and 1 df the value of chi-square is 3.841.
• Thus, our calculated value is 17.5.
• Since, so we reject H . And we conclude that there is a statistically
₀
significance effect a vaccine on Covid-19.
Example-2
• The relationship between disease and exposure may be displayed in a
contingency table.
Solution Disease
Exposure Yes No
Yes 37 13
No 17 53
Exposure Yes No Total
Yes 37 13 50
No 17 53 70
Total 54 66 120
Cont..
• We look for expected value; to find we applied for its formula
•
• = 22.5
• = 27.5
• = 31.5
• = 38.5
Cont..
• The solution will be follow five steps procedure hypothesis
• 1. H : there is no association between exposure and disease
₀
• H : there is association between exposure and disease
₁
• 2. 0.05
• 3. = + + + = 29.1
• Degrees of freedom = 1 for a 2x2 table
• df = (r- 1)(c – 1) = 1*1 = 1
• The test statistic is: − χ2 = 29.1 with 1 degree of freedom
• When the degree of freedom of chi-square is 1, the table value of chi-square is
always equal to 3.841.
Cont..
• 4. Decision rule; if we reject H . Otherwise we fail to reject H .
₀ ₀
• 5. Since, 29.1) is greater than, (3.841) so we reject H .
₀
• And we conclude that there is a statistically associated between exposure and
disease.
Example-3
• For example, suppose a new postoperative procedure is administered to a
number of patients in a large hospital. The researcher can ask the question, Do
the doctors feel differently about this procedure from the nurses, or do they feel
basically the same way?
• Note that the question is not whether they prefer the procedure but whether
there is a difference of opinion between the two groups.
Group Prefer new procedure Prefer old procedure No preference
Nurses 100 80 20
Doctors 50 120 30
Cont..
• As the survey indicates, 100 nurses prefer the new procedure, 80 prefer the old
procedure, and 20 have no preference; 50 doctors prefer the new procedure,
120 like the old procedure, and 30 have no preference.
• Since the main question is whether there is a difference in opinion, the null
hypothesis is stated as follows:
Solution
• Table below show the point started of solution chi-square of independence 2by 3
table.
• = = 100, = = 25.
• = = 75, = = 100, = = 25.
Group Prefer new
procedure
Prefer Old
procedure
No preference Total
Nurses 100 80 20 200
Doctors 50 120 30 200
Total 150 200 50 400
Cont..
• Now, we follow five steps procedure in hypothesis testing;
• 1. H : there is no preference between new procedure and old procedure
₀
• H : there is preference between new procedure and old procedure.
₁
• 2. 0.05
• 3. Test statistic;
• ++ + + + = 26.67
• 4. Decision rule; if we reject H . Otherwise we fail to reject H .
₀ ₀
• Since, (26.67) is greater than, (5.991) we reject H . And we conclude that there
₀
is a statistical significant preference between new procedure and old procedure.
Practice assessment during the class
• Test of Association in a Cohort Study
• Develop CHD
• At = 0.05, can the researcher conclude that Develop coronary heart disease is
related to smoking ?
• .State the hypotheses and identify the claim.
• Compute the test value. First, compute the expected values
• Find the degree of freedom and critical value
• Make decision and conclusion.
Smoke Yes No
Yes 84 2916
No 87 4913
Practice assessment during the class
• Alcohol and Gender
• A researcher wishes to determine whether there is a relationship between the gender of an
individual and the amount of alcohol consumed. A sample of 68 people is selected, and the
following data are obtained.
• Alcohol consumption
• At = 0.10, can the researcher conclude that alcohol consumption is related to gender?
• .State the hypotheses and identify the claim.
• Compute the test value. First, compute the expected values
• Find the degree of freedom and critical value
• Make decision and conclusion.
Gender Low Moderate Hight
Male 10 9 8
Female 13 16 12
Chi-square for Goodness-of-Fit
• Definition
• Goodness-of-fit test is statistical method that make inferences about observed
values.
• In other words, Goodness-of-fit is a statistical method for assessing how well a
sample of data matches a given distribution as its population.
• It is a technique is used for checking the accordance between observed and
expected data.
• It assesses “how well actual (observed) data points fit into a given model.
• Furthermore, the techniques are generally developed in association with
univariate data rather than bivariate and multivariate data.
Cont..
• Goodness-of-Fit: Use the goodness-of-fit test to decide whether a population
with an unknown distribution “fits” a known distribution. In this case there will
be a single qualitative survey question or a single outcome of an experiment
from a single population. Goodness-of-Fit is typically used to see if the
population is uniform (all outcomes occur with equal frequency),
• A Chi-square goodness-of-fit test is used to evaluate the distribution of a
categorical variable with more than 2 levels/categories
Uses of Chi-square for Goodness of fit
• The chi-square goodness of fit test is used for when you
have one categorical variable and you want to test a hypothesis about
its distribution.
• It is appropriate when the researcher has only one categorical variable
• the chi-square goodness of fit test can be used to the frequency distribution of
the categorical variable is evaluated for determining whether it differs
significantly from what you expected.
Example-1
• Are births evenly distributed across the days of the week?
• the one ways of the week in random sample of 140 births from local
records in the a large city.
• Do these data give significant evidence that local births are not equally
likely on all days of the week?
• In this case, the equal frequency is 140/7 = 20. That is, approximately 20
births would select each days.
Days Sun Mon Tues Wed Thurs Fri Sat
Births 13 23 24 20 27 18 15
Solution
• Since the frequencies for each flavor were obtained from a sample, these actual
frequencies are called the observed frequencies. The frequencies obtained by
calculation are called the expected frequencies. A completed table for the test is
shown.
• Sun Mon Tues Wed Thurs Fri Sat
• Observed 13 23 24 20 27 18 15
• Expected 20 20 20 20 20 20 20
Cont..
• Now, we follow five steps procedure in hypothesis testing:
• 1. H : there no equally likely births on the days of the week,
₀
• H : there is equally likely births on the days of the week.
₁
• 2. 0.05
• 2. Test statistic (x) =
• + + + + =
• = 7.6
• Df = n-1 = 7-1 = 6. then we read from critical value in at 0.05.
• The value CV = 12.592
Cont..
• 4. decision rule; if we reject H . Otherwise we fail to reject H .
₀ ₀
• 5. Since, (7.6) is less than, (12.592) so we fail to reject H .
₀
• And we conclude that there is no a statistically significant difference births days
of the weeks which recorded local in a large city.
Thank you for your listening
Any Question?

More Related Content

Similar to Biostatistics- lesson is chapter-10.pptx (20)

PPTX
Chi square test
Dr.Syam Chandran.C
 
PPTX
Chi square
Kevin Chun-Hsien Hsu
 
PDF
7. Chi square test.pdf pharmaceutical biostatistics
Jayashritha
 
PPTX
The Chi-Square Statistic: Tests for Goodness of Fit and Independence
jasondroesch
 
PPTX
Chisquare
keerthi samuel
 
PPT
Chi square mahmoud
Mohammad Ihmeidan
 
PDF
Chi sqaure test
Pritam Kolge
 
PPTX
Chi square test
Nayna Azad
 
PPTX
Chi-square test.pptx
agtech7
 
PPTX
Chi-Square tests. hsbhbxiibsbbxbbbbbibbhshx
gumihoorange
 
PPT
Chi-square IMP.ppt
Shivraj Nile
 
PPTX
Ch 11.2 Chi Squared Test for Independence.pptx
BAGARAGAZAROMUALD2
 
PPTX
Testing of hypothesis - Chi-Square test
Parag Shah
 
PPTX
Chi square(hospital admin) A
Mmedsc Hahm
 
PPTX
Chi square
HemamaliniSakthivel
 
PDF
Unit-4.-Chi-squjkljl;jj;ljl;jlm;lml;mare.pdf
JITENDER773791
 
DOCX
Week 5 Lecture 14 The Chi Square TestQuite often, patterns of .docx
cockekeshia
 
PPTX
Busniess stats
VishalHotchandani2
 
DOCX
Week 5 Lecture 14 The Chi Square Test Quite often, pat.docx
cockekeshia
 
PPT
23-Statistical_tests_(chi-square,Fishers___&Macnemars))(UG1435-36).ppt
kamranhanif3111
 
Chi square test
Dr.Syam Chandran.C
 
7. Chi square test.pdf pharmaceutical biostatistics
Jayashritha
 
The Chi-Square Statistic: Tests for Goodness of Fit and Independence
jasondroesch
 
Chisquare
keerthi samuel
 
Chi square mahmoud
Mohammad Ihmeidan
 
Chi sqaure test
Pritam Kolge
 
Chi square test
Nayna Azad
 
Chi-square test.pptx
agtech7
 
Chi-Square tests. hsbhbxiibsbbxbbbbbibbhshx
gumihoorange
 
Chi-square IMP.ppt
Shivraj Nile
 
Ch 11.2 Chi Squared Test for Independence.pptx
BAGARAGAZAROMUALD2
 
Testing of hypothesis - Chi-Square test
Parag Shah
 
Chi square(hospital admin) A
Mmedsc Hahm
 
Chi square
HemamaliniSakthivel
 
Unit-4.-Chi-squjkljl;jj;ljl;jlm;lml;mare.pdf
JITENDER773791
 
Week 5 Lecture 14 The Chi Square TestQuite often, patterns of .docx
cockekeshia
 
Busniess stats
VishalHotchandani2
 
Week 5 Lecture 14 The Chi Square Test Quite often, pat.docx
cockekeshia
 
23-Statistical_tests_(chi-square,Fishers___&Macnemars))(UG1435-36).ppt
kamranhanif3111
 

Recently uploaded (20)

PPTX
Capitol Doctoral Presentation -July 2025.pptx
CapitolTechU
 
PPTX
Views on Education of Indian Thinkers J.Krishnamurthy..pptx
ShrutiMahanta1
 
PDF
Zoology (Animal Physiology) practical Manual
raviralanaresh2
 
PDF
FULL DOCUMENT: Read the full Deloitte and Touche audit report on the National...
Kweku Zurek
 
PPTX
Nutri-QUIZ-Bee-Elementary.pptx...................
ferdinandsanbuenaven
 
PPTX
Explorando Recursos do Summer '25: Dicas Essenciais - 02
Mauricio Alexandre Silva
 
PPTX
How to Configure Access Rights of Manufacturing Orders in Odoo 18 Manufacturing
Celine George
 
PPTX
PYLORIC STENOSIS: NURSING MANAGEMENT.pptx
PRADEEP ABOTHU
 
PPTX
ROLE OF ANTIOXIDANT IN EYE HEALTH MANAGEMENT.pptx
Subham Panja
 
PPTX
2025 Winter SWAYAM NPTEL & A Student.pptx
Utsav Yagnik
 
PPTX
CONVULSIVE DISORDERS: NURSING MANAGEMENT.pptx
PRADEEP ABOTHU
 
PPTX
Folding Off Hours in Gantt View in Odoo 18.2
Celine George
 
PDF
Federal dollars withheld by district, charter, grant recipient
Mebane Rash
 
PPTX
SAMPLING: DEFINITION,PROCESS,TYPES,SAMPLE SIZE, SAMPLING ERROR.pptx
PRADEEP ABOTHU
 
PPTX
nutriquiz grade 4.pptx...............................................
ferdinandsanbuenaven
 
PDF
IMP NAAC-Reforms-Stakeholder-Consultation-Presentation-on-Draft-Metrics-Unive...
BHARTIWADEKAR
 
PPT
digestive system for Pharm d I year HAP
rekhapositivity
 
PPTX
CLEFT LIP AND PALATE: NURSING MANAGEMENT.pptx
PRADEEP ABOTHU
 
PPTX
THE HUMAN INTEGUMENTARY SYSTEM#MLT#BCRAPC.pptx
Subham Panja
 
PPTX
Optimizing Cancer Screening With MCED Technologies: From Science to Practical...
i3 Health
 
Capitol Doctoral Presentation -July 2025.pptx
CapitolTechU
 
Views on Education of Indian Thinkers J.Krishnamurthy..pptx
ShrutiMahanta1
 
Zoology (Animal Physiology) practical Manual
raviralanaresh2
 
FULL DOCUMENT: Read the full Deloitte and Touche audit report on the National...
Kweku Zurek
 
Nutri-QUIZ-Bee-Elementary.pptx...................
ferdinandsanbuenaven
 
Explorando Recursos do Summer '25: Dicas Essenciais - 02
Mauricio Alexandre Silva
 
How to Configure Access Rights of Manufacturing Orders in Odoo 18 Manufacturing
Celine George
 
PYLORIC STENOSIS: NURSING MANAGEMENT.pptx
PRADEEP ABOTHU
 
ROLE OF ANTIOXIDANT IN EYE HEALTH MANAGEMENT.pptx
Subham Panja
 
2025 Winter SWAYAM NPTEL & A Student.pptx
Utsav Yagnik
 
CONVULSIVE DISORDERS: NURSING MANAGEMENT.pptx
PRADEEP ABOTHU
 
Folding Off Hours in Gantt View in Odoo 18.2
Celine George
 
Federal dollars withheld by district, charter, grant recipient
Mebane Rash
 
SAMPLING: DEFINITION,PROCESS,TYPES,SAMPLE SIZE, SAMPLING ERROR.pptx
PRADEEP ABOTHU
 
nutriquiz grade 4.pptx...............................................
ferdinandsanbuenaven
 
IMP NAAC-Reforms-Stakeholder-Consultation-Presentation-on-Draft-Metrics-Unive...
BHARTIWADEKAR
 
digestive system for Pharm d I year HAP
rekhapositivity
 
CLEFT LIP AND PALATE: NURSING MANAGEMENT.pptx
PRADEEP ABOTHU
 
THE HUMAN INTEGUMENTARY SYSTEM#MLT#BCRAPC.pptx
Subham Panja
 
Optimizing Cancer Screening With MCED Technologies: From Science to Practical...
i3 Health
 
Ad

Biostatistics- lesson is chapter-10.pptx

  • 2. Lecture Objective • To understand the concept of Chi-square test • To learn about two main types of Chi-square test • Chi-square for independence test • Chi-square for Goodness of fit test • To determine uses of two main types of chi-square test. • To recognize contingency table and its appropriate for Chi-square independence test • To learn about formula in Chi-square test
  • 3. Introduction to Chi-square • Definition • Chi-squared test is a statistical test used to find the relationship between the observed values and the expected values of raw variables. • The chi-square test is a non-parametric test that compares two or more variables from randomly selected data. • A chi-square test is a statistical test that can figure out; • if there is any statistical significance between categorical variables. • It is used to determine if results are due to chance or due to some relationship between the studied variables. • To determine whether the association between two qualitative variables is statistically significant, researchers must conduct a test of significance called the Chi-Square Test.
  • 4. Assumptions • Assumptions 1.One categorical variable - can be dichotomous, nominal, or ordinal 2.Independence of observations 3.Groups are mutually exclusive - participants can only belong to one group 4.At least 5 expected frequencies in each group
  • 5. Uses of the Chi-Squared test Statistic • The purpose of chi-square test is; • To compare for categorical data. • The chi-squared statistic provides a test of the association between two or more groups, populations, • The chi-square test can be used to test the strength of the association between exposure and disease in a cohort study, an unmatched case-control study, or a cross- sectional study. • To determine if the observed experimental variables are independent each other by calculating their statistical significance. • If statistical significance is present, the null hypothesis is rejecting. • If statistical significance is absent, the null hypothesis fail to reject.
  • 6. Types of chi-square test • Pearson's chi-square tests are classified into two types: 1.Chi-square of independence test 2.Chi-square goodness-of-fit test • Mathematically, these are actually the same test formula. • However, we often think of them as different tests because they’re used for different purposes.
  • 7. Chi-square test of independence • Definition: • A Chi-Square Test of Independence is used to determine whether or not there is a statistically significant association between two categorical variables( Qualitative variables). • This test is used when we have two categorical variables (nominal or ordinal) • When to use the chi-square test of independence • The chi-square test of independence is used to when we have two categorical variables and you want to test a hypothesis about their relationship. • In this case there will be two qualitative survey questions or experiments and a contingency table will be constructed.
  • 8. Formula for Chi-square Test • The chi-square formula • Both of Pearson’s chi-square tests use the same formula to calculate the test statistic, chi-square (Χ2): • Where: • Χ2 is the chi-square test statistic • Σ is the summation operator (it means “take the sum of”) • O is the observed frequency • E is the expected frequency
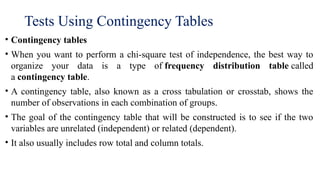
  • 9. Tests Using Contingency Tables • Contingency tables • When you want to perform a chi-square test of independence, the best way to organize your data is a type of frequency distribution table called a contingency table. • A contingency table, also known as a cross tabulation or crosstab, shows the number of observations in each combination of groups. • The goal of the contingency table that will be constructed is to see if the two variables are unrelated (independent) or related (dependent). • It also usually includes row total and column totals.
  • 10. Real-life examples in chi-square for independence • A Test about the Covid-19 vaccine preventive the following result found; • Solution Attacked Not- Attacked Vaccinated 24 60 Not- vaccinated 36 20 Attacked Not- Attacked Total Vaccinated 24 60 84 Not- vaccinated 36 20 56 Total 60 80 140
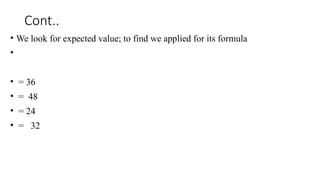
  • 11. Cont.. • We look for expected value; to find we applied for its formula • • = 36 • = 48 • = 24 • = 32
  • 12. Cont.. • The solution will be follow five steps procedure hypothesis • 1. H : there is no effect a vaccine on Covid-19 ₀ • H : there is effect a vaccine on Covid-19 ₁ • 2. 0.05 • 3. = + + + = 17.5 • Degrees of freedom = 1 for a 2x2 table • Df = (r- 1)(c – 1) = 1*1 = 1 • When the degree of freedom of chi-square is 1, the table value of chi-square is always equal to 3.841.
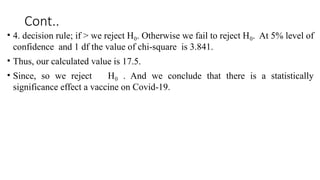
  • 13. Cont.. • 4. decision rule; if > we reject H . Otherwise we fail to reject H . At 5% level of ₀ ₀ confidence and 1 df the value of chi-square is 3.841. • Thus, our calculated value is 17.5. • Since, so we reject H . And we conclude that there is a statistically ₀ significance effect a vaccine on Covid-19.
  • 14. Example-2 • The relationship between disease and exposure may be displayed in a contingency table. Solution Disease Exposure Yes No Yes 37 13 No 17 53 Exposure Yes No Total Yes 37 13 50 No 17 53 70 Total 54 66 120
  • 15. Cont.. • We look for expected value; to find we applied for its formula • • = 22.5 • = 27.5 • = 31.5 • = 38.5
  • 16. Cont.. • The solution will be follow five steps procedure hypothesis • 1. H : there is no association between exposure and disease ₀ • H : there is association between exposure and disease ₁ • 2. 0.05 • 3. = + + + = 29.1 • Degrees of freedom = 1 for a 2x2 table • df = (r- 1)(c – 1) = 1*1 = 1 • The test statistic is: − χ2 = 29.1 with 1 degree of freedom • When the degree of freedom of chi-square is 1, the table value of chi-square is always equal to 3.841.
  • 17. Cont.. • 4. Decision rule; if we reject H . Otherwise we fail to reject H . ₀ ₀ • 5. Since, 29.1) is greater than, (3.841) so we reject H . ₀ • And we conclude that there is a statistically associated between exposure and disease.
  • 18. Example-3 • For example, suppose a new postoperative procedure is administered to a number of patients in a large hospital. The researcher can ask the question, Do the doctors feel differently about this procedure from the nurses, or do they feel basically the same way? • Note that the question is not whether they prefer the procedure but whether there is a difference of opinion between the two groups. Group Prefer new procedure Prefer old procedure No preference Nurses 100 80 20 Doctors 50 120 30
  • 19. Cont.. • As the survey indicates, 100 nurses prefer the new procedure, 80 prefer the old procedure, and 20 have no preference; 50 doctors prefer the new procedure, 120 like the old procedure, and 30 have no preference. • Since the main question is whether there is a difference in opinion, the null hypothesis is stated as follows:
  • 20. Solution • Table below show the point started of solution chi-square of independence 2by 3 table. • = = 100, = = 25. • = = 75, = = 100, = = 25. Group Prefer new procedure Prefer Old procedure No preference Total Nurses 100 80 20 200 Doctors 50 120 30 200 Total 150 200 50 400
  • 21. Cont.. • Now, we follow five steps procedure in hypothesis testing; • 1. H : there is no preference between new procedure and old procedure ₀ • H : there is preference between new procedure and old procedure. ₁ • 2. 0.05 • 3. Test statistic; • ++ + + + = 26.67 • 4. Decision rule; if we reject H . Otherwise we fail to reject H . ₀ ₀ • Since, (26.67) is greater than, (5.991) we reject H . And we conclude that there ₀ is a statistical significant preference between new procedure and old procedure.
  • 22. Practice assessment during the class • Test of Association in a Cohort Study • Develop CHD • At = 0.05, can the researcher conclude that Develop coronary heart disease is related to smoking ? • .State the hypotheses and identify the claim. • Compute the test value. First, compute the expected values • Find the degree of freedom and critical value • Make decision and conclusion. Smoke Yes No Yes 84 2916 No 87 4913
  • 23. Practice assessment during the class • Alcohol and Gender • A researcher wishes to determine whether there is a relationship between the gender of an individual and the amount of alcohol consumed. A sample of 68 people is selected, and the following data are obtained. • Alcohol consumption • At = 0.10, can the researcher conclude that alcohol consumption is related to gender? • .State the hypotheses and identify the claim. • Compute the test value. First, compute the expected values • Find the degree of freedom and critical value • Make decision and conclusion. Gender Low Moderate Hight Male 10 9 8 Female 13 16 12
  • 24. Chi-square for Goodness-of-Fit • Definition • Goodness-of-fit test is statistical method that make inferences about observed values. • In other words, Goodness-of-fit is a statistical method for assessing how well a sample of data matches a given distribution as its population. • It is a technique is used for checking the accordance between observed and expected data. • It assesses “how well actual (observed) data points fit into a given model. • Furthermore, the techniques are generally developed in association with univariate data rather than bivariate and multivariate data.
  • 25. Cont.. • Goodness-of-Fit: Use the goodness-of-fit test to decide whether a population with an unknown distribution “fits” a known distribution. In this case there will be a single qualitative survey question or a single outcome of an experiment from a single population. Goodness-of-Fit is typically used to see if the population is uniform (all outcomes occur with equal frequency), • A Chi-square goodness-of-fit test is used to evaluate the distribution of a categorical variable with more than 2 levels/categories
  • 26. Uses of Chi-square for Goodness of fit • The chi-square goodness of fit test is used for when you have one categorical variable and you want to test a hypothesis about its distribution. • It is appropriate when the researcher has only one categorical variable • the chi-square goodness of fit test can be used to the frequency distribution of the categorical variable is evaluated for determining whether it differs significantly from what you expected.
  • 27. Example-1 • Are births evenly distributed across the days of the week? • the one ways of the week in random sample of 140 births from local records in the a large city. • Do these data give significant evidence that local births are not equally likely on all days of the week? • In this case, the equal frequency is 140/7 = 20. That is, approximately 20 births would select each days. Days Sun Mon Tues Wed Thurs Fri Sat Births 13 23 24 20 27 18 15
  • 28. Solution • Since the frequencies for each flavor were obtained from a sample, these actual frequencies are called the observed frequencies. The frequencies obtained by calculation are called the expected frequencies. A completed table for the test is shown. • Sun Mon Tues Wed Thurs Fri Sat • Observed 13 23 24 20 27 18 15 • Expected 20 20 20 20 20 20 20
  • 29. Cont.. • Now, we follow five steps procedure in hypothesis testing: • 1. H : there no equally likely births on the days of the week, ₀ • H : there is equally likely births on the days of the week. ₁ • 2. 0.05 • 2. Test statistic (x) = • + + + + = • = 7.6 • Df = n-1 = 7-1 = 6. then we read from critical value in at 0.05. • The value CV = 12.592
  • 30. Cont.. • 4. decision rule; if we reject H . Otherwise we fail to reject H . ₀ ₀ • 5. Since, (7.6) is less than, (12.592) so we fail to reject H . ₀ • And we conclude that there is no a statistically significant difference births days of the weeks which recorded local in a large city.
  • 31. Thank you for your listening Any Question?