SlideShare a Scribd company logo
CABT Statistics & Probability – Grade 11 Lecture Presentation
CABT SHS Statistics & Probability - Sampling Distribution of Means
Sampling Distribution
of Means
A Grade 11 Statistics and Probability Lecture
Population and Sample
CABT Statistics & Probability – Grade 11 Lecture Presentation
Sampling Distribution of Means
A population is the set of all items or
individuals of interest.
Examples: All registered voters
Cell phones manufactured today
Sales receipts for August
A sample is a subset of the population.
Examples: 1200 voters selected at random for a
survey
A few cell phones selected for testing
Random receipts selected for audit
Inferential Statistics
CABT Statistics & Probability – Grade 11 Lecture Presentation
Sampling Distribution of Means
Inferential statistics is concerned with
drawing conclusions and/or making decisions
concerning a population based only on
sample data.
http://www.gohomeworkhelp.com/admin/photos/what-is-inferential-statistics.jpg
Population inferences can be made...
...by selecting a representative sample from the
population
Why Sample?!
CABT Statistics & Probability – Grade 11 Lecture Presentation
Sampling Distribution of Means
 Researchers use sampling if taking a
census of the entire population is
impractical.
 It is less time-consuming and less
costly than a census.
 It is possible that data from the sample
can be used to estimate corresponding
population measures.
Types of Sampling
CABT Statistics & Probability – Grade 11 Lecture Presentation
Sampling Distribution of Means
Simple random sampling – every
element of the population has the same
probability of being selected for
inclusion in the sample.
Some simple random sampling
techniques:
1. Lottery or drawing – with or without
replacement
2. Using Random Numbers
Types of Sampling
CABT Statistics & Probability – Grade 11 Lecture Presentation
Sampling Distribution of Means
Simple random sampling and Slovin’s
FormulaSlovin’s Formula is a formula used
to determine the sample size n from
a population of size N and margin of
error e is given by:

 2
1
N
n
Ne
Example: The number of samples needed for a population of
1,000 at a margin of error of 5% is
  
2
1000
286
1 1000 0.05
n  

Types of Sampling
CABT Statistics & Probability – Grade 11 Lecture Presentation
Sampling Distribution of Means
– a list of randomly-arranged
elements of the population is
used as a sampling frame,
and the elements to be
included in the sample are
selected by skipping
through the list at regular
intervals.
Systematic random sampling
http://worldartsme.com/images/holiday-shopping-list-clipart-1.jpg
Types of Sampling
CABT Statistics & Probability – Grade 11 Lecture Presentation
Sampling Distribution of Means
In doing systematic
random sampling in a
population of size N
using a sample size n,
the sampling interval k
is given by
Systematic random sampling
N
k
n

Example:
To get a sample
containing 8 students
from a group of 40
students using
systematic random
sampling, the sampling
interval is
40
5
8
k  
CABT Statistics & Probability – Grade 11 Lecture Presentation
Sampling Distribution of Means
http://users.hist.umn.edu/~ruggles/hist5011/sampling.ppt
Types of Sampling
CABT Statistics & Probability – Grade 11 Lecture Presentation
Sampling Distribution of Means
– the population is
partitioned into
several subgroups
or strata, then
samples are
randomly selected
separately from
each stratum
Stratified random sampling
https://faculty.elgin.edu/dkernler/statistics/ch01/images/strata-sample.gif
Types of Sampling
CABT Statistics & Probability – Grade 11 Lecture Presentation
Sampling Distribution of Means
Proportional allocation of sample size
Stratified random sampling
Population
Strata
Number of
Students
per Strata
No. of
Samples
per Strata
Male 340 20
Female 500 30
TOTAL 840 50
340
50 20.24 20
840
males   
500
50 29.76 30
840
females   
Allocation of samples per
stratum:
Suppose that a sample of size 50 is to be obtained
from a population of 840 students grouped according
to gender:
Types of Sampling
CABT Statistics & Probability – Grade 11 Lecture Presentation
Sampling Distribution of Means
– the population is
broken into small
groups or clusters,
then some of the
clusters are
randomly selected.
Cluster or area sampling
http://research-methodology.net/wp-content/uploads/2013/07/Cluster-sampling.gif
Types of Sampling
CABT Statistics & Probability – Grade 11 Lecture Presentation
Sampling Distribution of Means
This type of
sampling is
frequently used
by Philippine
survey
companies like
SWS and Pulse
Asia.
Cluster or area sampling
Types of Sampling
CABT Statistics & Probability – Grade 11 Lecture Presentation
Sampling Distribution of Means
The difference between cluster sampling and
stratified sampling is that the sample consists of
elements from the selected clusters only, while in
stratified sampling, the sample comes from all the
strata.
Cluster vs stratified sampling
http://keydifferences.com/wp-content/uploads/2016/04/stratified-vs-cluster-sampling.jpg
CABT Statistics & Probability – Grade 11 Lecture Presentation
Sampling Distribution of Means
Your class would like to
interview 50 Junior High
School students to
determine their opinion
regarding the new school
ID. Explain how you can
choose your samples using
each of the sampling
techniques discussed.
Check your
understanding
https://boonesunriserotary.files.wordpress.com/2016/05/interview.jpg
Do you have any
QUESTIONs?
Parameter & Statistic
CABT Statistics & Probability – Grade 11 Lecture Presentation
Sampling Distribution of Means
A parameter is a descriptive
measure that describes a
population.A statistic is a descriptive measure
that describes a sample.
Usually, parameters are denoted by lower-
case GREEK letters (e.g.  or ), while
statistics use lower-case ROMAN letter (e.g. x
and s).
Parameter & Statistic
CABT Statistics & Probability – Grade 11 Lecture Presentation
Sampling Distribution of Means
https://www.cliffsnotes.com/assets/267169.png
Parameter & Statistic
CABT Statistics & Probability – Grade 11 Lecture Presentation
Sampling Distribution of Means
Parameter or statistic?
1. All CABT Senior High School students
2. A selected group of CABT Senior High
School students
3. Average scores of Grade 10 NAT takers
nationwide
4. Average of NAT scores taken from a
group of Grade 10 students from CABT
CABT Statistics & Probability – Grade 11 Lecture Presentation
Sampling Distribution of Means
Determine if the given situation describes a
parameter or a statistic
Check your
understanding
1. A group of 20 high school students are
selected to join the Valenciana Festival.
2. Ten of the teachers in a SHS have Master’s
degrees.
3. The Philippine Senate has 24 senators.
4. CABT currently has 18 teachers.
5. Eight teachers in CABT are chosen to attend
a seminar.
Sampling Distributions
CABT Statistics & Probability – Grade 11 Lecture Presentation
Sampling Distribution of Means
A sampling distribution is a probability
distribution of all of the possible values of a
statistic for a given sample size selected from
a population.
http://labs.geog.uvic.ca/geog226/images/Lab3/img_samp_dist.gif
Sampling Distribution of the Mean
CABT Statistics & Probability – Grade 11 Lecture Presentation
Sampling Distribution of Means
A sampling distribution of
sample means is a frequency
distribution using the means
computed from all possible
random samples of a specific
size taken from a population.
The probability distribution of the sample
means is also called the sampling distribution
of the sample means, with the sample mean as
the random variable.
http://www.philender.com/courses/intro/notes2/sam.gif
Constructing Sampling Distributions of
Sample Means
CABT Statistics & Probability – Grade 11 Lecture Presentation
Sampling Distribution of Means
How to Construct a Sampling Distribution of
Sample Means from a Given Population
STEP 1 – Determine the number of
samples of size n from the population of
size N.
STEP 2 – List all the possible samples
and compute the mean of each sample.
STEP 3 – Construct a frequency
distribution of the sample means
obtained in Step 2.
STEP 4 – Construct the probability
Constructing Sampling Distributions of
Sample Means
CABT Statistics & Probability – Grade 11 Lecture Presentation
Sampling Distribution of Means
How to Construct a Sampling Distribution of
Sample Means from a Given Population
The number of samples of size n from the
population of size N are given as follows:
For sampling with
replacement:
For sampling without
replacement:
n
N
N n
C
Constructing Sampling Distributions of
Sample Means
CABT Statistics & Probability – Grade 11 Lecture Presentation
Sampling Distribution of Means
Consider a group of N = 4 people
with the following ages: 18, 20, 22,
24.
Consider samples of size
n = 2 from the group. If X is
the age of one person in
the group and X is the
average age of the two
people in a sample,
construct the sampling
distribution of X.
Constructing Sampling Distributions of
Sample Means
CABT Statistics & Probability – Grade 11 Lecture Presentation
Sampling Distribution of Means
Solution – sampling with replacement
Number of samples of size 2:
1st
2nd
Observation
Obs 18 20 22 24
18 18,18 18,20 18,22 18,24
20 20,18 20,20 20,22 20,24
22 22,18 22,20 22,22 22,24
24 24,18 24,20 24,22 24,24
1st 2nd Observation
Obs 18 20 22 24
18 18 19 20 21
20 19 20 21 22
22 20 21 22 23
24 21 22 23 24
The 16 samples of size 2 The 16 sample means
2
4 16
Constructing Sampling Distributions of
Sample Means
CABT Statistics & Probability – Grade 11 Lecture Presentation
Sampling Distribution of Means
Sample
Mean
Frequency Probability
18 1 1/16
19 2 1/8
20 3 3/16
21 4 1/4
22 3 3/16
23 2 1/8
24 1 1/16
TOTAL 16 1
X P(X)
18 1/16
19 1/8
20 3/16
21 1/4
22 3/16
23 1/8
24 1/16
Solution – sampling with replacement
Number of samples of size 2:
2
4 16
Constructing Sampling Distributions of
Sample Means
CABT Statistics & Probability – Grade 11 Lecture Presentation
Sampling Distribution of Means
Solution – sampling without
replacement
Number of samples of size 2:
4 2
6C 
Sample
Sample
Mean
18, 20 19
18, 22 20
18, 24 21
20, 22 21
20, 24 22
22, 24 23
Sample
Mean
Frequency Probability
19 1 1/6
20 1 1/6
21 2 1/3
22 1 1/6
23 1 1/6
TOTAL 6 1
Constructing Sampling Distributions of
Sample Means
CABT Statistics & Probability – Grade 11 Lecture Presentation
Sampling Distribution of Means
Solution – sampling without
replacement
Number of samples of size 2:
4 2
6C 
Sample
Mean
Frequency Probability
19 1 1/6
20 1 1/6
21 2 1/3
22 1 1/6
23 1 1/6
TOTAL 6 1
X P(X)
19 1/6
20 1/6
21 1/3
22 1/6
23 1/6
Constructing Sampling Distributions of
Sample Means
CABT Statistics & Probability – Grade 11 Lecture Presentation
Sampling Distribution of Means
Consider a population with
values
1, 2, 3.
a. List all possible samples of size 2
from the population if sampling is
with replacement.
b. Construct a sampling distribution of
the sample means for this
population.
Constructing Sampling Distributions of
Sample Means
CABT Statistics & Probability – Grade 11 Lecture Presentation
Sampling Distribution of Means
Consider a population with
values
2, 5, 7, 8.
a. List all possible samples of size 2
from the population if sampling is
without replacement.
b. Construct a sampling distribution of
the sample means for this
population.
Constructing Sampling Distributions of
Sample Means
CABT Statistics & Probability – Grade 11 Lecture Presentation
Sampling Distribution of Means
Consider a population with
values
1, 1, 2, 3, 4.
a. List all possible samples of size 3
from the population if sampling is
without replacement.
b. Construct a sampling distribution of
the sample means for this
population.
CABT Statistics & Probability – Grade 11 Lecture Presentation
Sampling Distribution of Means
Check your
understandingA group of students got the following
scores in a test: 6, 9, 12, 15, 18, and 21.
Consider sample scores of size 3 that can
be drawn without replacement from the
given scores.
a. List all the possible samples and the
corresponding means.
b. Construct the sampling distribution of
the sample means.
Do you have any
QUESTIONs?
CABT SHS Statistics & Probability - Sampling Distribution of Means
Thankyou!

More Related Content

What's hot (20)

PPTX
Mean, variance, and standard deviation of a Discrete Random Variable
Michael Ogoy
 
PPTX
EXPLORING-RANDOM-VARIABLES.pptx
Pauline Misty Panganiban
 
PPTX
Discrete and Continuous Random Variables
Cumberland County Schools
 
PPTX
Probability Distributions for Discrete Variables
getyourcheaton
 
PPT
Dividing Polynomials Slide Share
Kristen T
 
PPTX
Quadratic functions
Reynaldo San Juan
 
PPT
Rational functions
zozima
 
PPTX
7. the t distribution
ONE Virtual Services
 
PPTX
CABT SHS Statistics & Probability - Mean and Variance of Sampling Distributio...
Gilbert Joseph Abueg
 
DOCX
Detailed Lesson Plan on Measures of Variability of Grouped and Ungrouped Data
Junila Tejada
 
PPTX
LESSON 7 ILLUSTRATING RANDOM SAMPLING G11
MaamLyca
 
PPT
Permutation and combination
Sadia Zareen
 
PPTX
MEASURES OF POSITION
Hazel Charise Gonzales
 
PPTX
Rational function representation
rey castro
 
DOCX
mathematics 7
Mirasol Ralo
 
PPTX
Chapter 1 random variables and probability distributions
Antonio F. Balatar Jr.
 
PPT
Hyperbola
Hae Morgia
 
DOCX
Newly-EDITED-DLP-FINAL-DEMO-Quarter-4-Module_1_Measures-of-Central-Tendency-o...
JONASSIBAL
 
DOCX
Lesson Plan- Measures of Central tendency of Data
Elton John Embodo
 
PPTX
4.1-4.2 Sample Spaces and Probability
mlong24
 
Mean, variance, and standard deviation of a Discrete Random Variable
Michael Ogoy
 
EXPLORING-RANDOM-VARIABLES.pptx
Pauline Misty Panganiban
 
Discrete and Continuous Random Variables
Cumberland County Schools
 
Probability Distributions for Discrete Variables
getyourcheaton
 
Dividing Polynomials Slide Share
Kristen T
 
Quadratic functions
Reynaldo San Juan
 
Rational functions
zozima
 
7. the t distribution
ONE Virtual Services
 
CABT SHS Statistics & Probability - Mean and Variance of Sampling Distributio...
Gilbert Joseph Abueg
 
Detailed Lesson Plan on Measures of Variability of Grouped and Ungrouped Data
Junila Tejada
 
LESSON 7 ILLUSTRATING RANDOM SAMPLING G11
MaamLyca
 
Permutation and combination
Sadia Zareen
 
MEASURES OF POSITION
Hazel Charise Gonzales
 
Rational function representation
rey castro
 
mathematics 7
Mirasol Ralo
 
Chapter 1 random variables and probability distributions
Antonio F. Balatar Jr.
 
Hyperbola
Hae Morgia
 
Newly-EDITED-DLP-FINAL-DEMO-Quarter-4-Module_1_Measures-of-Central-Tendency-o...
JONASSIBAL
 
Lesson Plan- Measures of Central tendency of Data
Elton John Embodo
 
4.1-4.2 Sample Spaces and Probability
mlong24
 

Similar to CABT SHS Statistics & Probability - Sampling Distribution of Means (20)

PPTX
samplingdistributionofmeans- - Copy.pptx
MaricelBerana1
 
PPTX
STATISTICS AND PROBABILITY- ACTIVITY CH1
JohnLesterRomero
 
PPTX
SAMPLING DISTRIBUTION ppt..pptx
MarkJohnPedragetaMun
 
PDF
random Sampling-statistics and probability
Pauline Misty Panganiban
 
PDF
Pink-Cute-Simple-Group-Project-Presentation_20250106_123703_0000.pdf
bertudazoaleah
 
PPTX
grade 11 Statistics and probability Week 4.pptx
MeryAnnMAlday
 
PPTX
10-Sampling-Distribution-of-the-Sample-Means.pptx
dominicdaltoncaling2
 
PPTX
Teaching Strategy sampling strategy -.pptx
JoelynRubio1
 
PPT
STATISTIC and PROBABILITY Week 7 ppt.ppt
jayarvidor5
 
PPTX
-sampling-distribution-of-the-sample-mean-students-copy.pptx
baliwhaha
 
PPTX
CLASSROOM DEMONSTRATION FOR RANKING.pptx
ReymartSaladas1
 
PPTX
CH3L3 -Sampling Distribution of Means.pptx
JohnLesterRomero
 
PPTX
RANDOM SAMPLING METHODSME-SP-11-Q3-0501-PS.pptx
addyadlawan303
 
PPT
04013143010_J_15_MTk4MTA3MjkyMDA4MTIxMDAy.ppt
SunainiRofiah2
 
PPTX
Sampling Technique - Anish
Anish Kumar
 
PPTX
sampling technique
Anish Kumar
 
PPTX
SPTC 0501 Q3 FPF.pptxSPPTXSCGH122345116YT
JosephMuez2
 
PPTX
samplingandsamplingdistributions.pptxxxxxxxxx
AliceRivera13
 
PPTX
5 Introduction to elementary sampling theory.pptx
arafatibraim
 
PPT
Common sampling techniques
krizza joy dela cruz
 
samplingdistributionofmeans- - Copy.pptx
MaricelBerana1
 
STATISTICS AND PROBABILITY- ACTIVITY CH1
JohnLesterRomero
 
SAMPLING DISTRIBUTION ppt..pptx
MarkJohnPedragetaMun
 
random Sampling-statistics and probability
Pauline Misty Panganiban
 
Pink-Cute-Simple-Group-Project-Presentation_20250106_123703_0000.pdf
bertudazoaleah
 
grade 11 Statistics and probability Week 4.pptx
MeryAnnMAlday
 
10-Sampling-Distribution-of-the-Sample-Means.pptx
dominicdaltoncaling2
 
Teaching Strategy sampling strategy -.pptx
JoelynRubio1
 
STATISTIC and PROBABILITY Week 7 ppt.ppt
jayarvidor5
 
-sampling-distribution-of-the-sample-mean-students-copy.pptx
baliwhaha
 
CLASSROOM DEMONSTRATION FOR RANKING.pptx
ReymartSaladas1
 
CH3L3 -Sampling Distribution of Means.pptx
JohnLesterRomero
 
RANDOM SAMPLING METHODSME-SP-11-Q3-0501-PS.pptx
addyadlawan303
 
04013143010_J_15_MTk4MTA3MjkyMDA4MTIxMDAy.ppt
SunainiRofiah2
 
Sampling Technique - Anish
Anish Kumar
 
sampling technique
Anish Kumar
 
SPTC 0501 Q3 FPF.pptxSPPTXSCGH122345116YT
JosephMuez2
 
samplingandsamplingdistributions.pptxxxxxxxxx
AliceRivera13
 
5 Introduction to elementary sampling theory.pptx
arafatibraim
 
Common sampling techniques
krizza joy dela cruz
 
Ad

More from Gilbert Joseph Abueg (12)

PPTX
CABT SHS Statistics & Probability - The Standard Normal Distribution
Gilbert Joseph Abueg
 
PPTX
CABT SHS Statistics & Probability - Expected Value and Variance of Discrete P...
Gilbert Joseph Abueg
 
PPTX
CABT SHS Statistics & Probability - Estimation of Parameters (intro)
Gilbert Joseph Abueg
 
PPTX
CABT SHS Statistics & Probability - The z-scores and Problems involving Norma...
Gilbert Joseph Abueg
 
PPTX
Math 9 similar triangles intro
Gilbert Joseph Abueg
 
PPTX
Math 7 geometry 04 angles, parallel lines, and transversals - grade 7
Gilbert Joseph Abueg
 
PPTX
Math 7 geometry 03 angles and angle measurements
Gilbert Joseph Abueg
 
PPTX
Math 7 geometry 02 postulates and theorems on points, lines, and planes
Gilbert Joseph Abueg
 
PPTX
Math 7 geometry 01 undefined terms rev 2
Gilbert Joseph Abueg
 
PPTX
Math 7 inequalities and intervals
Gilbert Joseph Abueg
 
PPTX
VE-CL 9 and IV - All Saints' and All Souls' Day Mini Catechesis
Gilbert Joseph Abueg
 
DOCX
Ve cl 9 - long test 2 facts and reviewer
Gilbert Joseph Abueg
 
CABT SHS Statistics & Probability - The Standard Normal Distribution
Gilbert Joseph Abueg
 
CABT SHS Statistics & Probability - Expected Value and Variance of Discrete P...
Gilbert Joseph Abueg
 
CABT SHS Statistics & Probability - Estimation of Parameters (intro)
Gilbert Joseph Abueg
 
CABT SHS Statistics & Probability - The z-scores and Problems involving Norma...
Gilbert Joseph Abueg
 
Math 9 similar triangles intro
Gilbert Joseph Abueg
 
Math 7 geometry 04 angles, parallel lines, and transversals - grade 7
Gilbert Joseph Abueg
 
Math 7 geometry 03 angles and angle measurements
Gilbert Joseph Abueg
 
Math 7 geometry 02 postulates and theorems on points, lines, and planes
Gilbert Joseph Abueg
 
Math 7 geometry 01 undefined terms rev 2
Gilbert Joseph Abueg
 
Math 7 inequalities and intervals
Gilbert Joseph Abueg
 
VE-CL 9 and IV - All Saints' and All Souls' Day Mini Catechesis
Gilbert Joseph Abueg
 
Ve cl 9 - long test 2 facts and reviewer
Gilbert Joseph Abueg
 
Ad

Recently uploaded (20)

PPTX
PYLORIC STENOSIS: NURSING MANAGEMENT.pptx
PRADEEP ABOTHU
 
PPTX
Views on Education of Indian Thinkers J.Krishnamurthy..pptx
ShrutiMahanta1
 
PPTX
HEAD INJURY IN CHILDREN: NURSING MANAGEMENGT.pptx
PRADEEP ABOTHU
 
PPTX
THE HUMAN INTEGUMENTARY SYSTEM#MLT#BCRAPC.pptx
Subham Panja
 
PPTX
Accounting Skills Paper-I, Preparation of Vouchers
Dr. Sushil Bansode
 
PDF
IMP NAAC REFORMS 2024 - 10 Attributes.pdf
BHARTIWADEKAR
 
PPTX
Blanket Order in Odoo 17 Purchase App - Odoo Slides
Celine George
 
PPTX
Optimizing Cancer Screening With MCED Technologies: From Science to Practical...
i3 Health
 
PDF
IMP NAAC-Reforms-Stakeholder-Consultation-Presentation-on-Draft-Metrics-Unive...
BHARTIWADEKAR
 
PPTX
How to Configure Prepayments in Odoo 18 Sales
Celine George
 
PPTX
LEGAL ASPECTS OF PSYCHIATRUC NURSING.pptx
PoojaSen20
 
PPTX
nutriquiz grade 4.pptx...............................................
ferdinandsanbuenaven
 
PPTX
CLEFT LIP AND PALATE: NURSING MANAGEMENT.pptx
PRADEEP ABOTHU
 
PDF
Comprehensive Guide to Writing Effective Literature Reviews for Academic Publ...
AJAYI SAMUEL
 
PPTX
Optimizing Cancer Screening With MCED Technologies: From Science to Practical...
i3 Health
 
PPTX
Capitol Doctoral Presentation -July 2025.pptx
CapitolTechU
 
PPTX
How to Configure Access Rights of Manufacturing Orders in Odoo 18 Manufacturing
Celine George
 
PPSX
Health Planning in india - Unit 03 - CHN 2 - GNM 3RD YEAR.ppsx
Priyanshu Anand
 
PDF
Ziehl-Neelsen Stain: Principle, Procedu.
PRASHANT YADAV
 
PDF
Zoology (Animal Physiology) practical Manual
raviralanaresh2
 
PYLORIC STENOSIS: NURSING MANAGEMENT.pptx
PRADEEP ABOTHU
 
Views on Education of Indian Thinkers J.Krishnamurthy..pptx
ShrutiMahanta1
 
HEAD INJURY IN CHILDREN: NURSING MANAGEMENGT.pptx
PRADEEP ABOTHU
 
THE HUMAN INTEGUMENTARY SYSTEM#MLT#BCRAPC.pptx
Subham Panja
 
Accounting Skills Paper-I, Preparation of Vouchers
Dr. Sushil Bansode
 
IMP NAAC REFORMS 2024 - 10 Attributes.pdf
BHARTIWADEKAR
 
Blanket Order in Odoo 17 Purchase App - Odoo Slides
Celine George
 
Optimizing Cancer Screening With MCED Technologies: From Science to Practical...
i3 Health
 
IMP NAAC-Reforms-Stakeholder-Consultation-Presentation-on-Draft-Metrics-Unive...
BHARTIWADEKAR
 
How to Configure Prepayments in Odoo 18 Sales
Celine George
 
LEGAL ASPECTS OF PSYCHIATRUC NURSING.pptx
PoojaSen20
 
nutriquiz grade 4.pptx...............................................
ferdinandsanbuenaven
 
CLEFT LIP AND PALATE: NURSING MANAGEMENT.pptx
PRADEEP ABOTHU
 
Comprehensive Guide to Writing Effective Literature Reviews for Academic Publ...
AJAYI SAMUEL
 
Optimizing Cancer Screening With MCED Technologies: From Science to Practical...
i3 Health
 
Capitol Doctoral Presentation -July 2025.pptx
CapitolTechU
 
How to Configure Access Rights of Manufacturing Orders in Odoo 18 Manufacturing
Celine George
 
Health Planning in india - Unit 03 - CHN 2 - GNM 3RD YEAR.ppsx
Priyanshu Anand
 
Ziehl-Neelsen Stain: Principle, Procedu.
PRASHANT YADAV
 
Zoology (Animal Physiology) practical Manual
raviralanaresh2
 

CABT SHS Statistics & Probability - Sampling Distribution of Means

  • 1. CABT Statistics & Probability – Grade 11 Lecture Presentation
  • 3. Sampling Distribution of Means A Grade 11 Statistics and Probability Lecture
  • 4. Population and Sample CABT Statistics & Probability – Grade 11 Lecture Presentation Sampling Distribution of Means A population is the set of all items or individuals of interest. Examples: All registered voters Cell phones manufactured today Sales receipts for August A sample is a subset of the population. Examples: 1200 voters selected at random for a survey A few cell phones selected for testing Random receipts selected for audit
  • 5. Inferential Statistics CABT Statistics & Probability – Grade 11 Lecture Presentation Sampling Distribution of Means Inferential statistics is concerned with drawing conclusions and/or making decisions concerning a population based only on sample data. http://www.gohomeworkhelp.com/admin/photos/what-is-inferential-statistics.jpg
  • 7. ...by selecting a representative sample from the population
  • 8. Why Sample?! CABT Statistics & Probability – Grade 11 Lecture Presentation Sampling Distribution of Means  Researchers use sampling if taking a census of the entire population is impractical.  It is less time-consuming and less costly than a census.  It is possible that data from the sample can be used to estimate corresponding population measures.
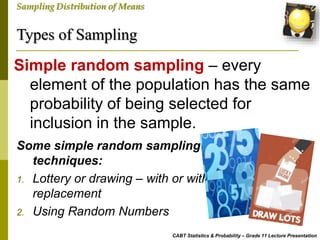
  • 9. Types of Sampling CABT Statistics & Probability – Grade 11 Lecture Presentation Sampling Distribution of Means Simple random sampling – every element of the population has the same probability of being selected for inclusion in the sample. Some simple random sampling techniques: 1. Lottery or drawing – with or without replacement 2. Using Random Numbers
  • 10. Types of Sampling CABT Statistics & Probability – Grade 11 Lecture Presentation Sampling Distribution of Means Simple random sampling and Slovin’s FormulaSlovin’s Formula is a formula used to determine the sample size n from a population of size N and margin of error e is given by:   2 1 N n Ne Example: The number of samples needed for a population of 1,000 at a margin of error of 5% is    2 1000 286 1 1000 0.05 n   
  • 11. Types of Sampling CABT Statistics & Probability – Grade 11 Lecture Presentation Sampling Distribution of Means – a list of randomly-arranged elements of the population is used as a sampling frame, and the elements to be included in the sample are selected by skipping through the list at regular intervals. Systematic random sampling http://worldartsme.com/images/holiday-shopping-list-clipart-1.jpg
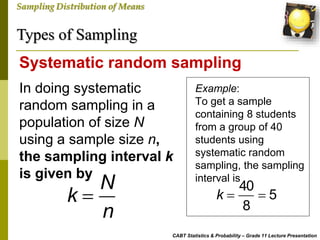
  • 12. Types of Sampling CABT Statistics & Probability – Grade 11 Lecture Presentation Sampling Distribution of Means In doing systematic random sampling in a population of size N using a sample size n, the sampling interval k is given by Systematic random sampling N k n  Example: To get a sample containing 8 students from a group of 40 students using systematic random sampling, the sampling interval is 40 5 8 k  
  • 13. CABT Statistics & Probability – Grade 11 Lecture Presentation Sampling Distribution of Means http://users.hist.umn.edu/~ruggles/hist5011/sampling.ppt
  • 14. Types of Sampling CABT Statistics & Probability – Grade 11 Lecture Presentation Sampling Distribution of Means – the population is partitioned into several subgroups or strata, then samples are randomly selected separately from each stratum Stratified random sampling https://faculty.elgin.edu/dkernler/statistics/ch01/images/strata-sample.gif
  • 15. Types of Sampling CABT Statistics & Probability – Grade 11 Lecture Presentation Sampling Distribution of Means Proportional allocation of sample size Stratified random sampling Population Strata Number of Students per Strata No. of Samples per Strata Male 340 20 Female 500 30 TOTAL 840 50 340 50 20.24 20 840 males    500 50 29.76 30 840 females    Allocation of samples per stratum: Suppose that a sample of size 50 is to be obtained from a population of 840 students grouped according to gender:
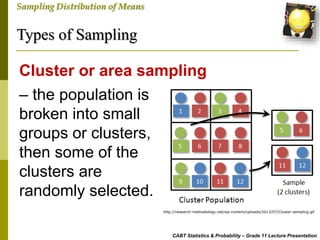
  • 16. Types of Sampling CABT Statistics & Probability – Grade 11 Lecture Presentation Sampling Distribution of Means – the population is broken into small groups or clusters, then some of the clusters are randomly selected. Cluster or area sampling http://research-methodology.net/wp-content/uploads/2013/07/Cluster-sampling.gif
  • 17. Types of Sampling CABT Statistics & Probability – Grade 11 Lecture Presentation Sampling Distribution of Means This type of sampling is frequently used by Philippine survey companies like SWS and Pulse Asia. Cluster or area sampling
  • 18. Types of Sampling CABT Statistics & Probability – Grade 11 Lecture Presentation Sampling Distribution of Means The difference between cluster sampling and stratified sampling is that the sample consists of elements from the selected clusters only, while in stratified sampling, the sample comes from all the strata. Cluster vs stratified sampling http://keydifferences.com/wp-content/uploads/2016/04/stratified-vs-cluster-sampling.jpg
  • 19. CABT Statistics & Probability – Grade 11 Lecture Presentation Sampling Distribution of Means Your class would like to interview 50 Junior High School students to determine their opinion regarding the new school ID. Explain how you can choose your samples using each of the sampling techniques discussed. Check your understanding https://boonesunriserotary.files.wordpress.com/2016/05/interview.jpg
  • 20. Do you have any QUESTIONs?
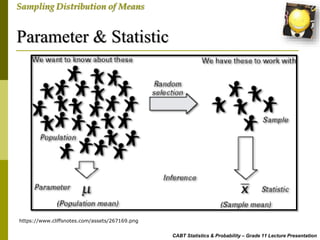
  • 21. Parameter & Statistic CABT Statistics & Probability – Grade 11 Lecture Presentation Sampling Distribution of Means A parameter is a descriptive measure that describes a population.A statistic is a descriptive measure that describes a sample. Usually, parameters are denoted by lower- case GREEK letters (e.g.  or ), while statistics use lower-case ROMAN letter (e.g. x and s).
  • 22. Parameter & Statistic CABT Statistics & Probability – Grade 11 Lecture Presentation Sampling Distribution of Means https://www.cliffsnotes.com/assets/267169.png
  • 23. Parameter & Statistic CABT Statistics & Probability – Grade 11 Lecture Presentation Sampling Distribution of Means Parameter or statistic? 1. All CABT Senior High School students 2. A selected group of CABT Senior High School students 3. Average scores of Grade 10 NAT takers nationwide 4. Average of NAT scores taken from a group of Grade 10 students from CABT
  • 24. CABT Statistics & Probability – Grade 11 Lecture Presentation Sampling Distribution of Means Determine if the given situation describes a parameter or a statistic Check your understanding 1. A group of 20 high school students are selected to join the Valenciana Festival. 2. Ten of the teachers in a SHS have Master’s degrees. 3. The Philippine Senate has 24 senators. 4. CABT currently has 18 teachers. 5. Eight teachers in CABT are chosen to attend a seminar.
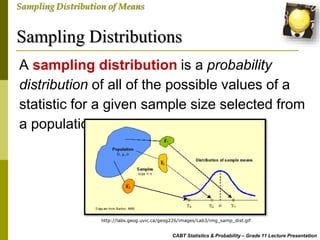
  • 25. Sampling Distributions CABT Statistics & Probability – Grade 11 Lecture Presentation Sampling Distribution of Means A sampling distribution is a probability distribution of all of the possible values of a statistic for a given sample size selected from a population. http://labs.geog.uvic.ca/geog226/images/Lab3/img_samp_dist.gif
  • 26. Sampling Distribution of the Mean CABT Statistics & Probability – Grade 11 Lecture Presentation Sampling Distribution of Means A sampling distribution of sample means is a frequency distribution using the means computed from all possible random samples of a specific size taken from a population. The probability distribution of the sample means is also called the sampling distribution of the sample means, with the sample mean as the random variable. http://www.philender.com/courses/intro/notes2/sam.gif
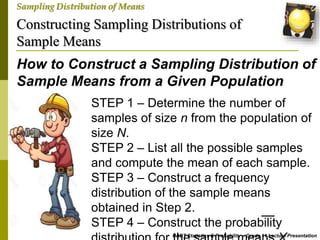
  • 27. Constructing Sampling Distributions of Sample Means CABT Statistics & Probability – Grade 11 Lecture Presentation Sampling Distribution of Means How to Construct a Sampling Distribution of Sample Means from a Given Population STEP 1 – Determine the number of samples of size n from the population of size N. STEP 2 – List all the possible samples and compute the mean of each sample. STEP 3 – Construct a frequency distribution of the sample means obtained in Step 2. STEP 4 – Construct the probability
  • 28. Constructing Sampling Distributions of Sample Means CABT Statistics & Probability – Grade 11 Lecture Presentation Sampling Distribution of Means How to Construct a Sampling Distribution of Sample Means from a Given Population The number of samples of size n from the population of size N are given as follows: For sampling with replacement: For sampling without replacement: n N N n C
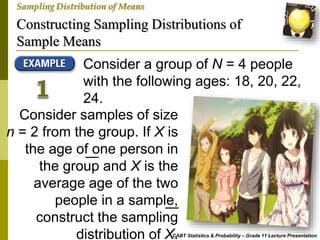
  • 29. Constructing Sampling Distributions of Sample Means CABT Statistics & Probability – Grade 11 Lecture Presentation Sampling Distribution of Means Consider a group of N = 4 people with the following ages: 18, 20, 22, 24. Consider samples of size n = 2 from the group. If X is the age of one person in the group and X is the average age of the two people in a sample, construct the sampling distribution of X.
  • 30. Constructing Sampling Distributions of Sample Means CABT Statistics & Probability – Grade 11 Lecture Presentation Sampling Distribution of Means Solution – sampling with replacement Number of samples of size 2: 1st 2nd Observation Obs 18 20 22 24 18 18,18 18,20 18,22 18,24 20 20,18 20,20 20,22 20,24 22 22,18 22,20 22,22 22,24 24 24,18 24,20 24,22 24,24 1st 2nd Observation Obs 18 20 22 24 18 18 19 20 21 20 19 20 21 22 22 20 21 22 23 24 21 22 23 24 The 16 samples of size 2 The 16 sample means 2 4 16
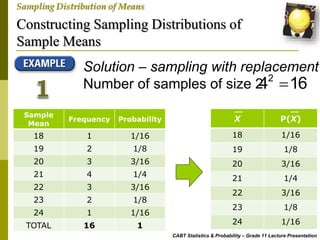
  • 31. Constructing Sampling Distributions of Sample Means CABT Statistics & Probability – Grade 11 Lecture Presentation Sampling Distribution of Means Sample Mean Frequency Probability 18 1 1/16 19 2 1/8 20 3 3/16 21 4 1/4 22 3 3/16 23 2 1/8 24 1 1/16 TOTAL 16 1 X P(X) 18 1/16 19 1/8 20 3/16 21 1/4 22 3/16 23 1/8 24 1/16 Solution – sampling with replacement Number of samples of size 2: 2 4 16
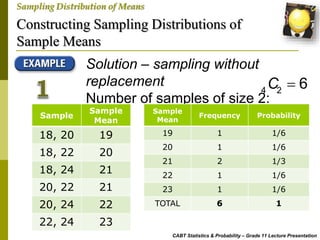
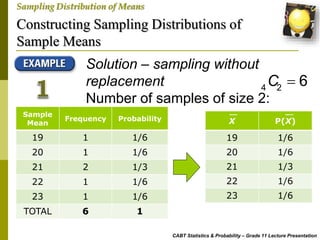
  • 32. Constructing Sampling Distributions of Sample Means CABT Statistics & Probability – Grade 11 Lecture Presentation Sampling Distribution of Means Solution – sampling without replacement Number of samples of size 2: 4 2 6C  Sample Sample Mean 18, 20 19 18, 22 20 18, 24 21 20, 22 21 20, 24 22 22, 24 23 Sample Mean Frequency Probability 19 1 1/6 20 1 1/6 21 2 1/3 22 1 1/6 23 1 1/6 TOTAL 6 1
  • 33. Constructing Sampling Distributions of Sample Means CABT Statistics & Probability – Grade 11 Lecture Presentation Sampling Distribution of Means Solution – sampling without replacement Number of samples of size 2: 4 2 6C  Sample Mean Frequency Probability 19 1 1/6 20 1 1/6 21 2 1/3 22 1 1/6 23 1 1/6 TOTAL 6 1 X P(X) 19 1/6 20 1/6 21 1/3 22 1/6 23 1/6
  • 34. Constructing Sampling Distributions of Sample Means CABT Statistics & Probability – Grade 11 Lecture Presentation Sampling Distribution of Means Consider a population with values 1, 2, 3. a. List all possible samples of size 2 from the population if sampling is with replacement. b. Construct a sampling distribution of the sample means for this population.
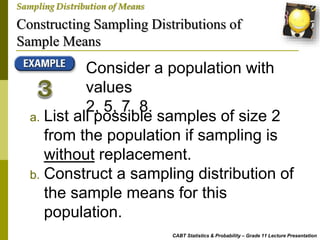
  • 35. Constructing Sampling Distributions of Sample Means CABT Statistics & Probability – Grade 11 Lecture Presentation Sampling Distribution of Means Consider a population with values 2, 5, 7, 8. a. List all possible samples of size 2 from the population if sampling is without replacement. b. Construct a sampling distribution of the sample means for this population.
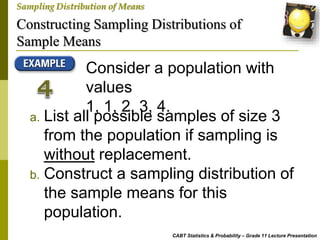
  • 36. Constructing Sampling Distributions of Sample Means CABT Statistics & Probability – Grade 11 Lecture Presentation Sampling Distribution of Means Consider a population with values 1, 1, 2, 3, 4. a. List all possible samples of size 3 from the population if sampling is without replacement. b. Construct a sampling distribution of the sample means for this population.
  • 37. CABT Statistics & Probability – Grade 11 Lecture Presentation Sampling Distribution of Means Check your understandingA group of students got the following scores in a test: 6, 9, 12, 15, 18, and 21. Consider sample scores of size 3 that can be drawn without replacement from the given scores. a. List all the possible samples and the corresponding means. b. Construct the sampling distribution of the sample means.
  • 38. Do you have any QUESTIONs?