SlideShare a Scribd company logo
Business
Statistics
Saadiq F Hassan
Introduction
Statistics is concerned with scientific method of collecting,
organizing, analyzing, summarizing and presenting data, so
as to comprehend the essential features and relationship
of the data.
It can be defined as “the study of the methods of collecting
and analysis of data to draw a helpful conclusion.
Major steps in statistical analysis are;
• Data collection
• Data Organization
• Data analysis
• Data presentation and interpretation of data,
• Drawing of inferences body of data when
only a small part of the data is observed.
Importance of Statistics
Discover knowledge
Base for decision making
Understand circumstances
Support ideas and arguments etc
Business Statistics
Business Statistics -Statistics
is the study of how to collect,
organizes, analyze, and interpret
numerical information from data.
Business statistics is statistics
as applied to the Business and
economic.
Uses of Business Statistics
Provide methods of organizing information
Assessment of market status
Commercial program evaluation
Resource allocation
Magnitude of association (Strong vs. weak association between
cause and effect)
Role of Statisticians in Business
Guide the design of an experiment
Guide the design of prior to data collection
Decide which information to gather
Analyze data using proper statistical procedures
Make the best summary
Present and interpret the results for decision making
Types of Business statistics
Generally, there are two major types of
business statistics which are;
Descriptive
statistics
Inferential
Statistics
Descriptive Statistics
Descriptive statistics is involves the collection,
organization, summarization and presentation of data
in order to describe the various facts about the data
This describes and summarizes the data through tables
or charts in order to bring out the important facts
about the data
Descriptive statistics
• mean, median, mode and
percentages.
Descriptive
statistics
include;
• Demographic characteristics
• Vital statistics; birth, death,
diseases etc.
• Frequency
Always it is
used for;
Inferential Statistics
Inferential statistical involves studying only a part of the
population in order to draw conclusions on the population
based on the analysis of the sample data.
Inferential statistics is to make an inference about a
population based on the information contained in the
sample.
Inferential Statistics
Inferential statistics are used for;
Hypothesis Testing
Determining Relationships among
Variables
Making Predictions
Characteristics of Inferential Statistics
Uses samples from larger populations
Draw conclusions from sample data
Conclusions apply to whole population
Estimate a population value
Test a hypothesis
State probability of error
Population and Sample
Population:
 Population refers to any collection of objects.
 Collection of items that have something shared or
common and we wish to draw conclusions at a particular
time
E.g., All hospitals, all hotels, all students, all pregnant
women, all health worker.
Population and Sample
Sample
 Sample refers to a portion or part of the population of
interest
 Sample is a single item that was selected from the whole
population or representative part from population
E.g., 100 health workers selected from all health workers,
10 hotels selected from all hospital, 100 students selected
to represent all the students
Sampling Methods
Sampling methods can be;
Probability
Sampling
Non-probability
sampling
Samples cannot be selected in messy ways because the
information obtained might be biased.
There are two methods for sampling
Probability Sampling
Statisticians use four basic
methods of sampling
Random
Sampling
Systematic
Sampling
Stratified
Sampling
Clustering
Sampling
A sample is said to be Probability Sampling if every
person have equal chance of being selected.
Random sampling
Also known as simple random sampling; is to select sample
by using chance methods or random numbers.
For example; number each subject in the population. Then
place numbered cards in a bowl, mix them thoroughly, and
select as many cards as needed
Systematic Sampling
Researchers obtain systematic samples by numbering each
subject of the population and then selecting every Kth
subject.
For example, suppose there were 11 employees in the
population and a sample of 4 employees were needed. Since
11 /4 = 2.75 = almost 3, then k=3, and every 3rd subject
would be selected
the first subject is selected at random
Stratified Samples
Stratified sampling is by dividing the
population into groups (called strata)
according to some characteristic that
is important to the study, then
sampling from each group.
Samples within the strata should be
randomly selected.
Cluster Sampling
Here the population is divided into groups called clusters
by some means such as geographic area or schools in a
large school district, etc.
Then the researcher randomly selects some of these
clusters and uses all members of the selected clusters as
the subjects of the samples
chapter one business mathematical statistics.pptx
Non-probability Sampling
Non-probability sampling
can be divided into;
Four
Judgment
Sampling
Quota
Sampling
Convenience
Sampling
Multistage
Sampling
Snowball
Sampling
A sample is said to be non-probability sampling if every
person does not have equal chance of being selected
Judgment Sampling
A sample is said to be judgment sample when it is selected
deliberately by the researcher by taking some factors into
consideration.
This technique is useful only when dealing with small
populations
Quota Sampling
In quota sampling, the population is subdivided into
heterogeneous parts and judgment sub samples are
taken from each part in percentage proportion of the
parts in the population
Convenience Sampling
A convenience sampling is simply uses results or data
that are conveniently and readily obtained.
Convenience sample is obtained by selecting
convenient population units
Multistage Sampling
The sample can sometimes be selected using many stages
instead of selecting all at the first stage.
 At the first stage, the units are sampled by suitable
method
 Second stage, units is selected from each of the selected
first stage units
 Further stages may be added as required
Snowball Sampling
is a non-probability method of recruiting participants by
referrals from existing ones.
Snowball sampling can be a useful way to conduct research
about people with specific traits who might otherwise be
difficult to identify (e.g., people with a rare disease).
Parameter & Statistic
• Parameter is a descriptive measure
computed from the data of a
population or numerical
characteristics of given population.
Parameter:
• Population size (N)
• Population mean (μ)
• population Variance
• Population standard deviation
Population
characteristics
include
Parameter & Statistic
• Statistic is a descriptive measure
computed from the data of a sample
or Numerical characteristics of
sample
Statistic:
• Sample size
• Sample mean
• Sample Variance
• Sample standard deviation
Sample
characteristics
include
chapter one business mathematical statistics.pptx

More Related Content

Similar to chapter one business mathematical statistics.pptx (20)

PPTX
chapter-2 Elementary Sampling Theory.pptx
PeterineGiselleMarco
 
PPTX
chapter 1.pptx
ObsaHassanMohamed
 
PPTX
Introduction to Statistics (Part -I)
YesAnalytics
 
PPTX
BASIC CONCEPTS in STAT 1 [Autosaved].pptx
JhunafilRas2
 
PPTX
BIOSTATISTICS - Data, Types of Data, and collection of data
Gayathri M
 
PPTX
Statistics and prob.
Emmanuel Alimpolos
 
PDF
STATISTICS-E.pdf
ssuser86252c
 
PPTX
Biostatistics
anju mathew
 
PPTX
research methodolkglhxhlxohxohxoyxphxogy.pptx
JayeshTaneja4
 
DOCX
Introduction to statistics
elinkssolutionscom
 
PPT
A basic Introduction To Statistics with examples
ShibsekharRoy1
 
PPTX
POPULATION.pptx
SreeLatha98
 
PPTX
Population & sample lecture 04
DrZahid Khan
 
PDF
Statistics for Data Analytics
SSaudia
 
PPTX
Introduction to Statistics
MoonWeryah
 
PPTX
research methodology and biostatistics.pptx
DOMINOLIFE
 
PPTX
Sample & data collection method,sample size estimation,variables
BipulBorthakur
 
PPTX
Presentation of BRM.pptx
Gãurãv Kúmàr
 
PPT
Biostatics in orthodontics - kkKiran.ppt
ARATHY91
 
PPTX
Biostatistics Collection of Data and Sampling Techniques SMG.pptx
sajigeorge64
 
chapter-2 Elementary Sampling Theory.pptx
PeterineGiselleMarco
 
chapter 1.pptx
ObsaHassanMohamed
 
Introduction to Statistics (Part -I)
YesAnalytics
 
BASIC CONCEPTS in STAT 1 [Autosaved].pptx
JhunafilRas2
 
BIOSTATISTICS - Data, Types of Data, and collection of data
Gayathri M
 
Statistics and prob.
Emmanuel Alimpolos
 
STATISTICS-E.pdf
ssuser86252c
 
Biostatistics
anju mathew
 
research methodolkglhxhlxohxohxoyxphxogy.pptx
JayeshTaneja4
 
Introduction to statistics
elinkssolutionscom
 
A basic Introduction To Statistics with examples
ShibsekharRoy1
 
POPULATION.pptx
SreeLatha98
 
Population & sample lecture 04
DrZahid Khan
 
Statistics for Data Analytics
SSaudia
 
Introduction to Statistics
MoonWeryah
 
research methodology and biostatistics.pptx
DOMINOLIFE
 
Sample & data collection method,sample size estimation,variables
BipulBorthakur
 
Presentation of BRM.pptx
Gãurãv Kúmàr
 
Biostatics in orthodontics - kkKiran.ppt
ARATHY91
 
Biostatistics Collection of Data and Sampling Techniques SMG.pptx
sajigeorge64
 

More from sadiqfarhan2 (20)

PPTX
elasticity manaerial four ecobnomics.pptx
sadiqfarhan2
 
PPT
Chap004managerial ecobomy labor resources.ppt
sadiqfarhan2
 
PPTX
Chap006 factors of porduction land labor occu.pptx
sadiqfarhan2
 
PDF
Annual-Trade-Statistical-Bulletin-2022-F-1.pdf
sadiqfarhan2
 
PPT
Chapter_04lfadjfhadfodlfkladsflhsdlflasdjfkl.ppt
sadiqfarhan2
 
PPTX
chaptercost. Project hdhdhjdheudb_7_0.pptx
sadiqfarhan2
 
PPT
TOT on Enterpreneurship for University lecturers DAY 1.ppt
sadiqfarhan2
 
PPTX
thesis lecturejgjgjhgjgjhjkhjkhjkhkjhjkhjk.pptx
sadiqfarhan2
 
PPTX
Ten Principles of Economics introdctin to .pptx
sadiqfarhan2
 
PPTX
Economic environmenthhhhheuuejdjdjdurjruruu
sadiqfarhan2
 
PPTX
chapter-1.pptx
sadiqfarhan2
 
PPTX
Business Plan - Copy.pptx
sadiqfarhan2
 
PPTX
production-180404033805 (1).pptx
sadiqfarhan2
 
PPTX
forms of business ownership.pptx
sadiqfarhan2
 
PPTX
Bank risk Management-1.pptx
sadiqfarhan2
 
PPTX
Poverty - Vivi.pptx
sadiqfarhan2
 
PPTX
bankriskmanagement-150329124901-conversion-gate01.pptx
sadiqfarhan2
 
PPTX
monetarypolicy-140504092519-phpapp02 (1).pptx
sadiqfarhan2
 
PPTX
Monetary policy.pptx
sadiqfarhan2
 
PPTX
Resource Mobilization.pptx
sadiqfarhan2
 
elasticity manaerial four ecobnomics.pptx
sadiqfarhan2
 
Chap004managerial ecobomy labor resources.ppt
sadiqfarhan2
 
Chap006 factors of porduction land labor occu.pptx
sadiqfarhan2
 
Annual-Trade-Statistical-Bulletin-2022-F-1.pdf
sadiqfarhan2
 
Chapter_04lfadjfhadfodlfkladsflhsdlflasdjfkl.ppt
sadiqfarhan2
 
chaptercost. Project hdhdhjdheudb_7_0.pptx
sadiqfarhan2
 
TOT on Enterpreneurship for University lecturers DAY 1.ppt
sadiqfarhan2
 
thesis lecturejgjgjhgjgjhjkhjkhjkhkjhjkhjk.pptx
sadiqfarhan2
 
Ten Principles of Economics introdctin to .pptx
sadiqfarhan2
 
Economic environmenthhhhheuuejdjdjdurjruruu
sadiqfarhan2
 
chapter-1.pptx
sadiqfarhan2
 
Business Plan - Copy.pptx
sadiqfarhan2
 
production-180404033805 (1).pptx
sadiqfarhan2
 
forms of business ownership.pptx
sadiqfarhan2
 
Bank risk Management-1.pptx
sadiqfarhan2
 
Poverty - Vivi.pptx
sadiqfarhan2
 
bankriskmanagement-150329124901-conversion-gate01.pptx
sadiqfarhan2
 
monetarypolicy-140504092519-phpapp02 (1).pptx
sadiqfarhan2
 
Monetary policy.pptx
sadiqfarhan2
 
Resource Mobilization.pptx
sadiqfarhan2
 
Ad

Recently uploaded (20)

PPTX
ROYALTY PPTdownlad. Ffggfffgbfghggd .pptx
govindkorgaonkar21
 
PDF
Asia’s Most Influential Hospital CEOs: The Leaders Transforming Healthcare Ac...
Gorman Bain Capital
 
PDF
7 Hidden Risks of Ignoring Payroll Compliance in 2025.pdf
RAJ KISHAN CPA INC.
 
PDF
Tran Quoc Bao - The CFA Powering Asia’s Healthcare Revolution
Gorman Bain Capital
 
PPTX
Power BI Dashboard Design Core Principles of Effective Data Visualization.pptx
360factors
 
PPTX
Role of Capital Allocation as part of assessing Asset Management
PaulYoung221210
 
PPTX
Why Indians Are Shifting from Fixed Deposits to Mutual Funds
wenigo4302
 
PDF
Tran Quoc Bao named Asia’s Healthcare Powerhouse -The 10 Most Influential Hos...
Gorman Bain Capital
 
PPTX
7Cs_of_Communication_PresentatADGDAion.pptx
YuriWiispeiehebeoheb
 
PDF
The-future-of-retirement,pdf.pdf Thanks to Nest
Henry Tapper
 
PPTX
Training - What is Budgeting, Forecasting, and Planning
PaulYoung221210
 
PPTX
united states Presentation Debt crises 1st.pptx
marialabib40
 
PPTX
Global_Financial_Sectors_Presentation.pptx
yashasvisanskrityan11
 
PDF
The Man Who Turned a Hospital into a Healthcare Empire
Gorman Bain Capital
 
PDF
Chapter 2 Foundations Of AI in Finance.pdf
Templifyr
 
PPTX
Estate_Farming. ( live stock based livelihoods and their evolution)
sathwikselwyn2004
 
PPTX
Predict Customer Churn With AI Driven Analytics.pptx
360factors
 
PDF
Euler Finance Thesis - BlackRock $3B Buidl Fund
iashsingh
 
PPTX
Highlights of the Current Union Budget 2025-26.pptx
radhikaramesh14
 
PPTX
2025年新版Angers毕业完成信法国昂热大学硕士毕业证,Angers电子版成绩单
Taqyea
 
ROYALTY PPTdownlad. Ffggfffgbfghggd .pptx
govindkorgaonkar21
 
Asia’s Most Influential Hospital CEOs: The Leaders Transforming Healthcare Ac...
Gorman Bain Capital
 
7 Hidden Risks of Ignoring Payroll Compliance in 2025.pdf
RAJ KISHAN CPA INC.
 
Tran Quoc Bao - The CFA Powering Asia’s Healthcare Revolution
Gorman Bain Capital
 
Power BI Dashboard Design Core Principles of Effective Data Visualization.pptx
360factors
 
Role of Capital Allocation as part of assessing Asset Management
PaulYoung221210
 
Why Indians Are Shifting from Fixed Deposits to Mutual Funds
wenigo4302
 
Tran Quoc Bao named Asia’s Healthcare Powerhouse -The 10 Most Influential Hos...
Gorman Bain Capital
 
7Cs_of_Communication_PresentatADGDAion.pptx
YuriWiispeiehebeoheb
 
The-future-of-retirement,pdf.pdf Thanks to Nest
Henry Tapper
 
Training - What is Budgeting, Forecasting, and Planning
PaulYoung221210
 
united states Presentation Debt crises 1st.pptx
marialabib40
 
Global_Financial_Sectors_Presentation.pptx
yashasvisanskrityan11
 
The Man Who Turned a Hospital into a Healthcare Empire
Gorman Bain Capital
 
Chapter 2 Foundations Of AI in Finance.pdf
Templifyr
 
Estate_Farming. ( live stock based livelihoods and their evolution)
sathwikselwyn2004
 
Predict Customer Churn With AI Driven Analytics.pptx
360factors
 
Euler Finance Thesis - BlackRock $3B Buidl Fund
iashsingh
 
Highlights of the Current Union Budget 2025-26.pptx
radhikaramesh14
 
2025年新版Angers毕业完成信法国昂热大学硕士毕业证,Angers电子版成绩单
Taqyea
 
Ad

chapter one business mathematical statistics.pptx

  • 2. Introduction Statistics is concerned with scientific method of collecting, organizing, analyzing, summarizing and presenting data, so as to comprehend the essential features and relationship of the data. It can be defined as “the study of the methods of collecting and analysis of data to draw a helpful conclusion.
  • 3. Major steps in statistical analysis are; • Data collection • Data Organization • Data analysis • Data presentation and interpretation of data, • Drawing of inferences body of data when only a small part of the data is observed.
  • 4. Importance of Statistics Discover knowledge Base for decision making Understand circumstances Support ideas and arguments etc
  • 5. Business Statistics Business Statistics -Statistics is the study of how to collect, organizes, analyze, and interpret numerical information from data. Business statistics is statistics as applied to the Business and economic.
  • 6. Uses of Business Statistics Provide methods of organizing information Assessment of market status Commercial program evaluation Resource allocation Magnitude of association (Strong vs. weak association between cause and effect)
  • 7. Role of Statisticians in Business Guide the design of an experiment Guide the design of prior to data collection Decide which information to gather Analyze data using proper statistical procedures Make the best summary Present and interpret the results for decision making
  • 8. Types of Business statistics Generally, there are two major types of business statistics which are; Descriptive statistics Inferential Statistics
  • 9. Descriptive Statistics Descriptive statistics is involves the collection, organization, summarization and presentation of data in order to describe the various facts about the data This describes and summarizes the data through tables or charts in order to bring out the important facts about the data
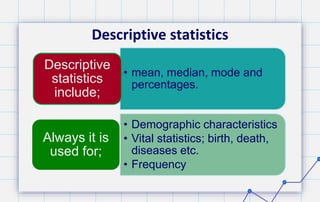
  • 10. Descriptive statistics • mean, median, mode and percentages. Descriptive statistics include; • Demographic characteristics • Vital statistics; birth, death, diseases etc. • Frequency Always it is used for;
  • 11. Inferential Statistics Inferential statistical involves studying only a part of the population in order to draw conclusions on the population based on the analysis of the sample data. Inferential statistics is to make an inference about a population based on the information contained in the sample.
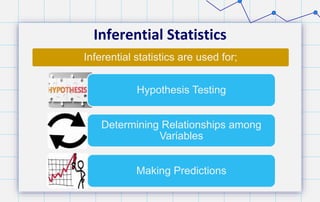
  • 12. Inferential Statistics Inferential statistics are used for; Hypothesis Testing Determining Relationships among Variables Making Predictions
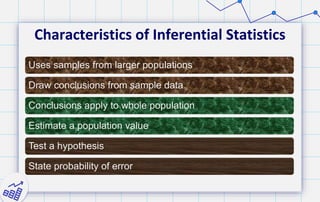
  • 13. Characteristics of Inferential Statistics Uses samples from larger populations Draw conclusions from sample data Conclusions apply to whole population Estimate a population value Test a hypothesis State probability of error
  • 14. Population and Sample Population:  Population refers to any collection of objects.  Collection of items that have something shared or common and we wish to draw conclusions at a particular time E.g., All hospitals, all hotels, all students, all pregnant women, all health worker.
  • 15. Population and Sample Sample  Sample refers to a portion or part of the population of interest  Sample is a single item that was selected from the whole population or representative part from population E.g., 100 health workers selected from all health workers, 10 hotels selected from all hospital, 100 students selected to represent all the students
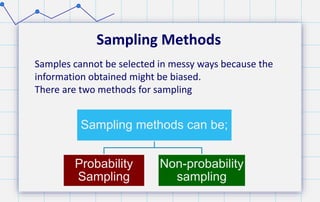
  • 16. Sampling Methods Sampling methods can be; Probability Sampling Non-probability sampling Samples cannot be selected in messy ways because the information obtained might be biased. There are two methods for sampling
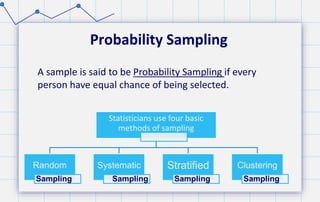
  • 17. Probability Sampling Statisticians use four basic methods of sampling Random Sampling Systematic Sampling Stratified Sampling Clustering Sampling A sample is said to be Probability Sampling if every person have equal chance of being selected.
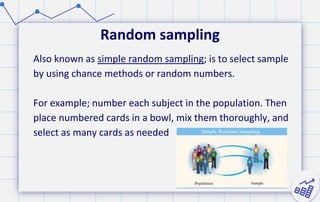
  • 18. Random sampling Also known as simple random sampling; is to select sample by using chance methods or random numbers. For example; number each subject in the population. Then place numbered cards in a bowl, mix them thoroughly, and select as many cards as needed
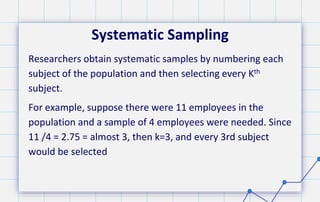
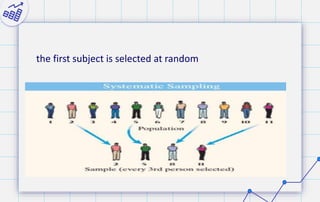
  • 19. Systematic Sampling Researchers obtain systematic samples by numbering each subject of the population and then selecting every Kth subject. For example, suppose there were 11 employees in the population and a sample of 4 employees were needed. Since 11 /4 = 2.75 = almost 3, then k=3, and every 3rd subject would be selected
  • 20. the first subject is selected at random
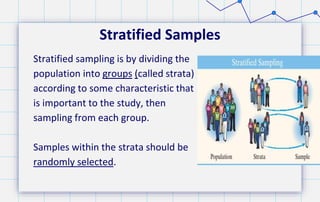
  • 21. Stratified Samples Stratified sampling is by dividing the population into groups (called strata) according to some characteristic that is important to the study, then sampling from each group. Samples within the strata should be randomly selected.
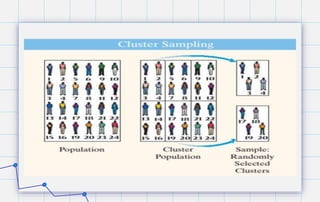
  • 22. Cluster Sampling Here the population is divided into groups called clusters by some means such as geographic area or schools in a large school district, etc. Then the researcher randomly selects some of these clusters and uses all members of the selected clusters as the subjects of the samples
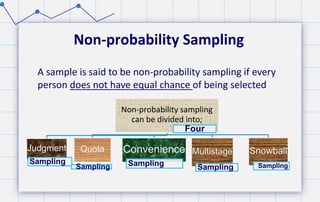
  • 24. Non-probability Sampling Non-probability sampling can be divided into; Four Judgment Sampling Quota Sampling Convenience Sampling Multistage Sampling Snowball Sampling A sample is said to be non-probability sampling if every person does not have equal chance of being selected
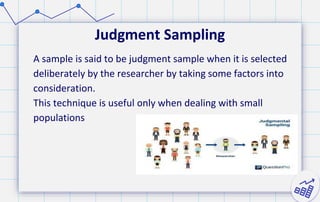
  • 25. Judgment Sampling A sample is said to be judgment sample when it is selected deliberately by the researcher by taking some factors into consideration. This technique is useful only when dealing with small populations
  • 26. Quota Sampling In quota sampling, the population is subdivided into heterogeneous parts and judgment sub samples are taken from each part in percentage proportion of the parts in the population
  • 27. Convenience Sampling A convenience sampling is simply uses results or data that are conveniently and readily obtained. Convenience sample is obtained by selecting convenient population units
  • 28. Multistage Sampling The sample can sometimes be selected using many stages instead of selecting all at the first stage.  At the first stage, the units are sampled by suitable method  Second stage, units is selected from each of the selected first stage units  Further stages may be added as required
  • 29. Snowball Sampling is a non-probability method of recruiting participants by referrals from existing ones. Snowball sampling can be a useful way to conduct research about people with specific traits who might otherwise be difficult to identify (e.g., people with a rare disease).
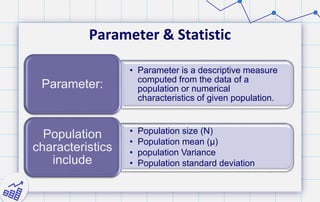
  • 30. Parameter & Statistic • Parameter is a descriptive measure computed from the data of a population or numerical characteristics of given population. Parameter: • Population size (N) • Population mean (μ) • population Variance • Population standard deviation Population characteristics include
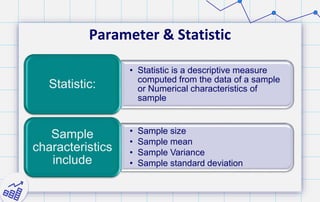
  • 31. Parameter & Statistic • Statistic is a descriptive measure computed from the data of a sample or Numerical characteristics of sample Statistic: • Sample size • Sample mean • Sample Variance • Sample standard deviation Sample characteristics include