SlideShare a Scribd company logo
3
Most read
4
Most read
5
Most read
DESCRIPTIVE STATISTICS
AND
INFERENTIAL STATISTICS
Prepared by: Danica A. Antiquina
“statistics
is a branch of applied mathematics
That deals with the collection,
organization, presentation, analysis,
and interpretation of data.”
2
Two major areas of statistics
✘ Descriptive Statistics
 It deals with the collection and presentation of
data and summarizing values that describe
the group’s characteristics.
✘ Inferential Statistics
 It deals with predictions and inferences based
on the analysis and interpretation of the
results of the information gathered by the
statistician.
3
Common Problems
✘ Descriptive Statistics
 What is the percentage of X, Y, and Z participants?
 What is the average monthly salary of the employees in Company A?
 How much students in SRCB are satisfied about the quality education it
provides?
✘ Inferential Statistics
 Is the claim true that the mean lifespan of the batter-operated toy cars is 5
years?
 Is the claim true that the student’s performance in Biology did not
improve?
 Is there a significant difference in the mean sales of the three candidates
for promotion?
4
✘ Descriptive Statistics
 You could make a bar chart of yes or no answers.
✘ Inferential Statistics
 You could use your research to reason that around 75-80% of the
population (all shoppers in all malls) like shopping at Prince
Hypermart.
5
Example:
You might stand in a mall and ask a sample of 100
people if they like shopping at Prince Hypermart.
DESCRIPTIVE
STATISTICS
It organize,
analyze, and
present data in a
meaningful way.
Differences Based on WHAT IT DOES?
INFERENTIAL
STATISTICS
Compares, test
and predicts
data.
6
DESCRIPTIVE STATISTICS
✘ Measures of Central Tendency
✘ Measures of Variation
Differences Based on tools
INFERENTIAL STATISTICS
✘ Hypothesis Testing
✘ Analysis of Variance
7
Measures of Central
Tendency:
Mean, median, mode
FORMULAS:
𝝁 =
𝒙
𝑵
𝒙 =
𝒙
𝒏
9
𝑴𝒅 = 𝒎𝒆𝒅𝒊𝒂𝒏
Measures of Variations:
range, variance,
standard deviation
FORMULAS:
𝑹 = 𝑯𝒊𝒈𝒉𝒆𝒔𝒕 𝒔𝒄𝒐𝒓𝒆 − 𝑳𝒐𝒘𝒆𝒔𝒕 𝒔𝒄𝒐𝒓𝒆
11
𝝈 = 𝜎𝑁
2
𝒔 = 𝑠𝑁−1
2
Hypothesis Testing:
Six steps
6 Steps in Hypothesis Testing
13
✘ Identify the Problem
✘ Formulate Null and Alternative Hypothesis
✘ Level of Significance
✘ Statistics
✘ Decision Rule
✘ Conclusion
14
15
DESCRIPTIVE
STATISTICS
Uses charts,
graphs, and
table.
Differences Based on form of final result
INFERENTIAL
STATISTICS
Uses probability.
16
Sampling Technique:
SLOVIN’S FORMULA
SLOVIN’S FORMULA
18
✘ If the population is very large, this formula will be used:
𝒏 =
𝑵
𝟏 + 𝑵𝒆𝟐
Where 𝑛 = sample size
𝑁 = number os cases
𝑒 = margin of error
Example: Using SLOVIN’S FORMULA
19
✘ A researcher wants to know the average income of the
families living in Barangay A which has 2,500 residents.
Calculate the sample size the researcher will need if a 5%
margin of error is allowed.
𝒏 =
𝟐, 𝟓𝟎𝟎
𝟏 + 𝟐, 𝟓𝟎𝟎 𝟎. 𝟎𝟓 𝟐 = 𝟑𝟒𝟒. 𝟖 ≈ 𝟑𝟒𝟓 𝒇𝒂𝒎𝒊𝒍𝒊𝒆𝒔
Where 𝑛 = sample size
𝑁 = 2,500
𝑒 = 0.05
20
THANKS!

More Related Content

What's hot (20)

PDF
Introduction to Statistics
Anjan Mahanta
 
PPSX
Inferential statistics.ppt
Nursing Path
 
PPTX
Type of data
Amit Sharma
 
PPTX
Types of random sampling
Studying
 
PPTX
Coefficient of variation
Nadeem Uddin
 
PPTX
Statistics in research
Balaji P
 
PPTX
What is statistics
Raj Teotia
 
PPTX
Introduction to Statistics (Part -I)
YesAnalytics
 
PPTX
Sampling techniques
Dr. Ankita Chaturvedi
 
PPTX
Types of graphs
LALIT BIST
 
PPTX
Introduction to statistics
madan kumar
 
PPTX
DATA PRESENTATION METHODS - 1.pptx
vineetarun1
 
PPTX
Introduction to statistics
ScholarsPoint1
 
PPTX
Chi -square test
VIVEK KUMAR SINGH
 
PPTX
Types of Statistics Descriptive and Inferential Statistics
Dr. Amjad Ali Arain
 
PPTX
Sample Size Determination
Tina Sepehrifar
 
PPTX
Quantitative Data Analysis
Asma Muhamad
 
PPTX
What is Statistics
sidra-098
 
PPTX
Bivariate data
julienorman80065
 
Introduction to Statistics
Anjan Mahanta
 
Inferential statistics.ppt
Nursing Path
 
Type of data
Amit Sharma
 
Types of random sampling
Studying
 
Coefficient of variation
Nadeem Uddin
 
Statistics in research
Balaji P
 
What is statistics
Raj Teotia
 
Introduction to Statistics (Part -I)
YesAnalytics
 
Sampling techniques
Dr. Ankita Chaturvedi
 
Types of graphs
LALIT BIST
 
Introduction to statistics
madan kumar
 
DATA PRESENTATION METHODS - 1.pptx
vineetarun1
 
Introduction to statistics
ScholarsPoint1
 
Chi -square test
VIVEK KUMAR SINGH
 
Types of Statistics Descriptive and Inferential Statistics
Dr. Amjad Ali Arain
 
Sample Size Determination
Tina Sepehrifar
 
Quantitative Data Analysis
Asma Muhamad
 
What is Statistics
sidra-098
 
Bivariate data
julienorman80065
 

Similar to Descriptive and Inferential Statistics (20)

PDF
Statistics as a discipline
RosalinaTPayumo
 
PPTX
Basic-Statistics-in-Research-Design.pptx
KheannJanePasamonte
 
PPTX
Basic-Statistics in Research Design Presentation
FuriousRoblox
 
PPTX
RESEARCH II grade 8 descriptive and inferential statistics Fourth Quarter 2025
RaellenRegalado
 
PPTX
Statistics in research by dr. sudhir sahu
Sudhir INDIA
 
PPTX
Basic for DoE ruchir
Ruchir Shah
 
PPTX
DESCRIPTIVE-STATISTICS.pptxxxxxxcxxxcxdff
menaguado
 
PPTX
DESCRIPTIVE-STATISTICS.pptxxxxxxxxxxxxxxx
menaguado
 
PPTX
050325Online SPSS.pptx spss social science
NurFatin805963
 
PDF
probability and statistics Chapter 1 (1)
abfisho
 
PPTX
Stats LECTURE 1.pptx
KEHKASHANNIZAM
 
PPTX
Basic concept of statistics
GC University Faisalabad Pakistan
 
PPTX
Topic 1 ELEMENTARY STATISTICS.pptx
moisespadillacpsu19
 
PPTX
Statistics homework help
Helpmeinhomework
 
PPTX
Introduction to Statistics - Basic concepts
DocIbrahimAbdelmonaem
 
PPTX
statistics Lesson 1
donna ruth talo
 
PDF
basic statisticsfor stastics basic knolege
KalluKullu
 
PPTX
Types of Statistics.pptx
ANKURARYA23
 
PPSX
Presentation1
girlie22
 
PPTX
Basic Statistics
Chie Pegollo
 
Statistics as a discipline
RosalinaTPayumo
 
Basic-Statistics-in-Research-Design.pptx
KheannJanePasamonte
 
Basic-Statistics in Research Design Presentation
FuriousRoblox
 
RESEARCH II grade 8 descriptive and inferential statistics Fourth Quarter 2025
RaellenRegalado
 
Statistics in research by dr. sudhir sahu
Sudhir INDIA
 
Basic for DoE ruchir
Ruchir Shah
 
DESCRIPTIVE-STATISTICS.pptxxxxxxcxxxcxdff
menaguado
 
DESCRIPTIVE-STATISTICS.pptxxxxxxxxxxxxxxx
menaguado
 
050325Online SPSS.pptx spss social science
NurFatin805963
 
probability and statistics Chapter 1 (1)
abfisho
 
Stats LECTURE 1.pptx
KEHKASHANNIZAM
 
Basic concept of statistics
GC University Faisalabad Pakistan
 
Topic 1 ELEMENTARY STATISTICS.pptx
moisespadillacpsu19
 
Statistics homework help
Helpmeinhomework
 
Introduction to Statistics - Basic concepts
DocIbrahimAbdelmonaem
 
statistics Lesson 1
donna ruth talo
 
basic statisticsfor stastics basic knolege
KalluKullu
 
Types of Statistics.pptx
ANKURARYA23
 
Presentation1
girlie22
 
Basic Statistics
Chie Pegollo
 
Ad

Recently uploaded (20)

PPTX
Optimizing Cancer Screening With MCED Technologies: From Science to Practical...
i3 Health
 
PPTX
Views on Education of Indian Thinkers J.Krishnamurthy..pptx
ShrutiMahanta1
 
PPTX
Mrs Mhondiwa Introduction to Algebra class
sabinaschimanga
 
PDF
FULL DOCUMENT: Read the full Deloitte and Touche audit report on the National...
Kweku Zurek
 
PPTX
Nutrition Month 2025 TARP.pptx presentation
FairyLouHernandezMej
 
PPTX
How to Configure Access Rights of Manufacturing Orders in Odoo 18 Manufacturing
Celine George
 
PPTX
Optimizing Cancer Screening With MCED Technologies: From Science to Practical...
i3 Health
 
PDF
07.15.2025 - Managing Your Members Using a Membership Portal.pdf
TechSoup
 
PPTX
Folding Off Hours in Gantt View in Odoo 18.2
Celine George
 
PPTX
Gall bladder, Small intestine and Large intestine.pptx
rekhapositivity
 
PPTX
Maternal and Child Tracking system & RCH portal
Ms Usha Vadhel
 
PPTX
2025 Winter SWAYAM NPTEL & A Student.pptx
Utsav Yagnik
 
PPTX
PPT on the Development of Education in the Victorian England
Beena E S
 
PPTX
Capitol Doctoral Presentation -July 2025.pptx
CapitolTechU
 
PPTX
Accounting Skills Paper-I, Preparation of Vouchers
Dr. Sushil Bansode
 
PPTX
How to Define Translation to Custom Module And Add a new language in Odoo 18
Celine George
 
PPTX
How to Configure Storno Accounting in Odoo 18 Accounting
Celine George
 
PDF
Ziehl-Neelsen Stain: Principle, Procedu.
PRASHANT YADAV
 
PPTX
Nutri-QUIZ-Bee-Elementary.pptx...................
ferdinandsanbuenaven
 
PPTX
How to Configure Prepayments in Odoo 18 Sales
Celine George
 
Optimizing Cancer Screening With MCED Technologies: From Science to Practical...
i3 Health
 
Views on Education of Indian Thinkers J.Krishnamurthy..pptx
ShrutiMahanta1
 
Mrs Mhondiwa Introduction to Algebra class
sabinaschimanga
 
FULL DOCUMENT: Read the full Deloitte and Touche audit report on the National...
Kweku Zurek
 
Nutrition Month 2025 TARP.pptx presentation
FairyLouHernandezMej
 
How to Configure Access Rights of Manufacturing Orders in Odoo 18 Manufacturing
Celine George
 
Optimizing Cancer Screening With MCED Technologies: From Science to Practical...
i3 Health
 
07.15.2025 - Managing Your Members Using a Membership Portal.pdf
TechSoup
 
Folding Off Hours in Gantt View in Odoo 18.2
Celine George
 
Gall bladder, Small intestine and Large intestine.pptx
rekhapositivity
 
Maternal and Child Tracking system & RCH portal
Ms Usha Vadhel
 
2025 Winter SWAYAM NPTEL & A Student.pptx
Utsav Yagnik
 
PPT on the Development of Education in the Victorian England
Beena E S
 
Capitol Doctoral Presentation -July 2025.pptx
CapitolTechU
 
Accounting Skills Paper-I, Preparation of Vouchers
Dr. Sushil Bansode
 
How to Define Translation to Custom Module And Add a new language in Odoo 18
Celine George
 
How to Configure Storno Accounting in Odoo 18 Accounting
Celine George
 
Ziehl-Neelsen Stain: Principle, Procedu.
PRASHANT YADAV
 
Nutri-QUIZ-Bee-Elementary.pptx...................
ferdinandsanbuenaven
 
How to Configure Prepayments in Odoo 18 Sales
Celine George
 
Ad

Descriptive and Inferential Statistics

  • 2. “statistics is a branch of applied mathematics That deals with the collection, organization, presentation, analysis, and interpretation of data.” 2
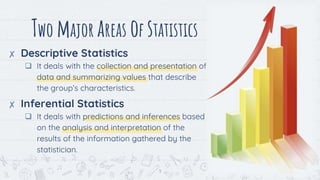
  • 3. Two major areas of statistics ✘ Descriptive Statistics  It deals with the collection and presentation of data and summarizing values that describe the group’s characteristics. ✘ Inferential Statistics  It deals with predictions and inferences based on the analysis and interpretation of the results of the information gathered by the statistician. 3
  • 4. Common Problems ✘ Descriptive Statistics  What is the percentage of X, Y, and Z participants?  What is the average monthly salary of the employees in Company A?  How much students in SRCB are satisfied about the quality education it provides? ✘ Inferential Statistics  Is the claim true that the mean lifespan of the batter-operated toy cars is 5 years?  Is the claim true that the student’s performance in Biology did not improve?  Is there a significant difference in the mean sales of the three candidates for promotion? 4
  • 5. ✘ Descriptive Statistics  You could make a bar chart of yes or no answers. ✘ Inferential Statistics  You could use your research to reason that around 75-80% of the population (all shoppers in all malls) like shopping at Prince Hypermart. 5 Example: You might stand in a mall and ask a sample of 100 people if they like shopping at Prince Hypermart.
  • 6. DESCRIPTIVE STATISTICS It organize, analyze, and present data in a meaningful way. Differences Based on WHAT IT DOES? INFERENTIAL STATISTICS Compares, test and predicts data. 6
  • 7. DESCRIPTIVE STATISTICS ✘ Measures of Central Tendency ✘ Measures of Variation Differences Based on tools INFERENTIAL STATISTICS ✘ Hypothesis Testing ✘ Analysis of Variance 7
  • 10. Measures of Variations: range, variance, standard deviation
  • 11. FORMULAS: 𝑹 = 𝑯𝒊𝒈𝒉𝒆𝒔𝒕 𝒔𝒄𝒐𝒓𝒆 − 𝑳𝒐𝒘𝒆𝒔𝒕 𝒔𝒄𝒐𝒓𝒆 11 𝝈 = 𝜎𝑁 2 𝒔 = 𝑠𝑁−1 2
  • 13. 6 Steps in Hypothesis Testing 13 ✘ Identify the Problem ✘ Formulate Null and Alternative Hypothesis ✘ Level of Significance ✘ Statistics ✘ Decision Rule ✘ Conclusion
  • 14. 14
  • 15. 15
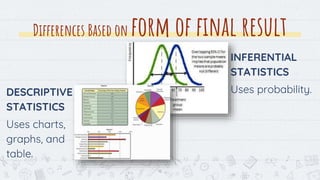
  • 16. DESCRIPTIVE STATISTICS Uses charts, graphs, and table. Differences Based on form of final result INFERENTIAL STATISTICS Uses probability. 16
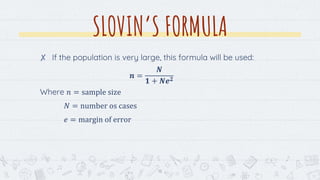
  • 18. SLOVIN’S FORMULA 18 ✘ If the population is very large, this formula will be used: 𝒏 = 𝑵 𝟏 + 𝑵𝒆𝟐 Where 𝑛 = sample size 𝑁 = number os cases 𝑒 = margin of error
  • 19. Example: Using SLOVIN’S FORMULA 19 ✘ A researcher wants to know the average income of the families living in Barangay A which has 2,500 residents. Calculate the sample size the researcher will need if a 5% margin of error is allowed. 𝒏 = 𝟐, 𝟓𝟎𝟎 𝟏 + 𝟐, 𝟓𝟎𝟎 𝟎. 𝟎𝟓 𝟐 = 𝟑𝟒𝟒. 𝟖 ≈ 𝟑𝟒𝟓 𝒇𝒂𝒎𝒊𝒍𝒊𝒆𝒔 Where 𝑛 = sample size 𝑁 = 2,500 𝑒 = 0.05