Elements of inferential statistics
Download as PPTX, PDF0 likes847 views

1. The document discusses key concepts in inferential statistics including point estimation, interval estimation, hypothesis testing, types of errors, p-values, power, and one-tailed and two-tailed tests. 2. It explains that inferential statistics allows generalization from a sample to a population and includes estimation of parameters and hypothesis testing. 3. Common statistical techniques covered are confidence intervals, which provide a range of values that likely contain the true population parameter, and hypothesis testing, which evaluates theories about populations.


Elements of inferential statistics
- 1. (Basic concepts, Type I and Type II error, p-value, power, one tailed and two tailed test and confidence interval) Prepared by Arati G Mishra PhD Scholar Principal SET SON-Junagadh
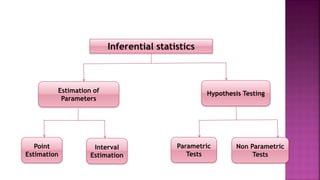
- 2. Inferential statistics Estimation of Parameters Hypothesis Testing Point Estimation Interval Estimation Parametric Tests Non Parametric Tests
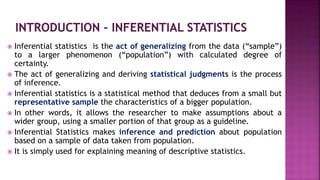
- 4. Inferential statistics is the act of generalizing from the data (“sample”) to a larger phenomenon (“population”) with calculated degree of certainty. The act of generalizing and deriving statistical judgments is the process of inference. Inferential statistics is a statistical method that deduces from a small but representative sample the characteristics of a bigger population. In other words, it allows the researcher to make assumptions about a wider group, using a smaller portion of that group as a guideline. Inferential Statistics makes inference and prediction about population based on a sample of data taken from population. It is simply used for explaining meaning of descriptive statistics.
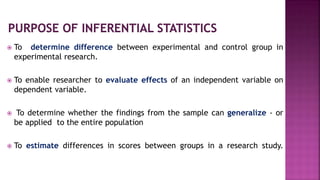
- 5. To determine difference between experimental and control group in experimental research. To enable researcher to evaluate effects of an independent variable on dependent variable. To determine whether the findings from the sample can generalize - or be applied to the entire population To estimate differences in scores between groups in a research study.
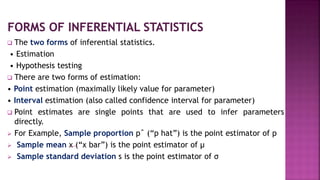
- 6. The two forms of inferential statistics. • Estimation • Hypothesis testing There are two forms of estimation: • Point estimation (maximally likely value for parameter) • Interval estimation (also called confidence interval for parameter) Point estimates are single points that are used to infer parameters directly. For Example, Sample proportion pˆ (“p hat”) is the point estimator of p Sample mean x (“x bar”) is the point estimator of μ Sample standard deviation s is the point estimator of σ
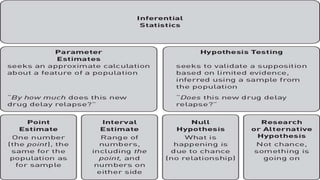
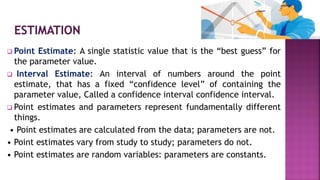
- 7. Point Estimate: A single statistic value that is the “best guess” for the parameter value. Interval Estimate: An interval of numbers around the point estimate, that has a fixed “confidence level” of containing the parameter value, Called a confidence interval confidence interval. Point estimates and parameters represent fundamentally different things. • Point estimates are calculated from the data; parameters are not. • Point estimates vary from study to study; parameters do not. • Point estimates are random variables: parameters are constants.
- 8. A point estimate of the population mean almost is assured of being in error, the estimate from the sample will not equal to the exact value of the parameter. To gain confidence about the accuracy of this estimate we may also construct an interval of scores that is expected to include the value of the population mean. Such intervals are called confidence interval. • A confidence interval is a range of scores that is expected to contain the value of (μ). The lower and upper scores that determine the interval are called confidence limits. • A level of confidence can be attached to this estimate so that the researcher can be 95% or 99% confidence level that encompasses the population mean.
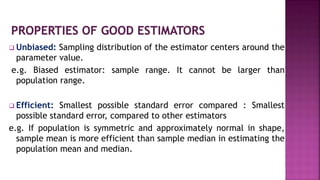
- 9. Unbiased: Sampling distribution of the estimator centers around the parameter value. e.g. Biased estimator: sample range. It cannot be larger than population range. Efficient: Smallest possible standard error compared : Smallest possible standard error, compared to other estimators e.g. If population is symmetric and approximately normal in shape, sample mean is more efficient than sample median in estimating the population mean and median.
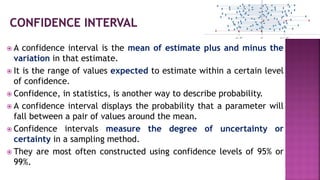
- 10. A confidence interval is the mean of estimate plus and minus the variation in that estimate. It is the range of values expected to estimate within a certain level of confidence. Confidence, in statistics, is another way to describe probability. A confidence interval displays the probability that a parameter will fall between a pair of values around the mean. Confidence intervals measure the degree of uncertainty or certainty in a sampling method. They are most often constructed using confidence levels of 95% or 99%.
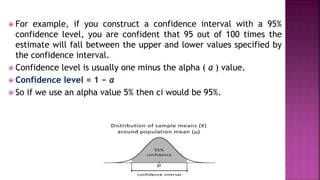
- 11. For example, if you construct a confidence interval with a 95% confidence level, you are confident that 95 out of 100 times the estimate will fall between the upper and lower values specified by the confidence interval. Confidence level is usually one minus the alpha ( a ) value. Confidence level = 1 − a So if we use an alpha value 5% then ci would be 95%.
- 12. Hypothesis testing is a type of inferential procedure that takes help of sample data to evaluate and assess credibility of a hypothesis about a population. Inferential statistics are generally used to determine how strong relationship is within sample. But it is very difficult to obtain a population list and draw a random sample. These tests are performed under two main hypotheses. They are, Null hypothesis and Alternative hypothesis. For Example the research prediction that is tested (e.g. students in situation A will perform better than students in situation B) Null hypothesis: a statement of “no difference” between the means of two populations (there will be no difference in the performance of students in situations A and B).
- 13. Null Hypothesis: the hypothesis that sample observations result purely from chance. The null hypothesis tends to state that there’s no change. Alternative Hypothesis: the hypothesis that sample observations are influenced by some non-random cause. P-value: the probability of obtaining the observed results of a test, assuming that the null hypothesis is correct; a smaller p-value means that there is stronger evidence in favor of the alternative hypothesis. Alpha: the significance level; the probability of rejecting the null hypothesis when it is true — also known as Type 1 error.
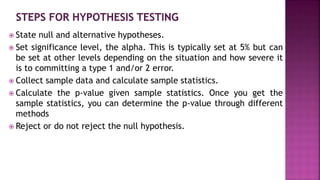
- 14. State null and alternative hypotheses. Set significance level, the alpha. This is typically set at 5% but can be set at other levels depending on the situation and how severe it is to committing a type 1 and/or 2 error. Collect sample data and calculate sample statistics. Calculate the p-value given sample statistics. Once you get the sample statistics, you can determine the p-value through different methods Reject or do not reject the null hypothesis.
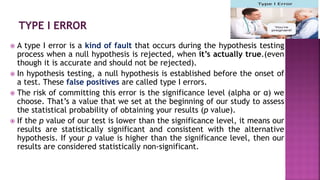
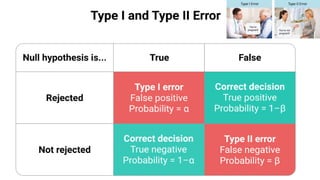
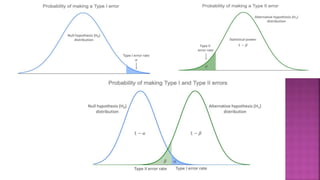
- 16. A type I error is a kind of fault that occurs during the hypothesis testing process when a null hypothesis is rejected, when it’s actually true.(even though it is accurate and should not be rejected). In hypothesis testing, a null hypothesis is established before the onset of a test. These false positives are called type I errors. The risk of committing this error is the significance level (alpha or α) we choose. That’s a value that we set at the beginning of our study to assess the statistical probability of obtaining your results (p value). If the p value of our test is lower than the significance level, it means our results are statistically significant and consistent with the alternative hypothesis. If your p value is higher than the significance level, then our results are considered statistically non-significant.
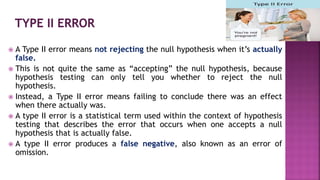
- 17. A Type II error means not rejecting the null hypothesis when it’s actually false. This is not quite the same as “accepting” the null hypothesis, because hypothesis testing can only tell you whether to reject the null hypothesis. Instead, a Type II error means failing to conclude there was an effect when there actually was. A type II error is a statistical term used within the context of hypothesis testing that describes the error that occurs when one accepts a null hypothesis that is actually false. A type II error produces a false negative, also known as an error of omission.
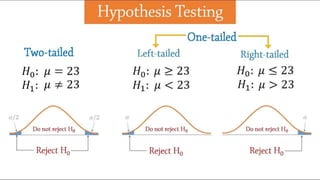
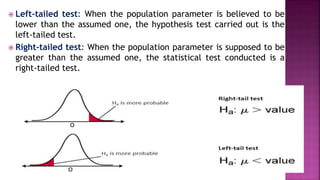
- 20. One-tailed test alludes to the significance test in which the region of rejection appears on one end of the sampling distribution. It represents that the estimated test parameter is greater or less than the critical value. When the sample tested falls in the region of rejection, i.e. either left or right side, as the case may be, it leads to the acceptance of alternative hypothesis rather than the null hypothesis. It is primarily applied in chi-square distribution; that ascertains the goodness of fit. In this statistical hypothesis test, all the critical region, related to α, is placed in any one of the two tails. One-tailed test can be:
- 21. Left-tailed test: When the population parameter is believed to be lower than the assumed one, the hypothesis test carried out is the left-tailed test. Right-tailed test: When the population parameter is supposed to be greater than the assumed one, the statistical test conducted is a right-tailed test.
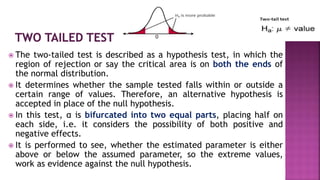
- 22. The two-tailed test is described as a hypothesis test, in which the region of rejection or say the critical area is on both the ends of the normal distribution. It determines whether the sample tested falls within or outside a certain range of values. Therefore, an alternative hypothesis is accepted in place of the null hypothesis. In this test, α is bifurcated into two equal parts, placing half on each side, i.e. it considers the possibility of both positive and negative effects. It is performed to see, whether the estimated parameter is either above or below the assumed parameter, so the extreme values, work as evidence against the null hypothesis.
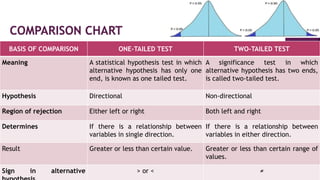
- 23. BASIS OF COMPARISON ONE-TAILED TEST TWO-TAILED TEST Meaning A statistical hypothesis test in which alternative hypothesis has only one end, is known as one tailed test. A significance test in which alternative hypothesis has two ends, is called two-tailed test. Hypothesis Directional Non-directional Region of rejection Either left or right Both left and right Determines If there is a relationship between variables in single direction. If there is a relationship between variables in either direction. Result Greater or less than certain value. Greater or less than certain range of values. Sign in alternative > or < ≠
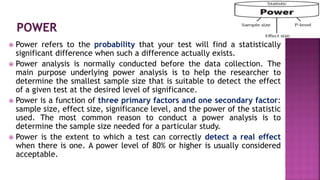
- 24. Power refers to the probability that your test will find a statistically significant difference when such a difference actually exists. Power analysis is normally conducted before the data collection. The main purpose underlying power analysis is to help the researcher to determine the smallest sample size that is suitable to detect the effect of a given test at the desired level of significance. Power is a function of three primary factors and one secondary factor: sample size, effect size, significance level, and the power of the statistic used. The most common reason to conduct a power analysis is to determine the sample size needed for a particular study. Power is the extent to which a test can correctly detect a real effect when there is one. A power level of 80% or higher is usually considered acceptable.
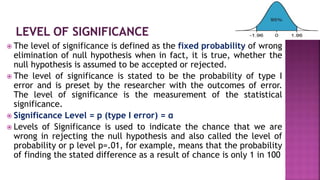
- 25. The level of significance is defined as the fixed probability of wrong elimination of null hypothesis when in fact, it is true, whether the null hypothesis is assumed to be accepted or rejected. The level of significance is stated to be the probability of type I error and is preset by the researcher with the outcomes of error. The level of significance is the measurement of the statistical significance. Significance Level = p (type I error) = α Levels of Significance is used to indicate the chance that we are wrong in rejecting the null hypothesis and also called the level of probability or p level p=.01, for example, means that the probability of finding the stated difference as a result of chance is only 1 in 100
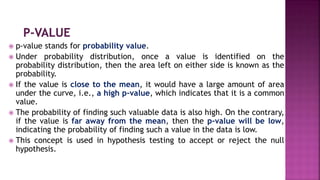
- 26. p-value stands for probability value. Under probability distribution, once a value is identified on the probability distribution, then the area left on either side is known as the probability. If the value is close to the mean, it would have a large amount of area under the curve, i.e., a high p-value, which indicates that it is a common value. The probability of finding such valuable data is also high. On the contrary, if the value is far away from the mean, then the p-value will be low, indicating the probability of finding such a value in the data is low. This concept is used in hypothesis testing to accept or reject the null hypothesis.
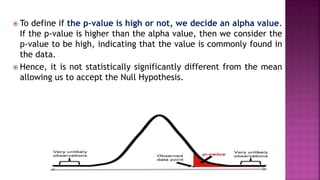
- 27. To define if the p-value is high or not, we decide an alpha value. If the p-value is higher than the alpha value, then we consider the p-value to be high, indicating that the value is commonly found in the data. Hence, it is not statistically significantly different from the mean allowing us to accept the Null Hypothesis.
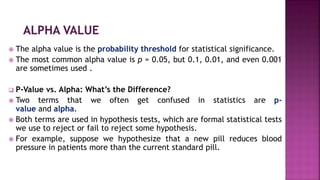
- 28. The alpha value is the probability threshold for statistical significance. The most common alpha value is p = 0.05, but 0.1, 0.01, and even 0.001 are sometimes used . P-Value vs. Alpha: What’s the Difference? Two terms that we often get confused in statistics are p- value and alpha. Both terms are used in hypothesis tests, which are formal statistical tests we use to reject or fail to reject some hypothesis. For example, suppose we hypothesize that a new pill reduces blood pressure in patients more than the current standard pill.
- 29. To test this, we can conduct a hypothesis test where we define the following null and alternative hypotheses: Null hypothesis: There is no difference between the new pill and the standard pill. Alternative hypothesis: There is a difference between the new pill and the standard pill. If we assume the null hypothesis is true, the p-value of the test tells us the probability of obtaining an effect at least as large as the one we actually observed in the sample data. For example, suppose we find that the p-value of the hypothesis test is 0.02.
- 30. Here’s how to interpret this p-value: If there truly was no difference between the new pill and the standard pill, then 2% of the times that we perform this hypothesis test we would obtain the effect observed in the sample data, or larger, simply due to random sample error. This tells us that obtaining the sample data that we actually did would be pretty rare if indeed there was no difference between the new pill and the standard pill. Thus, we would be inclined to reject the statement in the null hypothesis and conclude that there is a difference between the new pill and the standard pill. But what threshold should we use to determine if our p-value is low enough to reject the null hypothesis? This is where alpha comes in.
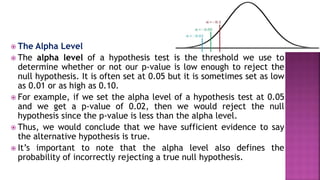
- 31. The Alpha Level The alpha level of a hypothesis test is the threshold we use to determine whether or not our p-value is low enough to reject the null hypothesis. It is often set at 0.05 but it is sometimes set as low as 0.01 or as high as 0.10. For example, if we set the alpha level of a hypothesis test at 0.05 and we get a p-value of 0.02, then we would reject the null hypothesis since the p-value is less than the alpha level. Thus, we would conclude that we have sufficient evidence to say the alternative hypothesis is true. It’s important to note that the alpha level also defines the probability of incorrectly rejecting a true null hypothesis.
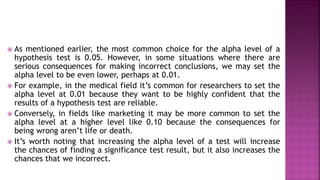
- 32. As mentioned earlier, the most common choice for the alpha level of a hypothesis test is 0.05. However, in some situations where there are serious consequences for making incorrect conclusions, we may set the alpha level to be even lower, perhaps at 0.01. For example, in the medical field it’s common for researchers to set the alpha level at 0.01 because they want to be highly confident that the results of a hypothesis test are reliable. Conversely, in fields like marketing it may be more common to set the alpha level at a higher level like 0.10 because the consequences for being wrong aren’t life or death. It’s worth noting that increasing the alpha level of a test will increase the chances of finding a significance test result, but it also increases the chances that we incorrect. How to Choose the Alpha Level ?
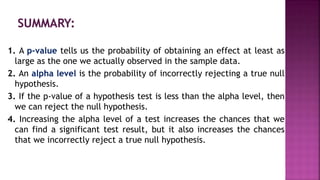
- 33. 1. A p-value tells us the probability of obtaining an effect at least as large as the one we actually observed in the sample data. 2. An alpha level is the probability of incorrectly rejecting a true null hypothesis. 3. If the p-value of a hypothesis test is less than the alpha level, then we can reject the null hypothesis. 4. Increasing the alpha level of a test increases the chances that we can find a significant test result, but it also increases the chances that we incorrectly reject a true null hypothesis.
- 34. https://www.statisticshowto.com/probability-and-statistics/statistics-definitions/inferential- statistics/ https://libraryguides.centennialcollege.ca/c.php?g=717168&p=5123291 https://slideplayer.com/slide/6261841/ https://www.intellspot.com/inferential-statistics-types/ https://www.geneseo.edu/~rommel/educ504/ch10%20inferential%20stx.pdf https://www.geeksforgeeks.org/introduction-of-statistics-and-its-types/IMP https://askinglot.com/what-is-the-purpose-of-inferential-statistics https://www.sjsu.edu/faculty/gerstman/StatPrimer/estimation.pdf http://users.stat.ufl.edu/~aa/harvard/5.%20Estimation.pdf https://www.statology.org/p-value-vs-alpha/ https://www.statsdirect.com/help/basics/p_values.htm https://towardsdatascience.com/hypothesis-testing-explained-as-simply-as-possible-6e0a256293cf https://www.scribbr.com/statistics/type-i-and-type-ii-errors/