


More Related Content
What's hot (20)
Viewers also liked (20)


Similar to General Statistics boa (20)


More from raileeanne (9)


Recently uploaded (20)


General Statistics boa
- 3. TABLE OF CONTENTS Chapter 1. Preliminary Concepts 1.1 Introduction and Basic Concepts 1.2 Variables and Data 1.3 Summation Chapter 2. Data Collection and Presentation 2.1 Data Collection 2.2 Data Presentation 2.3 Graphical Representation of Frequency Distribution
- 4. Chapter 3. Measure of Central Tendency 3.1 The Mean 3.2 Median and Mode 3.3 Percentiles, Deciles, and Quartiles Chapter 4. Measure of Disfersion and Skewness 4.1 Measure of Variability 4.2 Coefficient of Variation
- 5. Chapter 5. Permutations and Combinations 5.1 Principle of Counting 5.2 Permutations 5.3 Combinations
- 6. Chapter 1
- 7. 1.1 Introduction and Basic Concepts This section aims to: discuss the background and the development of statistics; Define and differentiate the two branches of statistics; and Differentiate population from sample.
- 8. Statistical information and development can be traced back from ancient times. People compiled statistical data with regard to all sorts of things such as agricultural crops, athletic events, commerce and trade and so on. As time went by, statistical work has continued to have a marked influence on the activities of mankind in a wider scope from describing important features of the data and analyzing them.
- 9. Statistics A science of conducting studies to collect, organize, summarize, analyze, and draw conclusion from data; interpreting and presenting numerical data. Can refer to the mere tabulation of numeric information as in reports of stock, market, transactions, or to the body of techniques used in processing or analyzing data.
- 10. Data Data are the raw material which the statistician works. Data can be found through surveys, experiments, numerical records, and other modes of research.
- 11. Statistician Statistician is also used in several ways. It can be a person who simply collects information or one who prepares analysis or interpretations. It may mean a scholar who develops a mathematical theory on which the science of statistics is based.
- 12. Two Branches of Statistics Statistics can be organized into descriptive statistics and inferential statistics .
- 13. Descriptive Statistics Concerned with collecting, organizing, presenting, and analyzing numerical data.
- 14. Inferential Statistics Its main concern is to analyze the organized data leading to prediction or inferences.
- 15. The word “population” and “sample” are the most commonly used words associated with statistics.
- 16. Population Refers to the groups or aggregates of people, objects, materials, events or thing of any form.
- 17. Sample Consist of few or more members of the population.
- 18. 1.2 Variables and Data This section aims to: Differentiate the two types of variables; Identify and illustrate the two areas of quantitative variables; Enumerate the classifications of data; and Apply the types of variables in various fields of applications.
- 19. Statistical data or information can be gathered through different ways such as interviewing people, observing or inspecting items, using questionnaires and checklists. The characteristic that is being studied is called a variable. It varies from one person or thing to another.
- 20. Examples of variables for people are height , weight , age , sex , marital status , eye color , etc. The first three of the given variables yield numerical values and are examples of quantitative variables . The last three yield non-numerical values or attributes are examples of qualitative variables.
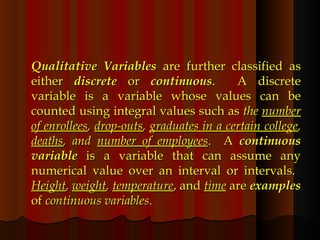
- 21. Qualitative Variables are further classified as either discrete or continuous . A discrete variable is a variable whose values can be counted using integral values such as the number of enrollees , drop-outs , graduates in a certain college , deaths , and number of employees . A continuous variable is a variable that can assume any numerical value over an interval or intervals. Height , weight , temperature , and time are examples of continuous variables .
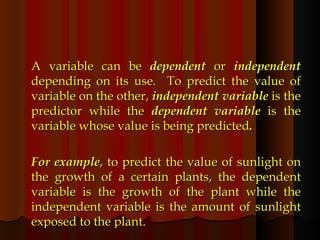
- 22. A variable can be dependent or independent depending on its use. To predict the value of variable on the other, independent variable is the predictor while the dependent variable is the variable whose value is being predicted . For example , to predict the value of sunlight on the growth of a certain plants, the dependent variable is the growth of the plant while the independent variable is the amount of sunlight exposed to the plant.
- 23. Scales of Measurement of Data
- 24. Nominal Data Use numbers for the purpose of identifying name or membership in a group or category.
- 25. Ordinal Data Connote ranking or inequalities in this type of data, numbers represents “greater than” or “less than” measurement, such as preferences or rankings.
- 26. Interval Data Indicate an actual amount and there is equal unit of measurement separating each score, specifically equal intervals. The true zero is present.
- 27. Ratio Data Similar to interval data but has an absolute zero and multiples are meaningful. It include all the usual measurement of length, height, weight, area, volume, density, velocity, money and duration.
- 28. 1.3 Summation This section aims to: Introduce a special notation that will work as a shortcut for expressing sum of terms and thereby appreciate mathematics as a tool of symbols; and State and analyze the properties of summation.
- 29. When dealing with a sum of terms, we shall have occasions to use an abbreviated form. This special symbol for writing of sums is called summation. Summation is denoted by ∑, is defined as n ∑ x i =x 1 +x 2 +…+x n i=1 s
- 30. Where 1 and n are called the lower and upper limits respectively. We note that x1, is read as “x sub 1”
- 31. Chapter 2
- 32. 2.1 Data Collection This section aims to: Identify, compare and contrast the different types of data; List and explain the various techniques of selecting a sample; and Enumerate and illustrate the different sampling techniques.
- 33. Types of Data Primary Data - data collected directly by the researcher himself. These are first-hand or original sources. They can be collected through the ff: Direct observation or measurement (primary source of info). By interview (questionnaires or rating scales). By mail of recording or of recording forms. Experimentation.
- 34. Secondary Data Are information taken from published or unpublished materials previously gathered by other researchers or agencies such as book, newspapers, magazines; journals, published and unpublished thesis and dissertations.
- 35. Two types of Sampling Technique: Probability Sampling - every unit has a chance of being selected and that chance can be qualified. Non-Probability Sampling - every item in a population does not have an equal chance of being selected.
- 36. Sampling Technique Procedure in selecting the numbers of samples from the entire population.
- 37. Different Types of Sampling Techniques
- 38. Simple Random Sampling It is recommended to prevent the possibility of a bias or erroneous inference. Under the concept of randomness, each member of the population has an equal chance to be included in the sample gathered.
- 39. Systematic Random Sampling The items or individuals are arranged in some way perhaps alphabetically or other sort.
- 40. Stratified Random Sampling In this type of planning a population is first divided into subsets based on homogenity called Strata. The Strata are internally homogenous as possible and at the same time each stratum is different from one another as much as possible.
- 41. Cluster Sampling Can be done by subdividing the population into smaller units and then selecting only a random some primary units where the study would then be concentrated if sometimes referred are sampling because it is frequently applied on a geographical basis
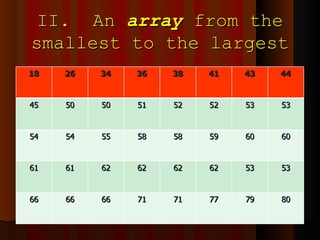
- 42. 2.2 Data Presentation This section aims to: Summarize and present data in different forms; Arrange and organize the raw data into a n array and construct the frequency distribution, stem and lead diagram; and Define, illustrate, and solve for the class limits, class boundaries and class marks.
- 43. Methods in Presenting Data Textual Form - data in paragraph form. Tabular Form - systematic arrangement of data in rows and columns. Graphical Form - a graph or chart is a device for showing numerical values in pictorial form. Semi Tabular/Semi Tabular Form - the combination of Textual and Tabular Form.
- 44. Stem and Leaf Diagram Raw data are data collected in an investigation and they are not organized systematically. Raw data that are presented in the form of a frequency distribution are called grouped data . There are two methods of organizing the raw data – setting up an array and stem-and leaf diagram.
- 45. For example , a nationwide travel agency offers special rates for package tours during summer. To economize spending for the advertisement only certain age group of people will be sent brochures for attraction. The agency gets to previous passenger customers from its files and groups them according to ages. Only those age groups with least people are sent brochures. The following are the ages of the previous customers:
- 46. Example: 59 50 52 38 80 62 77 56 60 61 58 62 51 36 54 18 71 54 44 52 26 63 58 56 41 34 61 50 60 53 62 62 53 43 63 71 65 79 45 66
- 47. I. Setting up an array from the largest to the smallest 80 79 77 71 71 66 66 66 63 63 62 52 52 52 61 61 60 60 59 58 58 55 54 54 53 53 52 52 50 50 50 45 44 43 41 38 36 34 26 18
- 48. II. An array from the smallest to the largest 18 26 34 36 38 41 43 44 45 50 50 51 52 52 53 53 54 54 55 58 58 59 60 60 61 61 62 62 62 62 53 53 66 66 66 71 71 77 79 80
- 49. III. Setting up into stem-and-leaf diagram 8 6 4 6 8 1 3 4 5 0 0 1 2 2 3 4 4 5 8 8 0 0 1 1 2 2 2 3 3 6 6 1 1 7 9 0
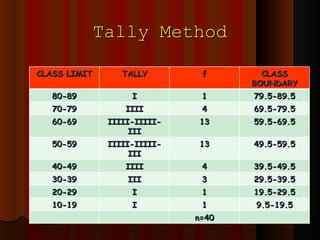
- 50. Tally Method CLASS LIMIT TALLY f CLASS BOUNDARY 80-89 I 1 79.5-89.5 70-79 IIII 4 69.5-79.5 60-69 IIIII-IIIII-III 13 59.5-69.5 50-59 IIIII-IIIII-III 13 49.5-59.5 40-49 IIII 4 39.5-49.5 30-39 III 3 29.5-39.5 20-29 I 1 19.5-29.5 10-19 I 1 9.5-19.5 n=40
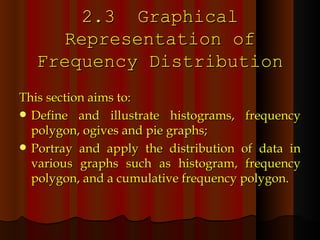
- 51. 2.3 Graphical Representation of Frequency Distribution This section aims to: Define and illustrate histograms, frequency polygon, ogives and pie graphs; Portray and apply the distribution of data in various graphs such as histogram, frequency polygon, and a cumulative frequency polygon.
- 52. Graphical forms of presenting information is often more helpful in making a stronger impact. There are some features in tabular form, which can’t be discerned simply by looking at raw data.
- 53. Graphical Representation of Frequency Distribution
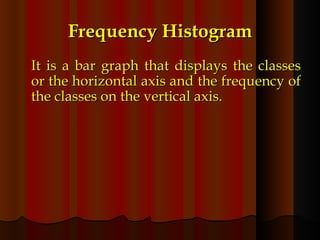
- 54. Frequency Histogram It is a bar graph that displays the classes or the horizontal axis and the frequency of the classes on the vertical axis.
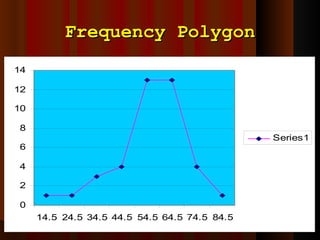
- 56. Frequency Polygon It is a line chart that is constructed by plotting the frequencies and class mark and connecting the plotted pointed by means of a straight line; the polygon us closed by considering an additional class at each end and each end of the lines are brought down to the horizontal axis at the mid point of the additional classes.
- 58. Ogive It is a graph of a cumulative frequency distribution and sometimes called a cumulative frequency distribution graph.
- 59. Ogive
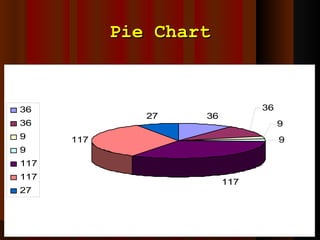
- 60. Pie Chart It is a graphical presentation that uses circle or pie.
- 61. Pie Chart
- 62. Chapter 3
- 63. 3.1 The Mean This section aims to: State and illustrate the definition of the mean both for grouped and raw data (ungrouped); Apply the shortcut formula for calculating the mean.
- 64. The most commonly used measure of central tendency is the mean . When taking an average, it is the mean that is often referring to. This section is divided into two: the mean for ungrouped data and the mean for grouped data
- 65. MEASURES OF CENTRAL TENDENCY -single number represent the given data. Mean – average value of the given data. - not appropriate measures of central tendency if there is outer . 2. Median – divide the distribution into two equal parts (upper 50% and the lower 50%)
- 66. 3. Mode – the most frequent occuring data. - nominal value/part.
- 67. UNGROUPED DATA 25 32 41 58 78 9 5 105 110 112 112 115 Mean = ∑ X n = 883 11 = 80.2727
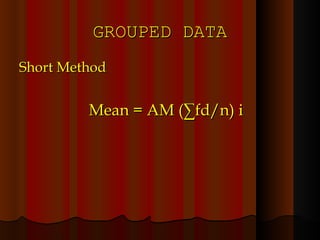
- 68. GROUPED DATA Short Method Mean = AM (∑fd/n) i
- 69. Long Method Mean = ∑fx n = 2250 40 Mean = 56.25
- 70. 3.2 Median and Mode This section aims to: Differentiate the three principal measurements of central tendency; Apply the computations of the median and mode in various sets of data
- 71. B. Median - is the middle measure in a set of measures arranged in order magnitude. If the total number of measure is given by the average of two middle measures. Thus, in the median, half the distribution lies above it.
- 72. Mode = 112 if in case of two mode, it is called bimodal. if no mode, there is no pair of data.
- 73. C. Mode - is the item or measure which occurs most often. It has the highest number of frequency.
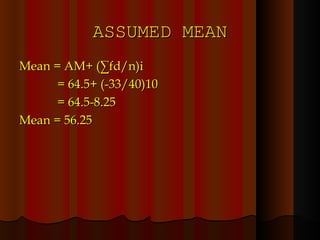
- 74. ASSUMED MEAN Mean = AM+ (∑fd/n)i = 64.5+ (-33/40)10 = 64.5-8.25 Mean = 56.25
- 75. Median Median = LL+ (n/2-<cf) i f = LL + (20-9/13)10 = 49.5 + (11/13) 10 = 49.5 + 8.4615 Median =57.9615
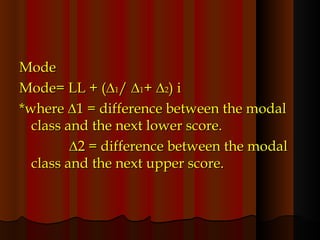
- 76. Mode Mode= LL + (∆ 1 / ∆ 1 + ∆ 2 ) i *where ∆1 = difference between the modal class and the next lower score. ∆ 2 = difference between the modal class and the next upper score.
- 77. 3.3 Percentiles, Deciles, and Quartiles This section aims to: Define, illustrate, and distinguish percentiles, deciles, and quartiles; and Discuss the formulas of percentiles, deciles, and quartiles.
- 78. Measure of Location Position/Location
- 79. QUARTILE (Q) Q 1 - 25% 1/2 Q 2 - 50% 1/2 Q 3 - 75% 3/4
- 80. DECILE (D) D 1 -10% D 2 – 20% D 3 – 30% D 4 - 40% D 5 - 50% D 6 - 60% D 7 - 70% D 8 - 80% D 9 - 90%
- 81. PERCENTILE (P) P 1 - 1/100 P 2 - 2/100 P 3 - 3/100 P 4 - 4/100 P 5 - 5/100 … .. P 99 - 99/100
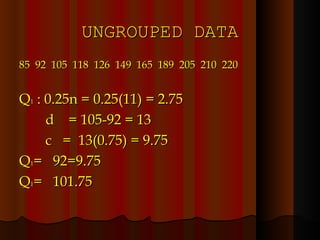
- 82. UNGROUPED DATA 85 92 105 118 126 149 165 189 205 210 220 Q 1 : 0.25n = 0.25(11) = 2.75 d = 105-92 = 13 c = 13(0.75) = 9.75 Q 1 = 92=9.75 Q 1 = 101.75
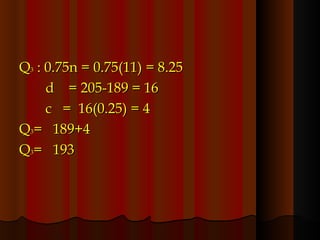
- 83. Q 3 : 0.75n = 0.75(11) = 8.25 d = 205-189 = 16 c = 16(0.25) = 4 Q 3 = 189+4 Q 3 = 193
- 84. P 3 : 0.3n = 0.3(11) = 8.25 d = 118-105= 13 c = 13(0.3) = 3.9 P 3 = 105+3.9 P 3 = 108.9
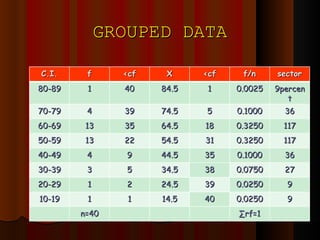
- 85. GROUPED DATA C.I. f <cf X <cf f/n sector 80-89 1 40 84.5 1 0.0025 9percent 70-79 4 39 74.5 5 0.1000 36 60-69 13 35 64.5 18 0.3250 117 50-59 13 22 54.5 31 0.3250 117 40-49 4 9 44.5 35 0.1000 36 30-39 3 5 34.5 38 0.0750 27 20-29 1 2 24.5 39 0.0250 9 10-19 1 1 14.5 40 0.0250 9 n=40 ∑ rf=1
- 86. Q 1 = LL + n/4 - <cf i f = 49.5 + 10-9 10 13 = 4905 + (1/13) 10 = 4905 + 0.7692 Q 1 = 50.2692
- 87. Q 3 = LL + 3n/4 - <cf i f = 59.5 + 30-22 10 13 = 59.5 + (80/13) 10 = 59.5 + 6.1538 Q 3 = 65.6538
- 88. D 2 = LL + 0.2n - <cf i f = 39.5 + 8-5 10 4 = 39.5 + (30/4) 10 = 39.5 + 7.5 D 2 = 47
- 89. P 23 = LL + 0.23n - <cf i f = 49.5 + 92.2 - 9 10 13 = 49.5 + (0.2/13) 10 = 49.5 + (0.0153)10 = 49.5 + 0.1538 P 23 = 49.6538
- 90. Q 3 = LL + 3n/4 - <cf i f = 59.5 + 30-22 10 13 = 59.5 + (80/13) 10 = 59.5 + 6.1538 Q 3 = 65.6538
- 91. MEASURE OF VARIABILITY OR DISPERSION Measure of the scatteredness of a particular data in a given data set. Average of distance
- 92. 1. Range = H.S. – L.S. C.L. Range 80-89 8905-9.5 = 80 2. Mean Average Deviation - takes into account all the variables in a given distribution.
- 93. FORMULA FOR FINDING MEAN AVERAGE DEVIATION: MAD = ∑|x-x| n
- 94. 3. Standard Deviation - the most commonly used in measures of variability UNGROUPED DATA Sample SD 1. SD= ∑(x-x) 2 2. SD= ∑x 2 – (x) 2 n-1 n-1 Population SD = ∑x-m) 2 N
- 95. GROUPED DATA: SD = i ∑f(d 1 ) 2 - ∑fd 1 2 n n
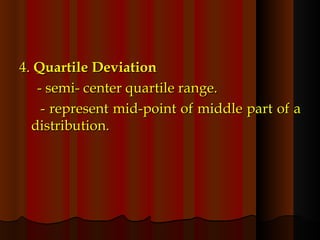
- 96. 4. Quartile Deviation - semi- center quartile range. - represent mid-point of middle part of a distribution.
- 97. FORMULA: UNGROUPED DATA: QD = Q3 – Q1 2
- 98. Chapter 4
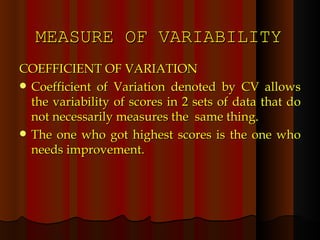
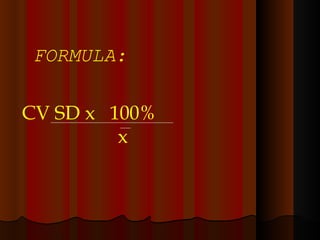
- 99. MEASURE OF VARIABILITY COEFFICIENT OF VARIATION Coefficient of Variation denoted by CV allows the variability of scores in 2 sets of data that do not necessarily measures the same thing. The one who got highest scores is the one who needs improvement.
- 100. FORMULA: CV SD x 100% x
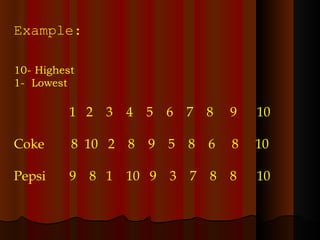
- 101. 1 2 3 4 5 6 7 8 9 10 Coke 8 10 2 8 9 5 8 6 8 10 Pepsi 9 8 1 10 9 3 7 8 8 10 Example: 10- Highest 1- Lowest
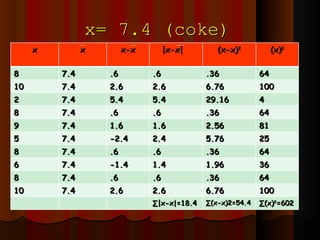
- 102. x= 7.4 (coke) x x x-x |x-x| (x-x) 2 (x) 2 8 7.4 .6 .6 .36 64 10 7.4 2.6 2.6 6.76 100 2 7.4 5.4 5.4 29.16 4 8 7.4 .6 .6 .36 64 9 7.4 1.6 1.6 2.56 81 5 7.4 -2.4 2.4 5.76 25 8 7.4 .6 .6 .36 64 6 7.4 -1.4 1.4 1.96 36 8 7.4 .6 .6 .36 64 10 7.4 2.6 2.6 6.76 100 ∑ |x-x|=18.4 ∑ (x-x)2=54.4 ∑ (x) 2 =602
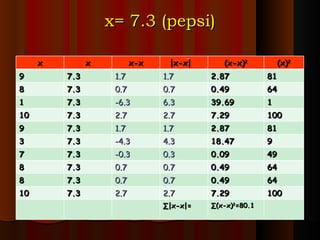
- 103. x= 7.3 (pepsi) x x x-x |x-x| (x-x) 2 (x) 2 9 7.3 1.7 1.7 2.87 81 8 7.3 0.7 0.7 0.49 64 1 7.3 -6.3 6.3 39.69 1 10 7.3 2.7 2.7 7.29 100 9 7.3 1.7 1.7 2.87 81 3 7.3 -4.3 4.3 18.47 9 7 7.3 -0.3 0.3 0.09 49 8 7.3 0.7 0.7 0.49 64 8 7.3 0.7 0.7 0.49 64 10 7.3 2.7 2.7 7.29 100 ∑ |x-x|= ∑ (x-x) 2 =80.1
- 104. Coke CV= 204585 x 100% 7.4 CV = SD x 100% x SD= ∑(x-x) 2 n-1 = 54.4 9 = √6.04 SD= 2.4585 CV= 33.2229%
- 105. SD= ∑(x-x) 2 n-1 Pepsi = 80.1 10-1 = 80.1 9 = √ 8.9 SD = 2.9833 SD2= 8.9
- 106. DECISION: Pepsi needs more improvement than coke in terms of taste
- 107. A distribution of 2 different units is given to compare in dispersion of heights versus in dispersion of weights. The mean height is 5.70 feet with SD = 0.9 ft. The mean weight is 72.5 kg with SD = 801 kg. Compare the dispersion in heights and in weights. CV = SD x 100% x = 0.9 x 100% 5.7 = 0.15789 = 15.7985% CV = SD x 100% x = 8.1 x 10% 72.5 = 0.111724 = 11.1724% HEIGHTS WEIGHTS
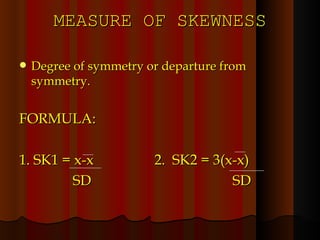
- 108. MEASURE OF SKEWNESS Degree of symmetry or departure from symmetry. FORMULA: 1. SK1 = x-x 2. SK2 = 3(x-x) SD SD
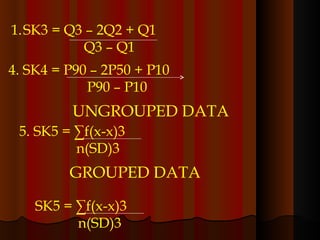
- 109. SK3 = Q3 – 2Q2 + Q1 Q3 – Q1 4. SK4 = P90 – 2P50 + P10 P90 – P10 5. SK5 = ∑f(x-x)3 n(SD)3 UNGROUPED DATA GROUPED DATA SK5 = ∑f(x-x)3 n(SD)3
- 110. Negatively Skewed Distribution (all negative) Positively Skewed Distribution (all positive)
- 111. Normal Distribution = 0
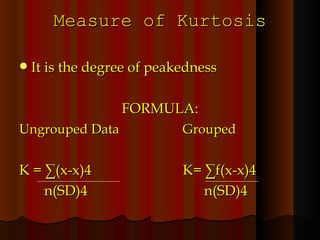
- 112. Measure of Kurtosis It is the degree of peakedness FORMULA: Ungrouped Data Grouped K = ∑(x-x)4 K= ∑f(x-x)4 n(SD)4 n(SD)4
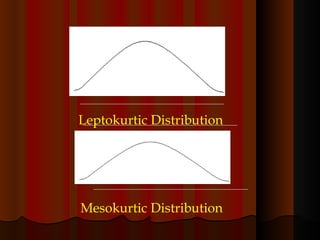
- 113. Leptokurtic Distribution Mesokurtic Distribution
- 115. Chapter 5
- 116. 5.1 PRINCIPLE OF COUNTING This section aims to: State and illustrate the principle of counting; Diagram the computations involving the principle of counting; and Apply the principle of counting in various area of problem solving.
- 117. Principle of Counting If a choice of 2 steps of which the first can be made in n1 ways and a second can be made in n2 ways, then the whole choice can be made by n1 n2 ways.
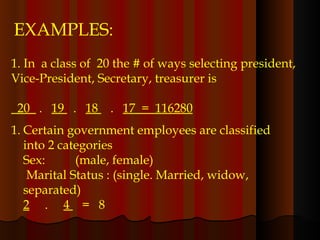
- 118. 1. In a class of 20 the # of ways selecting president, Vice-President, Secretary, treasurer is 20 . 19 . 18 . 17 = 116280 Certain government employees are classified into 2 categories Sex: (male, female) Marital Status : (single. Married, widow, separated) 2 . 4 = 8 EXAMPLES:
- 119. GENERALIZATION OF PRINCIPLE OF COUNTING If a choice has k steps of which the first can be made ian N1 ways, of which each of these 2 nd can be made in n2 ways…. 3 rd of which of these kth can be made… in nk which then the whole choice can be made by n1 . n2 . nk(ways)
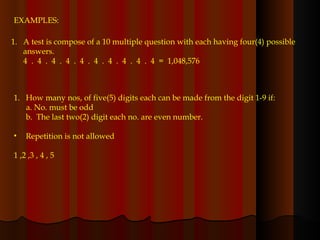
- 120. EXAMPLES: A test is compose of a 10 multiple question with each having four(4) possible answers. 4 . 4 . 4 . 4 . 4 . 4 . 4 . 4 . 4 . 4 = 1,048,576 How many nos, of five(5) digits each can be made from the digit 1-9 if: a. No. must be odd b. The last two(2) digit each no. are even number. Repetition is not allowed 1 ,2 ,3 , 4 , 5
- 121. 5.2 Permutations This section aims to: Define and illustrate permutations Apply permutations in various situational conditions; and State and illustrate the circular permutation.
- 122. PERMUTATIONS Arrangement of group of things in a definite order that is, there is a 1 st element, 2 nd element, 3 rd element etc. In other words, the order of arrangement of an element is important.
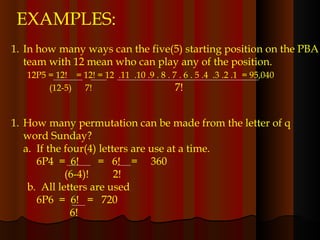
- 123. EXAMPLES: In how many ways can the five(5) starting position on the PBA team with 12 mean who can play any of the position. 12P5 = 12! = 12! = 12 .11 .10 .9 . 8 . 7 . 6 . 5 .4 .3 .2 .1 = 95,040 (12-5) 7! 7! How many permutation can be made from the letter of q word Sunday? a. If the four(4) letters are use at a time. 6P4 = 6! = 6! = 360 (6-4)! 2! b. All letters are used 6P6 = 6! = 720 6!
- 124. FORMULAS: 1 ST Formula: the number if permutation n things taken n at a time is nPn=n!
- 125. CIRCULAR PERMUTATION The permutation that occur by arranging objects in a circle are called circular permutation… P = (n-1)!
- 126. COMBINATION A combination also concerns arrangement but without regards to order. This means that the order or arrangement in which the element are taken is not important. nCr = n! r!(n-1)!
- 127. The End
- 128. Thank You!
- 129. Presenters: Mary Ann Frogosa Mary Ann Mosquerra BOA IV-1