SlideShare a Scribd company logo
3
Most read
9
Most read
10
Most read
Introduction to
Statistics
Pooja Yadav,
Research Scholar
Curaj, Ajmer
Satyender Yadav
Research Scholar,
UCCMS, MLSU, Udaipur
Topics to be covered
Introduction to statistics.
Types of statistics.
Data measurement.
Levels of measurement.
Important statistical terms.
INTRODUCTION
• The word statistics conveys a variety of meaning to people in
different walks of life.
The word statistics comes from the Italian words Statista
meaning STATEMENT
The German word Statistik meaning POLITICAL STATE
Statistics is a branch of scientific methods used in dealing with
phenomena that can be described numerically either by count or
by measurement.
INTRODUCTION
• Statistics refers to dealing with quantitative information. A
branch of mathematics which deals with gathering,
organizing, analyzing, and interpreting numerical data.
• Statistics is the sciences and art of dealing with figure and
facts.
• Father of statistics is GOTTFRIED ARCHENWALL.
DEFINITIONS
Definitions –
• Webster’s Third New International Dictionary gives a
comprehensive definition of statistics as a science dealing
with the collection, analysis, interpretation and presentation of
numerical data.
• According to W.I. King – “The science of statistics is the
method of judging collection, natural or social phenomena
from the results obtained from the analysis or enumeration or
collection of estimates.”
FEATURES OF STATISTICS
1. It is aggregated of facts.
2. Numerically expressed (Quantitative).
3. Affected to a marked extent by multiplicity of causes.
4. Estimated according to reasonable standard of accuracy.
5. Collecting data in a systematic manner.
6. Statistics are collected for a predetermined purpose, well defined &
specific.
7. Should be placed in relation to each other.
8. Data can’t be expressed in qualitative form.
STATEMENT
• All Statistics are numerical statements (data) but
all numerical statements (data) are not statistics.
• E.g. Ram has 100 Rs. In his pocket is not
statistics. The average age of 5th class is 10 yrs. is a
statistical concept.
TYPES OF STATISTICS
Descriptive
statistics Inferential
statistics
Statistics can be divided into two branches: Descriptive statistics and
Inferential statistics.
DESCRIPTIVE STATISTICS
Descriptive statistics- Descriptive statistics results from gathering data
from a body, group, or population and reaching conclusions only
about that particular group or population.
For example-
If an instructor produces statistics to summarize a class’s
examination effort and uses those statistics to reach conclusions
about that class only, the statistics are descriptive.
INFERENTIAL STATISTICS
Inferential statistics- Sample is collected from the group or
population and statistics is used to reach conclusions about the
group or population from which the sample was taken, this statistics
is called inferential statistics.
For example-
Testing of new drug on a small sample of patients to reach the
conclusions about the drug and make inferences about the
population.
INFERENTIAL STATISTICS
• Two major types of inferential statistics are:
Parametric
Statistics
Non-Parametric
Statistics
INFERENTIAL STATISTICS
• Parametric Statistics: Certain assumptions are made about
the distribution of the data. Only Interval and Ratio data are
used in parametric statistics .
• Non-Parametric Statistics: When there is no assumptions
made about the distribution of the data. Only Nominal and
Ordinal data are used in non-parametric statistics .
DATA MEASUREMENT
Scaling is an extension of the concept of measurement. It is said
the result of measurement is a scale comprises of set of numerals
on which an object score is placed using a certain rule of
assignment.
According to Adward
• “Scaling is a procedure for the assignment of numbers to a
property of objects in order to impart some of characteristics
of numbers to the properties in question”.
LEVELS OF DATA MEASUREMENT
Four levels of data measurement as follow:
Measurement
Nominal Ordinal Interval Ratio
LEVELS OF
MEASUREMENT
NOMINAL LEVEL
• Nominal Level :- The lowest level of data measurement is the
nominal level. Nominal level data measurement is used to
define data as numbers, alphabets or symbols without any
quantitative value. Numbers representing nominal level data
can be used only to classify or categorize.
Examples: Employee identification numbers. The numbers
are used to differentiate employees and not to make a value
statement about them.
ORDINAL LEVEL
• Ordinal Level :- Ordinal level data measurement is higher
than the nominal level. Ordinal level measurement can be
used to rank, order or give preference to the objects.
For example: Using ordinal data, a supervisor can evaluate
three employees by ranking their productivity with the
numbers 1 to 3.
INTERVAL LEVEL
• Interval Level :- Interval level data measurement is the next
to the highest level of data in which the distances between
consecutive numbers have meaning and the data are always
numerical. The distances represented by the differences
between consecutive numbers are equal; i.e. interval data
have equal intervals.
For example, when we measure temperature (in Fahrenheit),
the distance from 30-40 is same as distance from 70-80
RATIO LEVEL
Ratio Level :- Ratio level data measurement is the highest level
of data measurement. Ratio data have the same properties as
interval data, but ratio data have an absolute zero and the ratio of
two numbers is meaningful. The value of zero can not be
arbitrarily assigned because it represent a fixed point.
Examples of ratio data are height, weight, time, volume etc.
Note: Ratio scale is also the part of interval scale. Interval scale
ranges from negative to positive while the ratio scale starts
from positive i.e. zero “0”.
COMPARISON…
Descripti
on
Order/
Preference
Interval Base
“0”
Examples Tests
Nominal *** Frequency %,
Chi-square
Ordinal *** *** Mode, Median
Interval *** **** *** 0C, 0F AM, GM
Regression, Anova
Ratio *** *** *** *** Age,
weight, 0F,
Kelvin
AM, GM
Regression
IMPORTANT
STATISTICAL TERMS
1. Population- Population is a collection of persons, objects or items
of interest.
2. Census- A process of gathering data from the whole population for
a given measurement of interest.
3. Sample- A sample is a portion of the whole population. A sample
represents the whole population.
4. Parameter- A descriptive measure of the population is called a
parameter. Parameters are usually denoted by Greek letters.
Examples of parameters are population mean (μ), population
variance (σ2) and population standard deviation (σ).
• Statistic- A descriptive measure of a sample is called a statistic.
Statistic are usually denoted by Roman letters. Example of statistics
are sample mean(x̄ ), sample variance(s2) and sample standard
variation (s).
Process of Inferential Statistics to estimate a Population mean (μ)
Calculate (x̄ ) to estimate (μ)
Select a random Sample
Population (μ)
(Parameter)
Sample (x̄ )
(Statistics)
IMPORTANT
STATISTICAL TERMS
For any query, doubt and help please mail us at:
pujayadav026@gmail.com
yadavsatyender724@gmail.com

More Related Content

What's hot (20)

PPTX
Type of data
Amit Sharma
 
PPTX
Statistics
Pranav Krishna
 
PPTX
Types of random sampling
Studying
 
PPTX
Descriptive and Inferential Statistics
Danica Antiquina
 
PPTX
Sampling techniques
Dr. Ankita Chaturvedi
 
PPT
Testing of hypothesis
Jags Jagdish
 
PPTX
Tabulation of data
RekhaChoudhary24
 
PPTX
Normal distribution
Marjorie Rice
 
PPTX
Measurement scales
Usra Hasan
 
PPTX
coefficient correlation
irshad narejo
 
PPTX
processng and analysis of data
Aruna Poddar
 
PPTX
Type i and type ii errors
p24ssp
 
PPTX
Measurement Scales in Research
Dr. Sarita Anand
 
DOCX
descriptive and inferential statistics
Mona Sajid
 
PPTX
Statistics "Descriptive & Inferential"
Dalia El-Shafei
 
PPSX
Inferential statistics.ppt
Nursing Path
 
PPTX
Population vs sample
5829591
 
PPTX
Population & sample lecture 04
DrZahid Khan
 
PPT
The sampling distribution
Harve Abella
 
PPTX
Cumulative frequency
MrGarvey
 
Type of data
Amit Sharma
 
Statistics
Pranav Krishna
 
Types of random sampling
Studying
 
Descriptive and Inferential Statistics
Danica Antiquina
 
Sampling techniques
Dr. Ankita Chaturvedi
 
Testing of hypothesis
Jags Jagdish
 
Tabulation of data
RekhaChoudhary24
 
Normal distribution
Marjorie Rice
 
Measurement scales
Usra Hasan
 
coefficient correlation
irshad narejo
 
processng and analysis of data
Aruna Poddar
 
Type i and type ii errors
p24ssp
 
Measurement Scales in Research
Dr. Sarita Anand
 
descriptive and inferential statistics
Mona Sajid
 
Statistics "Descriptive & Inferential"
Dalia El-Shafei
 
Inferential statistics.ppt
Nursing Path
 
Population vs sample
5829591
 
Population & sample lecture 04
DrZahid Khan
 
The sampling distribution
Harve Abella
 
Cumulative frequency
MrGarvey
 

Similar to Introduction to statistics (20)

PPT
Thiyagu statistics
Thiyagu K
 
PPTX
Basic statistics
Ganesh Raju
 
PPT
Final Lecture - 1.ppt
ssuserbe1d97
 
PPTX
Chapter 1 of the book Basic Statistics as described by teacher
karamjit18
 
PPTX
543957106-Introduction-Basic-Concepts-in-Statistics-PPT - Copy.pptx
ssuser46ca42
 
PPTX
Introduction to statistics
babyboomer13
 
PDF
Biostatistics ppt.pdf
AbdulrezakHusein
 
PDF
Module 1 introduction to statistics
Christine Concordia
 
PPTX
Stats LECTURE 1.pptx
KEHKASHANNIZAM
 
PPTX
Statistics.pptx
lavanya209529
 
PPTX
Biostatistics ppt.pptx
GammachuuTarrafaa
 
PPTX
introduction to statistics
mirabubakar1
 
PPTX
Biostatistics ppt.pptx teaching handout of statistics
Dawitgkidan
 
PPTX
Introduction to statistics.pptx
Unfold1
 
PDF
Chapter-1 Introduction to Statistics.pdf
TaraRijal
 
PPT
Inferential statistics
Vikash Kumar Bibhakar
 
PPTX
Unit #1.Introduction to Biostatistics.pptx
MuhammadAli413741
 
PPTX
Business Statistics unit 1.pptx
shivank49
 
PPTX
Introduction to Statistics in Nursing.
Johny Kutty Joseph
 
PPT
what is statistics? Mc Graw Hills/Irwin
Maryam Xahra
 
Thiyagu statistics
Thiyagu K
 
Basic statistics
Ganesh Raju
 
Final Lecture - 1.ppt
ssuserbe1d97
 
Chapter 1 of the book Basic Statistics as described by teacher
karamjit18
 
543957106-Introduction-Basic-Concepts-in-Statistics-PPT - Copy.pptx
ssuser46ca42
 
Introduction to statistics
babyboomer13
 
Biostatistics ppt.pdf
AbdulrezakHusein
 
Module 1 introduction to statistics
Christine Concordia
 
Stats LECTURE 1.pptx
KEHKASHANNIZAM
 
Statistics.pptx
lavanya209529
 
Biostatistics ppt.pptx
GammachuuTarrafaa
 
introduction to statistics
mirabubakar1
 
Biostatistics ppt.pptx teaching handout of statistics
Dawitgkidan
 
Introduction to statistics.pptx
Unfold1
 
Chapter-1 Introduction to Statistics.pdf
TaraRijal
 
Inferential statistics
Vikash Kumar Bibhakar
 
Unit #1.Introduction to Biostatistics.pptx
MuhammadAli413741
 
Business Statistics unit 1.pptx
shivank49
 
Introduction to Statistics in Nursing.
Johny Kutty Joseph
 
what is statistics? Mc Graw Hills/Irwin
Maryam Xahra
 
Ad

More from ScholarsPoint1 (7)

PPTX
Factors affecting organisational structure
ScholarsPoint1
 
PPTX
Organisational structure
ScholarsPoint1
 
PPTX
Motivation
ScholarsPoint1
 
PPTX
Discrete distributions: Binomial, Poisson & Hypergeometric distributions
ScholarsPoint1
 
PPTX
Probability
ScholarsPoint1
 
PPTX
Measures of Central Tendency, Variability and Shapes
ScholarsPoint1
 
PPTX
Charts and graphs
ScholarsPoint1
 
Factors affecting organisational structure
ScholarsPoint1
 
Organisational structure
ScholarsPoint1
 
Motivation
ScholarsPoint1
 
Discrete distributions: Binomial, Poisson & Hypergeometric distributions
ScholarsPoint1
 
Probability
ScholarsPoint1
 
Measures of Central Tendency, Variability and Shapes
ScholarsPoint1
 
Charts and graphs
ScholarsPoint1
 
Ad

Recently uploaded (20)

PDF
Boardsi - A Staunch Supporter Of Veterans
Boardsi
 
PPTX
Cruise API Provider | Amadeus Cruise API | Cruise Software
anusharajraj21
 
PDF
Easypromo AI Review: Revolutionizing Digital Promotions with Artificial Intel...
Larry888358
 
PDF
Corporate Governance for South African Mining Companies (a practitioner's view).
James AH Campbell
 
PDF
Camil Institutional Presentation_Jun25.pdf
CAMILRI
 
PDF
Tech Meets Tradition Why Lucknow Is Perfect for Setting Up GCC
Inductus GCC
 
PDF
taking-action-on-nature-webinar-slides.pdf
ybhyrfp5t2
 
PDF
Steve Milne Equestrian - A Master Horse Trainer
Steve Milne Equestrian
 
PDF
Stuart Frost - An Accomplished CEO
Stuart Frost
 
PDF
Seven Causes of SMS Delivery Issues and Solutions for 2025.pdf
nusrat889955
 
PDF
Chembond Chemicals Limited Presentation 2025
Chembond Chemicals Limited
 
PDF
How to Buy Tally on Cloud in 2025: Step-by-Step Guide for Businesses
DanaJohnson510230
 
DOCX
Oleg Belay: biography, strategy, and business philosophy of the leader of TRI...
trinfico
 
PDF
Event Report - AWS Summit NYC - AgentCore, Kiro and S3 Venctors
Holger Mueller
 
PDF
Patrick Dwyer Merrill Lynch - A Governing Board Director
Patrick Dwyer Merrill Lynch
 
PPTX
Marketing Presentations - How to do them
Jaime Ernesto Portillo De la O
 
PDF
ETT OUTLET One Token Endless Possibilities PDF
ettoutllet
 
PPTX
QuickBooks Database Server Manager.pptx a
seoczaranshu
 
PDF
Best SMO Services in India | Seo Strikers
SEO Strikers
 
PPTX
PwC Final PPT.pptx pitch Deck presentation
rafinrowshan
 
Boardsi - A Staunch Supporter Of Veterans
Boardsi
 
Cruise API Provider | Amadeus Cruise API | Cruise Software
anusharajraj21
 
Easypromo AI Review: Revolutionizing Digital Promotions with Artificial Intel...
Larry888358
 
Corporate Governance for South African Mining Companies (a practitioner's view).
James AH Campbell
 
Camil Institutional Presentation_Jun25.pdf
CAMILRI
 
Tech Meets Tradition Why Lucknow Is Perfect for Setting Up GCC
Inductus GCC
 
taking-action-on-nature-webinar-slides.pdf
ybhyrfp5t2
 
Steve Milne Equestrian - A Master Horse Trainer
Steve Milne Equestrian
 
Stuart Frost - An Accomplished CEO
Stuart Frost
 
Seven Causes of SMS Delivery Issues and Solutions for 2025.pdf
nusrat889955
 
Chembond Chemicals Limited Presentation 2025
Chembond Chemicals Limited
 
How to Buy Tally on Cloud in 2025: Step-by-Step Guide for Businesses
DanaJohnson510230
 
Oleg Belay: biography, strategy, and business philosophy of the leader of TRI...
trinfico
 
Event Report - AWS Summit NYC - AgentCore, Kiro and S3 Venctors
Holger Mueller
 
Patrick Dwyer Merrill Lynch - A Governing Board Director
Patrick Dwyer Merrill Lynch
 
Marketing Presentations - How to do them
Jaime Ernesto Portillo De la O
 
ETT OUTLET One Token Endless Possibilities PDF
ettoutllet
 
QuickBooks Database Server Manager.pptx a
seoczaranshu
 
Best SMO Services in India | Seo Strikers
SEO Strikers
 
PwC Final PPT.pptx pitch Deck presentation
rafinrowshan
 

Introduction to statistics

  • 1. Introduction to Statistics Pooja Yadav, Research Scholar Curaj, Ajmer Satyender Yadav Research Scholar, UCCMS, MLSU, Udaipur
  • 2. Topics to be covered Introduction to statistics. Types of statistics. Data measurement. Levels of measurement. Important statistical terms.
  • 3. INTRODUCTION • The word statistics conveys a variety of meaning to people in different walks of life. The word statistics comes from the Italian words Statista meaning STATEMENT The German word Statistik meaning POLITICAL STATE Statistics is a branch of scientific methods used in dealing with phenomena that can be described numerically either by count or by measurement.
  • 4. INTRODUCTION • Statistics refers to dealing with quantitative information. A branch of mathematics which deals with gathering, organizing, analyzing, and interpreting numerical data. • Statistics is the sciences and art of dealing with figure and facts. • Father of statistics is GOTTFRIED ARCHENWALL.
  • 5. DEFINITIONS Definitions – • Webster’s Third New International Dictionary gives a comprehensive definition of statistics as a science dealing with the collection, analysis, interpretation and presentation of numerical data. • According to W.I. King – “The science of statistics is the method of judging collection, natural or social phenomena from the results obtained from the analysis or enumeration or collection of estimates.”
  • 6. FEATURES OF STATISTICS 1. It is aggregated of facts. 2. Numerically expressed (Quantitative). 3. Affected to a marked extent by multiplicity of causes. 4. Estimated according to reasonable standard of accuracy. 5. Collecting data in a systematic manner. 6. Statistics are collected for a predetermined purpose, well defined & specific. 7. Should be placed in relation to each other. 8. Data can’t be expressed in qualitative form.
  • 7. STATEMENT • All Statistics are numerical statements (data) but all numerical statements (data) are not statistics. • E.g. Ram has 100 Rs. In his pocket is not statistics. The average age of 5th class is 10 yrs. is a statistical concept.
  • 8. TYPES OF STATISTICS Descriptive statistics Inferential statistics Statistics can be divided into two branches: Descriptive statistics and Inferential statistics.
  • 9. DESCRIPTIVE STATISTICS Descriptive statistics- Descriptive statistics results from gathering data from a body, group, or population and reaching conclusions only about that particular group or population. For example- If an instructor produces statistics to summarize a class’s examination effort and uses those statistics to reach conclusions about that class only, the statistics are descriptive.
  • 10. INFERENTIAL STATISTICS Inferential statistics- Sample is collected from the group or population and statistics is used to reach conclusions about the group or population from which the sample was taken, this statistics is called inferential statistics. For example- Testing of new drug on a small sample of patients to reach the conclusions about the drug and make inferences about the population.
  • 11. INFERENTIAL STATISTICS • Two major types of inferential statistics are: Parametric Statistics Non-Parametric Statistics
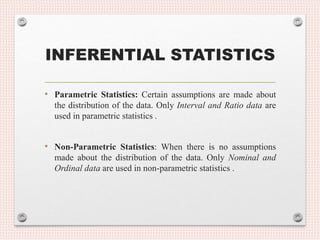
  • 12. INFERENTIAL STATISTICS • Parametric Statistics: Certain assumptions are made about the distribution of the data. Only Interval and Ratio data are used in parametric statistics . • Non-Parametric Statistics: When there is no assumptions made about the distribution of the data. Only Nominal and Ordinal data are used in non-parametric statistics .
  • 13. DATA MEASUREMENT Scaling is an extension of the concept of measurement. It is said the result of measurement is a scale comprises of set of numerals on which an object score is placed using a certain rule of assignment. According to Adward • “Scaling is a procedure for the assignment of numbers to a property of objects in order to impart some of characteristics of numbers to the properties in question”.
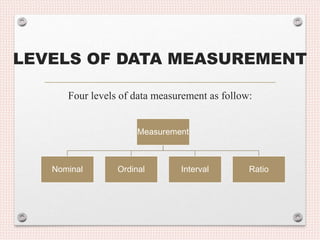
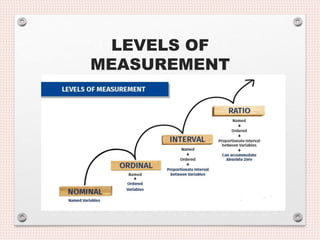
  • 14. LEVELS OF DATA MEASUREMENT Four levels of data measurement as follow: Measurement Nominal Ordinal Interval Ratio
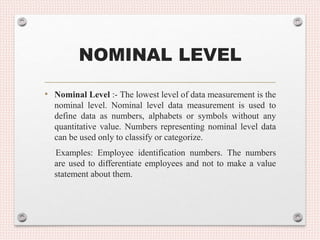
  • 16. NOMINAL LEVEL • Nominal Level :- The lowest level of data measurement is the nominal level. Nominal level data measurement is used to define data as numbers, alphabets or symbols without any quantitative value. Numbers representing nominal level data can be used only to classify or categorize. Examples: Employee identification numbers. The numbers are used to differentiate employees and not to make a value statement about them.
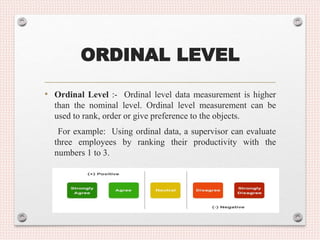
  • 17. ORDINAL LEVEL • Ordinal Level :- Ordinal level data measurement is higher than the nominal level. Ordinal level measurement can be used to rank, order or give preference to the objects. For example: Using ordinal data, a supervisor can evaluate three employees by ranking their productivity with the numbers 1 to 3.
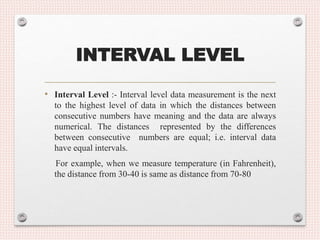
  • 18. INTERVAL LEVEL • Interval Level :- Interval level data measurement is the next to the highest level of data in which the distances between consecutive numbers have meaning and the data are always numerical. The distances represented by the differences between consecutive numbers are equal; i.e. interval data have equal intervals. For example, when we measure temperature (in Fahrenheit), the distance from 30-40 is same as distance from 70-80
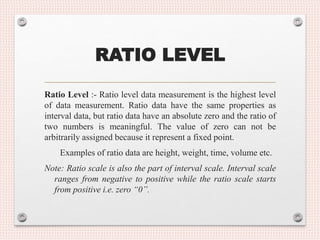
  • 19. RATIO LEVEL Ratio Level :- Ratio level data measurement is the highest level of data measurement. Ratio data have the same properties as interval data, but ratio data have an absolute zero and the ratio of two numbers is meaningful. The value of zero can not be arbitrarily assigned because it represent a fixed point. Examples of ratio data are height, weight, time, volume etc. Note: Ratio scale is also the part of interval scale. Interval scale ranges from negative to positive while the ratio scale starts from positive i.e. zero “0”.
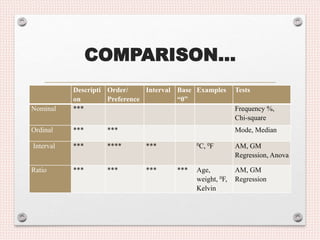
  • 20. COMPARISON… Descripti on Order/ Preference Interval Base “0” Examples Tests Nominal *** Frequency %, Chi-square Ordinal *** *** Mode, Median Interval *** **** *** 0C, 0F AM, GM Regression, Anova Ratio *** *** *** *** Age, weight, 0F, Kelvin AM, GM Regression
  • 21. IMPORTANT STATISTICAL TERMS 1. Population- Population is a collection of persons, objects or items of interest. 2. Census- A process of gathering data from the whole population for a given measurement of interest. 3. Sample- A sample is a portion of the whole population. A sample represents the whole population. 4. Parameter- A descriptive measure of the population is called a parameter. Parameters are usually denoted by Greek letters. Examples of parameters are population mean (μ), population variance (σ2) and population standard deviation (σ).
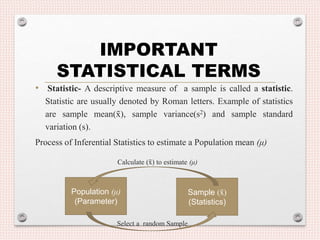
  • 22. • Statistic- A descriptive measure of a sample is called a statistic. Statistic are usually denoted by Roman letters. Example of statistics are sample mean(x̄ ), sample variance(s2) and sample standard variation (s). Process of Inferential Statistics to estimate a Population mean (μ) Calculate (x̄ ) to estimate (μ) Select a random Sample Population (μ) (Parameter) Sample (x̄ ) (Statistics) IMPORTANT STATISTICAL TERMS
  • 23. For any query, doubt and help please mail us at: pujayadav026@gmail.com yadavsatyender724@gmail.com