SlideShare a Scribd company logo
Introduction to
statistics
By Dr. Amira Talic
What is “Statistics”?
•
•
•
•
•
•

•Statistics is the science of data that involves:
•Collecting
•Classifying
•Summarizing
•Organizing and
•Interpretation

•
•
•
•
•
•
•

Of numerical information.
•Examples:
•Cricket batting averages
•Stock price
•Climatology data such as rainfall amounts, average temperatures
•Marketing information
•Gambling?
Key Terms
• What is Data?
facts or information that is relevant or
appropriate to a decision maker
• Population?
•the totality of objects under consideration
• Sample?
•a portion of the population that is selected
for analysis
Key Terms
• Parameter?
a summary measure (e.g., mean) that is
computed to describe a characteristic of
the population
• Statistic?
a summary measure (e.g., mean) that is
computed to describe a characteristic of
the sample
Variables
• Traits or characteristics that can change
values from case to case.
• A variable is what is measured or
manipulated in an experiment
•Examples:
•Age
•Gender
•Income
•Social class
Types Of Variables
• In causal relationships:
• CAUSE =>EFFECT
independent variable & dependent variable
•Independent variable: is a variable that can be
controlled or manipulated.
An independent variable is the variable you have control
over (dose of drug)
•Dependent variable: is a variable that cannot be
controlled or manipulated. Its values are predicted
from the independent variable ( effect on the
condition)
Types Of Variables
•Discrete variables are measured in units
that cannot be subdivided. Example:
Number of children
•Continuous variables are measured in a
unit that can be subdivided infinitely.
Example: Height
Statistical analysis
• Descriptive Statistics
• Inferential statistics
• Predictive modeling
Descriptive Statistics
•Gives us the overall picture about data
•Presents data in the form of tables, charts and
graphs
•Includes summary data
•Avoids inferences
Examples:
•Measures of central location
Mean, median, mode and midrange
•Measures of Variation
•Variance, Standard Deviation, z-scores
Inferential Statistics
•Take decision on overall population using a
sample
• “Sampled” data are incomplete but can still
be representative of the population
•Permits the making of generalizations
(inferences) about the data
• Probability theory is a major tool used
to analyze sampled data
Predictive Modeling
• The science of predicting future outcomes
based on historical events.
• Model Building: “Developing set of
equations or mathematical formulation to
forecast future behaviors based on current
or historical data.”
• Regression, logistic Regression, time
series analysis etc.,
Calculation of the probability
• Based on the characteristics of the
population for the observed parameter
• (e.g. . Duration of the pregnancy, duration
of the first labor stage, height, et cetera)
• To describe the population, “distribution”
will be used
Distribution
• A statistical distribution describes the
numbers of times each possible outcome
occurs in a sample
• Distributions for continuous variables are
called continuous distributions ( e.g.
height)
• They also carry the fancier
name probability density
Distribution
• Some probability densities have particular
importance in statistics. A very important
one is shaped like a bell, and called
the normal ( Gaussian) distribution.
• Many naturally-occurring phenomena can
be approximated surprisingly well by this
distribution. It will serve to illustrate some
features of all continuous distributions.
Gaussian distribution
What are the Components of A
Distribution?
• Measures of central tendency
• Suppose we have a sample with 4
observations: 4, 1, 4, 3
• Mean = the sum of a set of numbers divided
by the number of observations
(4+1+4+3=12:4=3)
Median - the middle point of a set of
numbers(3.5)
Components of distribution
• Mode - the most frequently occurring
number. Mode=4
• Median - the middle point of a set of
numbers(3.5)
Components of distribution
Measures of variation
Range - the maximum value minus the
minimum value in a set of numbers.
Range = 4-1 = 3
Standard Deviation - the average
distance a data point is away from the
mean.
[ (4- 3)+( 1 -3)+ (4- 3)+ (3- 3)]: 4=1
standard deviation= 1
Standard deviation
Why to know about it ?
• Mean, Median, Mode, Range, and
Standard Deviations are measurements in
a sample (statistics) and can
also be used to make inferences on a
population.
What do we expect from the
statistical analysis?
• To find out whether there is a statistically
significant difference between our sample
(e.g. pregnancy loss in Al Ain Hospital
Patient) and general population
How to perform the statistical
analysis?
• Statistics can take us to a beautiful journey
of understanding ,but
Festina lente! make haste slowly
Introduction to statistics

More Related Content

What's hot (20)

PPTX
Statistics:Fundamentals Of Statistics
St Mary's College,Thrissur,Kerala
 
PPTX
Descriptive statistics
University of Jaffna
 
PPT
Introduction to statistics
Andi Koentary
 
PPTX
Data Display and Summary
DrZahid Khan
 
PPT
Basic Statistical Concepts and Methods
Ahmed-Refat Refat
 
PPT
Descriptive statistics
Aiden Yeh
 
PPTX
Statistics "Descriptive & Inferential"
Dalia El-Shafei
 
PPTX
INFERENTIAL STATISTICS: AN INTRODUCTION
John Labrador
 
PPTX
Measures of central tendancy
Pranav Krishna
 
PPTX
Basics of Educational Statistics (Descriptive statistics)
HennaAnsari
 
PPTX
Basics of statistics
donthuraj
 
PPTX
introduction to statistics
mirabubakar1
 
PPT
Descriptive statistics
Hiba Armouche
 
PPT
Graeco Latin Square Design
NadeemAltaf2
 
PPT
Statistical Methods
guest9fa52
 
PPTX
Basic biostatistics dr.eezn
EhealthMoHS
 
PPT
Measurement scales
Aiden Yeh
 
PPTX
Descriptive Statistics
Bhagya Silva
 
PDF
Introduction to Statistics
aan786
 
PPTX
Descriptive Statistics
Neny Isharyanti
 
Statistics:Fundamentals Of Statistics
St Mary's College,Thrissur,Kerala
 
Descriptive statistics
University of Jaffna
 
Introduction to statistics
Andi Koentary
 
Data Display and Summary
DrZahid Khan
 
Basic Statistical Concepts and Methods
Ahmed-Refat Refat
 
Descriptive statistics
Aiden Yeh
 
Statistics "Descriptive & Inferential"
Dalia El-Shafei
 
INFERENTIAL STATISTICS: AN INTRODUCTION
John Labrador
 
Measures of central tendancy
Pranav Krishna
 
Basics of Educational Statistics (Descriptive statistics)
HennaAnsari
 
Basics of statistics
donthuraj
 
introduction to statistics
mirabubakar1
 
Descriptive statistics
Hiba Armouche
 
Graeco Latin Square Design
NadeemAltaf2
 
Statistical Methods
guest9fa52
 
Basic biostatistics dr.eezn
EhealthMoHS
 
Measurement scales
Aiden Yeh
 
Descriptive Statistics
Bhagya Silva
 
Introduction to Statistics
aan786
 
Descriptive Statistics
Neny Isharyanti
 

Viewers also liked (20)

PPTX
Introduction to Statistics
Saurav Shrestha
 
PDF
probability and statistics Chapter 1 (1)
abfisho
 
PPTX
Introduction to Statistics
Manish Purani
 
PPT
Introduction to Statistics
teena1991
 
PPT
Introduction to statistics
Charles Robles Balsita
 
PPTX
Statistics 1
Saed Jama
 
PPTX
Introduction to Statistics
Robert Tinaro
 
PPT
Statistics Introduction
Varadharajan Ramasamy
 
PPTX
Statistics assignment no. 1
Harshika Chauhan
 
PDF
Chapter 1 introduction to statistics
John Carlo Catacutan
 
PPTX
Introduction to statistics
Archana M
 
PPT
Introduction to statistics 1
Anwar Afridi
 
PPTX
Statistic in Daily Life
Abu Shaik saurab
 
PPT
Introduction to statistical terms
Dr Bryan Mills
 
PPT
Introduction to statistics 2013
Mohammad Ihmeidan
 
PPTX
Introduction to Statistics
Sr Edith Bogue
 
PPTX
Introduction to Statistics (Part -I)
YesAnalytics
 
PDF
Introduction to Statistics
Anjan Mahanta
 
PPT
Chapter 1 introduction to statistics for engineers 1 (1)
abfisho
 
PPT
Statistics
pikuoec
 
Introduction to Statistics
Saurav Shrestha
 
probability and statistics Chapter 1 (1)
abfisho
 
Introduction to Statistics
Manish Purani
 
Introduction to Statistics
teena1991
 
Introduction to statistics
Charles Robles Balsita
 
Statistics 1
Saed Jama
 
Introduction to Statistics
Robert Tinaro
 
Statistics Introduction
Varadharajan Ramasamy
 
Statistics assignment no. 1
Harshika Chauhan
 
Chapter 1 introduction to statistics
John Carlo Catacutan
 
Introduction to statistics
Archana M
 
Introduction to statistics 1
Anwar Afridi
 
Statistic in Daily Life
Abu Shaik saurab
 
Introduction to statistical terms
Dr Bryan Mills
 
Introduction to statistics 2013
Mohammad Ihmeidan
 
Introduction to Statistics
Sr Edith Bogue
 
Introduction to Statistics (Part -I)
YesAnalytics
 
Introduction to Statistics
Anjan Mahanta
 
Chapter 1 introduction to statistics for engineers 1 (1)
abfisho
 
Statistics
pikuoec
 
Ad

Similar to Introduction to statistics (20)

PPTX
STATISTICS.pptx for the scholars and students
ssuseref12b21
 
PPT
Bio statistics
Nc Das
 
PPTX
Introduction to statistics.pptx
MuddaAbdo1
 
PPTX
MMW (Data Management)-Part 1 for ULO 2 (1).pptx
PETTIROSETALISIC
 
PPTX
statistics.pptxghfhsahkjhsghkjhahkjhgfjkjkg
Central University of South Bihar
 
PPTX
An Overview of Basic Statistics
getyourcheaton
 
PPTX
Data Display and Summary
DrZahid Khan
 
PPT
Statistics-24-04-2021-20210618114031.ppt
RajnishSingh367990
 
PPT
Statistics-24-04-2021-20210618114031.ppt
JapnaamKaurAhluwalia
 
PPT
Statistics-24-04-2021-20210618114031.ppt
Akhtaruzzamanlimon1
 
PPT
businessstatistics-stat10022-200411201812.ppt
tejashreegurav243
 
PPT
Business statistics (Basics)
AhmedToheed3
 
PDF
Statistics and permeability engineering reports
wwwmostafalaith99
 
PPTX
Introduction to Statistics - Basic concepts
DocIbrahimAbdelmonaem
 
PPTX
DATA UNIT-3.pptx
bibha737
 
PDF
Engineering Statistics
Bahzad5
 
PPTX
PRESENTATION.pptx
MedicalEducation7
 
PPTX
presentaion-ni-owel.pptx
JareezRobios
 
PPTX
Rj Prashant's ppts on statistics
Rj Prashant Kumar Dwivedi
 
STATISTICS.pptx for the scholars and students
ssuseref12b21
 
Bio statistics
Nc Das
 
Introduction to statistics.pptx
MuddaAbdo1
 
MMW (Data Management)-Part 1 for ULO 2 (1).pptx
PETTIROSETALISIC
 
statistics.pptxghfhsahkjhsghkjhahkjhgfjkjkg
Central University of South Bihar
 
An Overview of Basic Statistics
getyourcheaton
 
Data Display and Summary
DrZahid Khan
 
Statistics-24-04-2021-20210618114031.ppt
RajnishSingh367990
 
Statistics-24-04-2021-20210618114031.ppt
JapnaamKaurAhluwalia
 
Statistics-24-04-2021-20210618114031.ppt
Akhtaruzzamanlimon1
 
businessstatistics-stat10022-200411201812.ppt
tejashreegurav243
 
Business statistics (Basics)
AhmedToheed3
 
Statistics and permeability engineering reports
wwwmostafalaith99
 
Introduction to Statistics - Basic concepts
DocIbrahimAbdelmonaem
 
DATA UNIT-3.pptx
bibha737
 
Engineering Statistics
Bahzad5
 
PRESENTATION.pptx
MedicalEducation7
 
presentaion-ni-owel.pptx
JareezRobios
 
Rj Prashant's ppts on statistics
Rj Prashant Kumar Dwivedi
 
Ad

Recently uploaded (20)

PDF
Are there government-backed agri-software initiatives in Limerick.pdf
giselawagner2
 
PPTX
Simplifying End-to-End Apache CloudStack Deployment with a Web-Based Automati...
ShapeBlue
 
PDF
Women in Automation Presents: Reinventing Yourself — Bold Career Pivots That ...
DianaGray10
 
PPTX
Top iOS App Development Company in the USA for Innovative Apps
SynapseIndia
 
PPTX
Building and Operating a Private Cloud with CloudStack and LINBIT CloudStack ...
ShapeBlue
 
PDF
Bitcoin+ Escalando sin concesiones - Parte 1
Fernando Paredes García
 
PDF
Building Resilience with Digital Twins : Lessons from Korea
SANGHEE SHIN
 
PDF
Apache CloudStack 201: Let's Design & Build an IaaS Cloud
ShapeBlue
 
PDF
SWEBOK Guide and Software Services Engineering Education
Hironori Washizaki
 
PDF
CIFDAQ Weekly Market Wrap for 11th July 2025
CIFDAQ
 
PDF
CloudStack GPU Integration - Rohit Yadav
ShapeBlue
 
PDF
Human-centred design in online workplace learning and relationship to engagem...
Tracy Tang
 
PDF
How Current Advanced Cyber Threats Transform Business Operation
Eryk Budi Pratama
 
PDF
Complete JavaScript Notes: From Basics to Advanced Concepts.pdf
haydendavispro
 
PDF
SFWelly Summer 25 Release Highlights July 2025
Anna Loughnan Colquhoun
 
PDF
Upskill to Agentic Automation 2025 - Kickoff Meeting
DianaGray10
 
PPT
Interview paper part 3, It is based on Interview Prep
SoumyadeepGhosh39
 
PDF
Meetup Kickoff & Welcome - Rohit Yadav, CSIUG Chairman
ShapeBlue
 
PDF
TrustArc Webinar - Data Privacy Trends 2025: Mid-Year Insights & Program Stra...
TrustArc
 
PDF
Novus Safe Lite- What is Novus Safe Lite.pdf
Novus Hi-Tech
 
Are there government-backed agri-software initiatives in Limerick.pdf
giselawagner2
 
Simplifying End-to-End Apache CloudStack Deployment with a Web-Based Automati...
ShapeBlue
 
Women in Automation Presents: Reinventing Yourself — Bold Career Pivots That ...
DianaGray10
 
Top iOS App Development Company in the USA for Innovative Apps
SynapseIndia
 
Building and Operating a Private Cloud with CloudStack and LINBIT CloudStack ...
ShapeBlue
 
Bitcoin+ Escalando sin concesiones - Parte 1
Fernando Paredes García
 
Building Resilience with Digital Twins : Lessons from Korea
SANGHEE SHIN
 
Apache CloudStack 201: Let's Design & Build an IaaS Cloud
ShapeBlue
 
SWEBOK Guide and Software Services Engineering Education
Hironori Washizaki
 
CIFDAQ Weekly Market Wrap for 11th July 2025
CIFDAQ
 
CloudStack GPU Integration - Rohit Yadav
ShapeBlue
 
Human-centred design in online workplace learning and relationship to engagem...
Tracy Tang
 
How Current Advanced Cyber Threats Transform Business Operation
Eryk Budi Pratama
 
Complete JavaScript Notes: From Basics to Advanced Concepts.pdf
haydendavispro
 
SFWelly Summer 25 Release Highlights July 2025
Anna Loughnan Colquhoun
 
Upskill to Agentic Automation 2025 - Kickoff Meeting
DianaGray10
 
Interview paper part 3, It is based on Interview Prep
SoumyadeepGhosh39
 
Meetup Kickoff & Welcome - Rohit Yadav, CSIUG Chairman
ShapeBlue
 
TrustArc Webinar - Data Privacy Trends 2025: Mid-Year Insights & Program Stra...
TrustArc
 
Novus Safe Lite- What is Novus Safe Lite.pdf
Novus Hi-Tech
 

Introduction to statistics

  • 2. What is “Statistics”? • • • • • • •Statistics is the science of data that involves: •Collecting •Classifying •Summarizing •Organizing and •Interpretation • • • • • • • Of numerical information. •Examples: •Cricket batting averages •Stock price •Climatology data such as rainfall amounts, average temperatures •Marketing information •Gambling?
  • 3. Key Terms • What is Data? facts or information that is relevant or appropriate to a decision maker • Population? •the totality of objects under consideration • Sample? •a portion of the population that is selected for analysis
  • 4. Key Terms • Parameter? a summary measure (e.g., mean) that is computed to describe a characteristic of the population • Statistic? a summary measure (e.g., mean) that is computed to describe a characteristic of the sample
  • 5. Variables • Traits or characteristics that can change values from case to case. • A variable is what is measured or manipulated in an experiment •Examples: •Age •Gender •Income •Social class
  • 6. Types Of Variables • In causal relationships: • CAUSE =>EFFECT independent variable & dependent variable •Independent variable: is a variable that can be controlled or manipulated. An independent variable is the variable you have control over (dose of drug) •Dependent variable: is a variable that cannot be controlled or manipulated. Its values are predicted from the independent variable ( effect on the condition)
  • 7. Types Of Variables •Discrete variables are measured in units that cannot be subdivided. Example: Number of children •Continuous variables are measured in a unit that can be subdivided infinitely. Example: Height
  • 8. Statistical analysis • Descriptive Statistics • Inferential statistics • Predictive modeling
  • 9. Descriptive Statistics •Gives us the overall picture about data •Presents data in the form of tables, charts and graphs •Includes summary data •Avoids inferences Examples: •Measures of central location Mean, median, mode and midrange •Measures of Variation •Variance, Standard Deviation, z-scores
  • 10. Inferential Statistics •Take decision on overall population using a sample • “Sampled” data are incomplete but can still be representative of the population •Permits the making of generalizations (inferences) about the data • Probability theory is a major tool used to analyze sampled data
  • 11. Predictive Modeling • The science of predicting future outcomes based on historical events. • Model Building: “Developing set of equations or mathematical formulation to forecast future behaviors based on current or historical data.” • Regression, logistic Regression, time series analysis etc.,
  • 12. Calculation of the probability • Based on the characteristics of the population for the observed parameter • (e.g. . Duration of the pregnancy, duration of the first labor stage, height, et cetera) • To describe the population, “distribution” will be used
  • 13. Distribution • A statistical distribution describes the numbers of times each possible outcome occurs in a sample • Distributions for continuous variables are called continuous distributions ( e.g. height) • They also carry the fancier name probability density
  • 14. Distribution • Some probability densities have particular importance in statistics. A very important one is shaped like a bell, and called the normal ( Gaussian) distribution. • Many naturally-occurring phenomena can be approximated surprisingly well by this distribution. It will serve to illustrate some features of all continuous distributions.
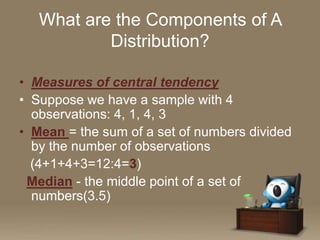
  • 16. What are the Components of A Distribution? • Measures of central tendency • Suppose we have a sample with 4 observations: 4, 1, 4, 3 • Mean = the sum of a set of numbers divided by the number of observations (4+1+4+3=12:4=3) Median - the middle point of a set of numbers(3.5)
  • 17. Components of distribution • Mode - the most frequently occurring number. Mode=4 • Median - the middle point of a set of numbers(3.5)
  • 18. Components of distribution Measures of variation Range - the maximum value minus the minimum value in a set of numbers. Range = 4-1 = 3 Standard Deviation - the average distance a data point is away from the mean. [ (4- 3)+( 1 -3)+ (4- 3)+ (3- 3)]: 4=1 standard deviation= 1
  • 20. Why to know about it ? • Mean, Median, Mode, Range, and Standard Deviations are measurements in a sample (statistics) and can also be used to make inferences on a population.
  • 21. What do we expect from the statistical analysis? • To find out whether there is a statistically significant difference between our sample (e.g. pregnancy loss in Al Ain Hospital Patient) and general population
  • 22. How to perform the statistical analysis? • Statistics can take us to a beautiful journey of understanding ,but
  • 23. Festina lente! make haste slowly