SlideShare a Scribd company logo
Introduction to Statistics
• When we carry out a biological
investigation, we will often end up with a
lot of figures which we need to be able to
interpret.
• For example, we might have measured the
heights of a sample of crop plants from
two fields which had received different
doses of fertilizer, to see if the
fertilizer increases the growth of the
plant.
• We might well find that the average
height from one field is greater than the
other, but there is likely to be some
overlap in individual plants from across
the two fields.
• Very rarely will we find that every
measurement from one sample is greater
than every measurement from the other.
• There are two possible explanations for
the difference in average height that we
have found:
1. There may be a real difference between
the two crops.
2. The crops may in fact be the same size,
and the difference we have found is due to
chance since we have only taken a sample
from each field – we just so happened to
only measure the tallest crops in one field
and the smallest crops in the other.
• We need to be able to distinguish between
these two possibilities, and this is where
statistical tests come to our aid.
• Statistical tests are used to tell us how
likely it is that our results are due to
chance.
• Stats tests enable us to calculate the
probability that our results are real or due
to chance.
How do I measure probability?
• Probability is normally measured on a scale
from 0 – 1, where 0 represents
impossibility and 1 represents certainty.
• The probability that our results are due to
chance could take any value between 0 and
1.
• We need to agree on what level of
probability we are going to accept before
we decide that the difference is real.
• For most purposes, the level which is
conventionally chosen is that the
probability that our result is due to
chance should be no more than 0.05.
• This means that there is only a 1 in 20,
or 5% probability that the difference
we have seen is due to chance
• We can say that the difference is
statistically significant.
• E.g. We have not proved that one crop is
taller than the other, but we will now
proceed on the assumption that this is
the case.
Which test?
• Different statistical tests are used in
different circumstances. There are a
few steps to go through to tell you what
test you should be using.
• First you need to decide whether you
are looking for differences or
associations between sets of data.
Testing for differences
• You need to decide whether
your data fit a normal
distribution.
• This is a symmetrical
distribution, with the
greatest number of readings
being in the central range,
and progressively fewer
readings as you move away
from the mean in either
direction.
• If your data roughly fits a bell shape
curve and is normally distributed, you
need the T test.
• If not, try the Mann Whitney U test.
B) Testing for Associations:
• The test you will need here depends on the
type of data you have measured.
• You need to decide whether your data
consist of either:
– Continuous variables (measurable on a
scale) e.g. distance, height
• OR
– Discrete categories e.g. colour, gender.
How do I interpret the result from my
stats test?
• Once you have chosen the correct test, and put your
figures into the appropriate formula, you will arrive
at a figure known as the calculated test statistic.
• This is not the probability figure referred to
earlier, and on its own it means nothing. It needs to
be compared with a critical value which varies
according to your sample size and the level of
probability you are demanding.
• In an exam, you would be provided with an extract
of such a table, from which you might be expected
to extract the relevant critical value.
• Spearman Rank should be used when
you are looking for associations between
two continuous variables.
e.g. height and age
• The Chi Squared association test is
the one to choose if looking for
associations between categorical data.
e.g. genetics test – is a condition a
recessive trait?
You then need to compare your calculated
test statistic with the critical value.
• In most cases the calculated test statistic needs
to exceed the critical value before we can say
that our result is significant:
• Calculated value > Critical value = Significant
result
• An exception to this rule however is when using
the Mann Whitney U test where your calculated
value needs to be less than the critical value
before your result is significant:
Which test would you use?
• The effect of caffeine on the heart
rate of Daphnia flies.
Spearman´s Rank
Correlation
Which test would you use?
• Is penicillin or onion more effective at
killing bacteria cells
T test
Which test would you use?
• Does temperature affect the
permeability of beetroot membrane?
Spearman´s Rank
Correlation
Which test would you use?
• pH affects the rate of reaction of an
enzyme
Spearman´s Rank
Correlation
Which test would you use?
• The higher the temperature, the faster
woodlice respire.
Spearman´s Rank
Correlation
Which test would you use?
• There are equal proportions of species
of trees in the forest.
Chi squared
Which test would you use?
• Daisies grow better in alkaline soil than
acidic soil
T test

More Related Content

Similar to Introduction to Statistics for future Biologists (20)

PPTX
Inferential Statistics
Neny Isharyanti
 
PPT
Stats-Review-Maie-St-John-5-20-2009.ppt
DiptoKumerSarker1
 
PPT
statistics in nursing
Pratibha Srivastava
 
PDF
Stats- S.K. Mangal statistics textook in pdf
dishajain805
 
PPTX
s.analysis
kavi ...
 
PPTX
Presentation 7.pptx
MuhammadUsman653449
 
PPT
Biostatistics
Larry Baum
 
PDF
Basic Statistical Concepts.pdf
KwangheeJung
 
PPTX
Statistical Significance Tests.pptx
AldofChrist
 
PPTX
Overview of different statistical tests used in epidemiological
shefali jain
 
PPTX
scope and need of biostatics
dr_sharmajyoti01
 
PPTX
Statistics
Eran Earland
 
PDF
Math Statistics Essay
ThesisPapersForSaleM
 
PPT
Stat 4 the normal distribution & steps of testing hypothesis
Forensic Pathology
 
PPTX
satatistics Presentation.pptx
MdMatiurRahman25
 
PPT
Statistics basics for oncologist kiran
Kiran Ramakrishna
 
PPTX
Biomedical statistics
AbdullaAhmad6
 
PPTX
TEST OF SIGNIFICANCE.pptx
JoicePjiji
 
PPTX
Introduction-to-Statistics.pptx
AlaaKhazaleh3
 
PPTX
PARAMETRIC TESTS.pptx
DrLasya
 
Inferential Statistics
Neny Isharyanti
 
Stats-Review-Maie-St-John-5-20-2009.ppt
DiptoKumerSarker1
 
statistics in nursing
Pratibha Srivastava
 
Stats- S.K. Mangal statistics textook in pdf
dishajain805
 
s.analysis
kavi ...
 
Presentation 7.pptx
MuhammadUsman653449
 
Biostatistics
Larry Baum
 
Basic Statistical Concepts.pdf
KwangheeJung
 
Statistical Significance Tests.pptx
AldofChrist
 
Overview of different statistical tests used in epidemiological
shefali jain
 
scope and need of biostatics
dr_sharmajyoti01
 
Statistics
Eran Earland
 
Math Statistics Essay
ThesisPapersForSaleM
 
Stat 4 the normal distribution & steps of testing hypothesis
Forensic Pathology
 
satatistics Presentation.pptx
MdMatiurRahman25
 
Statistics basics for oncologist kiran
Kiran Ramakrishna
 
Biomedical statistics
AbdullaAhmad6
 
TEST OF SIGNIFICANCE.pptx
JoicePjiji
 
Introduction-to-Statistics.pptx
AlaaKhazaleh3
 
PARAMETRIC TESTS.pptx
DrLasya
 

Recently uploaded (20)

PPTX
HEAD INJURY IN CHILDREN: NURSING MANAGEMENGT.pptx
PRADEEP ABOTHU
 
PPTX
ROLE OF ANTIOXIDANT IN EYE HEALTH MANAGEMENT.pptx
Subham Panja
 
PDF
IMP NAAC-Reforms-Stakeholder-Consultation-Presentation-on-Draft-Metrics-Unive...
BHARTIWADEKAR
 
PPTX
PPT on the Development of Education in the Victorian England
Beena E S
 
PPTX
LEGAL ASPECTS OF PSYCHIATRUC NURSING.pptx
PoojaSen20
 
PPTX
Gall bladder, Small intestine and Large intestine.pptx
rekhapositivity
 
PPTX
Views on Education of Indian Thinkers Mahatma Gandhi.pptx
ShrutiMahanta1
 
PPTX
How to Configure Prepayments in Odoo 18 Sales
Celine George
 
PPTX
HIRSCHSPRUNG'S DISEASE(MEGACOLON): NURSING MANAGMENT.pptx
PRADEEP ABOTHU
 
PPTX
SCHOOL-BASED SEXUAL HARASSMENT PREVENTION AND RESPONSE WORKSHOP
komlalokoe
 
PPTX
Optimizing Cancer Screening With MCED Technologies: From Science to Practical...
i3 Health
 
PPTX
Modern analytical techniques used to characterize organic compounds. Birbhum ...
AyanHossain
 
PPSX
Health Planning in india - Unit 03 - CHN 2 - GNM 3RD YEAR.ppsx
Priyanshu Anand
 
PPTX
Maternal and Child Tracking system & RCH portal
Ms Usha Vadhel
 
PDF
07.15.2025 - Managing Your Members Using a Membership Portal.pdf
TechSoup
 
PPTX
Accounting Skills Paper-I, Preparation of Vouchers
Dr. Sushil Bansode
 
PDF
BÀI TẬP BỔ TRỢ THEO LESSON TIẾNG ANH - I-LEARN SMART WORLD 7 - CẢ NĂM - CÓ ĐÁ...
Nguyen Thanh Tu Collection
 
PPTX
Optimizing Cancer Screening With MCED Technologies: From Science to Practical...
i3 Health
 
PPTX
ANORECTAL MALFORMATIONS: NURSING MANAGEMENT.pptx
PRADEEP ABOTHU
 
PDF
IMP NAAC REFORMS 2024 - 10 Attributes.pdf
BHARTIWADEKAR
 
HEAD INJURY IN CHILDREN: NURSING MANAGEMENGT.pptx
PRADEEP ABOTHU
 
ROLE OF ANTIOXIDANT IN EYE HEALTH MANAGEMENT.pptx
Subham Panja
 
IMP NAAC-Reforms-Stakeholder-Consultation-Presentation-on-Draft-Metrics-Unive...
BHARTIWADEKAR
 
PPT on the Development of Education in the Victorian England
Beena E S
 
LEGAL ASPECTS OF PSYCHIATRUC NURSING.pptx
PoojaSen20
 
Gall bladder, Small intestine and Large intestine.pptx
rekhapositivity
 
Views on Education of Indian Thinkers Mahatma Gandhi.pptx
ShrutiMahanta1
 
How to Configure Prepayments in Odoo 18 Sales
Celine George
 
HIRSCHSPRUNG'S DISEASE(MEGACOLON): NURSING MANAGMENT.pptx
PRADEEP ABOTHU
 
SCHOOL-BASED SEXUAL HARASSMENT PREVENTION AND RESPONSE WORKSHOP
komlalokoe
 
Optimizing Cancer Screening With MCED Technologies: From Science to Practical...
i3 Health
 
Modern analytical techniques used to characterize organic compounds. Birbhum ...
AyanHossain
 
Health Planning in india - Unit 03 - CHN 2 - GNM 3RD YEAR.ppsx
Priyanshu Anand
 
Maternal and Child Tracking system & RCH portal
Ms Usha Vadhel
 
07.15.2025 - Managing Your Members Using a Membership Portal.pdf
TechSoup
 
Accounting Skills Paper-I, Preparation of Vouchers
Dr. Sushil Bansode
 
BÀI TẬP BỔ TRỢ THEO LESSON TIẾNG ANH - I-LEARN SMART WORLD 7 - CẢ NĂM - CÓ ĐÁ...
Nguyen Thanh Tu Collection
 
Optimizing Cancer Screening With MCED Technologies: From Science to Practical...
i3 Health
 
ANORECTAL MALFORMATIONS: NURSING MANAGEMENT.pptx
PRADEEP ABOTHU
 
IMP NAAC REFORMS 2024 - 10 Attributes.pdf
BHARTIWADEKAR
 
Ad

Introduction to Statistics for future Biologists

  • 2. • When we carry out a biological investigation, we will often end up with a lot of figures which we need to be able to interpret. • For example, we might have measured the heights of a sample of crop plants from two fields which had received different doses of fertilizer, to see if the fertilizer increases the growth of the plant.
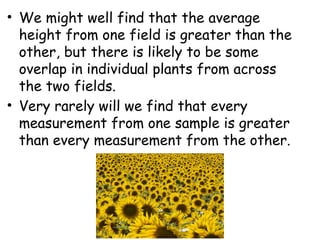
  • 3. • We might well find that the average height from one field is greater than the other, but there is likely to be some overlap in individual plants from across the two fields. • Very rarely will we find that every measurement from one sample is greater than every measurement from the other.
  • 4. • There are two possible explanations for the difference in average height that we have found: 1. There may be a real difference between the two crops. 2. The crops may in fact be the same size, and the difference we have found is due to chance since we have only taken a sample from each field – we just so happened to only measure the tallest crops in one field and the smallest crops in the other.
  • 5. • We need to be able to distinguish between these two possibilities, and this is where statistical tests come to our aid. • Statistical tests are used to tell us how likely it is that our results are due to chance. • Stats tests enable us to calculate the probability that our results are real or due to chance.
  • 6. How do I measure probability? • Probability is normally measured on a scale from 0 – 1, where 0 represents impossibility and 1 represents certainty. • The probability that our results are due to chance could take any value between 0 and 1. • We need to agree on what level of probability we are going to accept before we decide that the difference is real.
  • 7. • For most purposes, the level which is conventionally chosen is that the probability that our result is due to chance should be no more than 0.05. • This means that there is only a 1 in 20, or 5% probability that the difference we have seen is due to chance
  • 8. • We can say that the difference is statistically significant. • E.g. We have not proved that one crop is taller than the other, but we will now proceed on the assumption that this is the case.
  • 9. Which test? • Different statistical tests are used in different circumstances. There are a few steps to go through to tell you what test you should be using. • First you need to decide whether you are looking for differences or associations between sets of data.
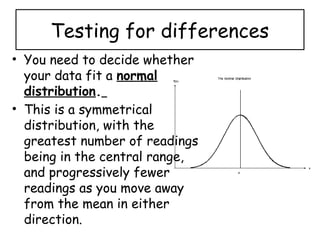
  • 10. Testing for differences • You need to decide whether your data fit a normal distribution. • This is a symmetrical distribution, with the greatest number of readings being in the central range, and progressively fewer readings as you move away from the mean in either direction.
  • 11. • If your data roughly fits a bell shape curve and is normally distributed, you need the T test. • If not, try the Mann Whitney U test.
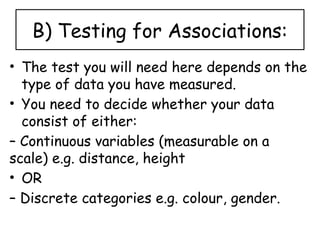
  • 12. B) Testing for Associations: • The test you will need here depends on the type of data you have measured. • You need to decide whether your data consist of either: – Continuous variables (measurable on a scale) e.g. distance, height • OR – Discrete categories e.g. colour, gender.
  • 13. How do I interpret the result from my stats test? • Once you have chosen the correct test, and put your figures into the appropriate formula, you will arrive at a figure known as the calculated test statistic. • This is not the probability figure referred to earlier, and on its own it means nothing. It needs to be compared with a critical value which varies according to your sample size and the level of probability you are demanding. • In an exam, you would be provided with an extract of such a table, from which you might be expected to extract the relevant critical value.
  • 14. • Spearman Rank should be used when you are looking for associations between two continuous variables. e.g. height and age • The Chi Squared association test is the one to choose if looking for associations between categorical data. e.g. genetics test – is a condition a recessive trait?
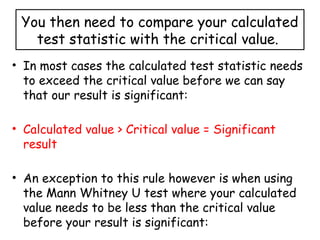
  • 15. You then need to compare your calculated test statistic with the critical value. • In most cases the calculated test statistic needs to exceed the critical value before we can say that our result is significant: • Calculated value > Critical value = Significant result • An exception to this rule however is when using the Mann Whitney U test where your calculated value needs to be less than the critical value before your result is significant:
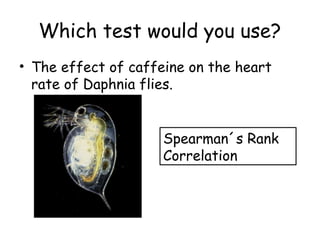
  • 16. Which test would you use? • The effect of caffeine on the heart rate of Daphnia flies. Spearman´s Rank Correlation
  • 17. Which test would you use? • Is penicillin or onion more effective at killing bacteria cells T test
  • 18. Which test would you use? • Does temperature affect the permeability of beetroot membrane? Spearman´s Rank Correlation
  • 19. Which test would you use? • pH affects the rate of reaction of an enzyme Spearman´s Rank Correlation
  • 20. Which test would you use? • The higher the temperature, the faster woodlice respire. Spearman´s Rank Correlation
  • 21. Which test would you use? • There are equal proportions of species of trees in the forest. Chi squared
  • 22. Which test would you use? • Daisies grow better in alkaline soil than acidic soil T test