1. Introduction to Statistics
This presentation will explore the
fundamental concepts of statistics, its
diverse applications in business and
economics, and its essential role in
extracting meaningful insights from
data. We'll delve into different types of
data, measurement scales, data sources,
and the power of descriptive and
inferential statistics.
by Ahmed Othman
2. Applications of Statistics
Accounting
Statistical sampling is widely used by public accounting firms
to conduct audits for their clients. This involves selecting a
representative sample of transactions to examine, rather than
reviewing every single one.
Finance
Financial analysts rely heavily on statistical information to
guide their investment recommendations. They use various
statistical tools to analyze market trends, assess risk, and
evaluate the performance of different investment options.
3. More Applications of Statistics
Marketing
Electronic scanners at retail checkout counters collect vast
amounts of data that are used for various marketing research
applications. This data allows companies to understand
consumer preferences, product demand, and market trends.
Economics
Economists use a wide range of statistical information to
make forecasts about the future of the economy or specific
economic sectors. They analyze historical data, economic
indicators, and other relevant information to predict economic
growth, inflation, and unemployment rates.
4. Even More Applications of Statistics
Production
Modern production processes rely heavily on statistical quality
control to ensure consistent product quality. Statistical control
charts are used to monitor the output of a production process,
identify potential problems, and take corrective action.
Other Applications
Statistics finds wide application in various other fields,
including healthcare, engineering, social sciences, and
environmental research. Its ability to analyze and interpret
data empowers decision-making and problem-solving in
diverse disciplines.
5. Understanding Data
1 A data set is a collection of all the data gathered in a particular
study.
2 Elements are the entities for which data are collected. For example,
in a survey about customer satisfaction, each customer would be an
element.
3 A variable is a characteristic of interest for the elements. It can be a
numerical or categorical value. For example, age, gender, income
level, and satisfaction rating are all variables.
4 An observation is the set of measurements obtained for a particular
element. It represents the values of all variables for that element.
6. Scales of Measurement
Nominal Scale
Used for data that are labels or names used to identify an
attribute. For example, in a survey, respondents might be
asked to select their gender, with options like "Male,"
"Female," or "Other."
Ordinal Scale
Used for data where the order or rank of the data is
meaningful. For example, in a customer satisfaction survey,
respondents might be asked to rate their satisfaction level
on a scale of "Very Satisfied," "Satisfied," "Neutral,"
"Dissatisfied," or "Very Dissatisfied."
Continuous Scale
Covers a range of values without gaps, interruptions, or
jumps. For example, height, weight, and temperature are
measured on a continuous scale.
Discrete Scale
Used for data that are countable. For example, the number
of children in a family, the number of cars in a parking lot,
or the number of defective units in a production run are all
examples of discrete data.
7. Types of Data
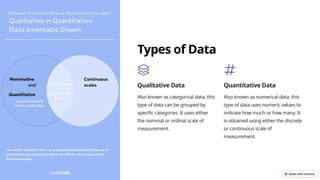
Qualitative Data
Also known as categorical data, this
type of data can be grouped by
specific categories. It uses either
the nominal or ordinal scale of
measurement.
Quantitative Data
Also known as numerical data, this
type of data uses numeric values to
indicate how much or how many. It
is obtained using either the discrete
or continuous scale of
measurement.
8. Data Sources
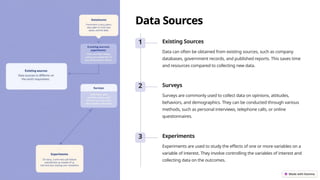
1 Existing Sources
Data can often be obtained from existing sources, such as company
databases, government records, and published reports. This saves time
and resources compared to collecting new data.
2 Surveys
Surveys are commonly used to collect data on opinions, attitudes,
behaviors, and demographics. They can be conducted through various
methods, such as personal interviews, telephone calls, or online
questionnaires.
3 Experiments
Experiments are used to study the effects of one or more variables on a
variable of interest. They involve controlling the variables of interest and
collecting data on the outcomes.
9. Descriptive and Inferential
Statistics
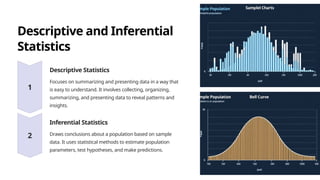
Descriptive Statistics
Focuses on summarizing and presenting data in a way that
is easy to understand. It involves collecting, organizing,
summarizing, and presenting data to reveal patterns and
insights.
Inferential Statistics
Draws conclusions about a population based on sample
data. It uses statistical methods to estimate population
parameters, test hypotheses, and make predictions.