SlideShare a Scribd company logo
Quarter 3
SENIOR HIGH SCHOOL
Agno National High School
MARK LEE P. CARRERA
A teacher. A learner.
Faculty, Agno NHS SHS Department
INTRODUCTION
TO STATISTICS
MARK LEE P. CARRERA
Special Science Teacher I
Define a statistics
Progress:
Learning Objectives!
Distinguishes between a discrete
and a continuous random variable.
Identify the different levels of
measurement
LESSON 1
STATISTICS
Statistics is the science of
collecting, organizing,
presenting, analyzing, and
interpreting numerical data.
Functions:
• to provide investigation
• to find out trends and behavior
• to show relations of cause and effect
• to show the laws underlying facts and
events
Terminologies
BRANCHES
OF STATISTICS
Descriptive Statistics
aims to provide the basic characteristics
of a data.
Inferential Statistics
aims to infer or to make interpretations.
BRANCHES OF STATISTICS
DESCRIPTIVE OR INFERENTIAL?
1. The average life expectancy at birth in the
Philippines for 2014 is 72.48 years.
2. Taking slimming pills will help you lose weight.
3. The total amount of estimated losses for
Typhoon Ondoy is ₱11 Billion.
4. The studies shows that gender is related to
excellence in Mathematics.
5. In 2016, the government projects that some
1.2 to 1.6 million students will enter Senior
High School.
VARIABLE
-used to define certain observable
values or characteristics.
VARIABLE
TYPES OF
VARIABLES
Qualitative Variables
descriptive information
Quantitative Variables
numerical information
TYPES OF VARIABLES
QUALITATIVE OR QUANTITATIVE?
1. civil status
2. body temperature
3. predominant hair color
4. highest educational attainment
5. brand of laundry soap being used
6. number of children in the household
7. distance travelled by the teacher in going to
school
8. amount spent on rice last week by the household
9. number of decayed teeth per child in elem. school
10.Time it takes standing in queue while waiting to
be served by a bank teller
qualitative
quantitative
qualitative
qualitative
qualitative
quantitative quantitative
quantitative
quantitative
quantitative
CLASSIFICATION
OF VARIABLES
Discrete Random Variable
⮚ a variable whose value is obtained
by counting.
Continuous Random Variable
⮚ a variable whose value is obtained
by measuring.
CLASSIFICATION OF VARIABLES
Discrete random variables are ones that have
a finite or countable number of possible
outcomes (like number of heads when flipping
several coins).
Continuous random variables are ones that
have an infinite or uncountable number of
possible outcomes (like your exact speed on
the highway).
Random Variables
Lesson-1-Statistics-Types-of-Variable-and-Levels-of-Measurement-Copy.pdf
DISCRETE OR CONTINUOUS?
1.body temperature
2.number of children in the household
3.distance travelled by the teacher in going to
school
4.amount spent on rice last week by the
household
5.number of decayed teeth per child in elem.
school
6.Time it takes standing in queue while
waiting to be served by a bank teller
continuous
discrete
continuous
discrete
discrete
continuous
DISCRETE OR CONTINUOUS?
1) students’ grade level
2) height of students in class
3) weight of students in class
4) number of students present
5) time it takes to get to school
6) number of red marbles in a jar
7) distance traveled between classes
8) number of heads when flipping three coins
According to functional relationship:
CLASSIFICATION OF VARIABLES
DEPENDENT VARIABLE
value to be predicted
INDEPENDENT VARIABLE
predictor
INDEPENDENT DEPENDENT
Cause Effect
Before After
Input Output
What you do What happens
DEPENDENT OR INDEPENDENT?
Complete the following table by writing possible
independent or dependent variables.
INDEPENDENT VARIABLE DEPENDENT VARIABLE
Number of hours you study for
a test
Your test score
Number of gallons in your gas
tank
1.
2. Your IQ level
Number of calories you eat
each day
3.
4. Shifting of classes
Track/Strand 5.
Lesson-1-Statistics-Types-of-Variable-and-Levels-of-Measurement-Copy.pdf
NOMINAL
-used when we want to distinguish
one object from another for
identification purposes only.
SCALES OR LEVELS OF MEASUREMENT
ORDINAL
-data are arranged in some
specified order or rank.
SCALES OR LEVELS OF MEASUREMENT
INTERVAL
-there is fixed beginning.
SCALES OR LEVELS OF MEASUREMENT
RATIO
-has a value of zero which
indicates cases where no quality of
variable is present. There is always
the presence of unit measure.
SCALES OR LEVELS OF MEASUREMENT
Lesson-1-Statistics-Types-of-Variable-and-Levels-of-Measurement-Copy.pdf
Nominal, Ordinal, Interval or Ratio?
1. height
2. religions
3. eye color
4. civil status
5. Fahrenheit degree
6. amount of money
7. Socio-economic level
8. educational attainment
9. letter grades on an English essay
10.IQ level of G11 students as low, average,
or high
ratio
nominal
nominal
nominal
interval
ratio
ordinal
ordinal
ordinal
ordinal
Population and Sample
Population (N) refers to the totality of
observations or elements from a set of
data.
Sample (n) refers to one or more
elements taken from the population
for a specific purpose.
POPULATION OR SAMPLE?
1. The total number of students in a school.
2. A group of 40 patients in a hospital who
are given a particular treatment.
3. The ages of all employees of a certain
company.
4. The top 50 taxpayers in the Philippines.
5. The list of all the countries in the world.
Parameter and Statistic
Parameter is a numerical measure
that describes a characteristics of a
population.
Statistic is a numerical measure that
describes a characteristics of a
sample.
The Food and Nutrition Research Institute of the Department of
Science and Technology (FNRI-DOST) surveyed 14 million
Filipino adults aged 20 and above and determined that 80%
of Filipino adults are at risk of hypertension.
Parameter: The percentage of adults at risk of hypertension
out of all Filipino adults aged 20 and above.
Statistic: The percentage of 80% obtained from the sample
of 14 million adults.
A researcher wants to estimate the average death
age of Filipino women in the last decade and
from a sample of 100 deaths, he obtained a
sample mean age of 73.
Parameter: The mean death age taken from the data
including all Filipino women who died in the last 10 years.
Statistic: The mean age 73 identified from the 100 samples.
Capvex is a drug used to treat patients with metastatic breast
cancer. An oncologist wants to determine the proportion of
patients taking Capvex who are healed within 10 weeks. A random
sample of 300 breast cancer patients was selected and 250 of
them were healed after 10 weeks.
Lesson-1-Statistics-Types-of-Variable-and-Levels-of-Measurement-Copy.pdf
Identify whether the statement
is a parameter or statistic.
A researcher wants to estimate the average
height of women aged 20 years or older. From a
simple random sample of 45 women, the
researcher obtains a sample mean height of 63.9
inches.
1. The average height of 63.9 inches from the
sample of 45 women.
2. The average height of all women aged 20
years or older.
statistic
parameter
A nutritionist wants to estimate the mean amount of sodium
consumed by children under the age of 10. From a random
sample of 75 children under the age of 10, the nutritionist
obtains a sample mean of 2993 milligrams of sodium
consumed.
3. The mean amount of sodium consumed by
children under the age of ten.
4. The mean of 2993 milligrams of sodium obtained
from the sample of 75 children.
parameter
statistic
Identify the parameter
and statistic in the study.

More Related Content

Similar to Lesson-1-Statistics-Types-of-Variable-and-Levels-of-Measurement-Copy.pdf (20)

PPTX
1-Introduction to Statistics ppt xv.pptx
NoreenRafique3
 
PPTX
statistics Lesson 1
donna ruth talo
 
PPTX
Statistic quantitative qualitative sample
AngeliCalumpit
 
PPTX
Bio statistic (lecture 01)
AlfahadFarwa
 
PPTX
Basic-Statistics-in-Research-Design.pptx
KheannJanePasamonte
 
PPTX
Probability and statistics (basic statistical concepts)
Don Bosco BSIT
 
PPTX
Introduction to statistics.pptx
MuddaAbdo1
 
PPTX
Biostatistics ppt.pptx
GammachuuTarrafaa
 
PPT
Bio stat
AbhishekDas15
 
PDF
Biostatistics ppt.pdf
AbdulrezakHusein
 
PPTX
INTRODUCTION-TO-STATISTICS-and-FDT-2 (1).pptx
angeliquebartolome1
 
PPTX
Lesson1_Topic 1.pptx
DindoArambalaOjeda
 
PPTX
Day 1 - Introduction-To-Statistics.pptx
MJGamboa2
 
PPT
Satatistics analysis, dr VPV Part 1. .
ssuser1c7442
 
PPTX
Introduction to Statistics
Ruby Ocenar
 
PPTX
Biostatistics ppt itroductionchapter 1.pptx
jkmrz2302
 
PPT
1 introduction and basic concepts
Lama K Banna
 
PPTX
STATISTICS ppt. G11.pptx
jarred16
 
PPTX
Topic 1 ELEMENTARY STATISTICS.pptx
moisespadillacpsu19
 
DOCX
English
sehrish shahid
 
1-Introduction to Statistics ppt xv.pptx
NoreenRafique3
 
statistics Lesson 1
donna ruth talo
 
Statistic quantitative qualitative sample
AngeliCalumpit
 
Bio statistic (lecture 01)
AlfahadFarwa
 
Basic-Statistics-in-Research-Design.pptx
KheannJanePasamonte
 
Probability and statistics (basic statistical concepts)
Don Bosco BSIT
 
Introduction to statistics.pptx
MuddaAbdo1
 
Biostatistics ppt.pptx
GammachuuTarrafaa
 
Bio stat
AbhishekDas15
 
Biostatistics ppt.pdf
AbdulrezakHusein
 
INTRODUCTION-TO-STATISTICS-and-FDT-2 (1).pptx
angeliquebartolome1
 
Lesson1_Topic 1.pptx
DindoArambalaOjeda
 
Day 1 - Introduction-To-Statistics.pptx
MJGamboa2
 
Satatistics analysis, dr VPV Part 1. .
ssuser1c7442
 
Introduction to Statistics
Ruby Ocenar
 
Biostatistics ppt itroductionchapter 1.pptx
jkmrz2302
 
1 introduction and basic concepts
Lama K Banna
 
STATISTICS ppt. G11.pptx
jarred16
 
Topic 1 ELEMENTARY STATISTICS.pptx
moisespadillacpsu19
 
English
sehrish shahid
 

Recently uploaded (20)

PPTX
PPT on the Development of Education in the Victorian England
Beena E S
 
PDF
Zoology (Animal Physiology) practical Manual
raviralanaresh2
 
PPTX
Modern analytical techniques used to characterize organic compounds. Birbhum ...
AyanHossain
 
PPTX
Explorando Recursos do Summer '25: Dicas Essenciais - 02
Mauricio Alexandre Silva
 
PDF
water conservation .pdf by Nandni Kumari XI C
Directorate of Education Delhi
 
PPTX
Gall bladder, Small intestine and Large intestine.pptx
rekhapositivity
 
PDF
Comprehensive Guide to Writing Effective Literature Reviews for Academic Publ...
AJAYI SAMUEL
 
PPTX
Blanket Order in Odoo 17 Purchase App - Odoo Slides
Celine George
 
PPTX
Presentation: Climate Citizenship Digital Education
Karl Donert
 
PDF
Federal dollars withheld by district, charter, grant recipient
Mebane Rash
 
PPTX
Views on Education of Indian Thinkers J.Krishnamurthy..pptx
ShrutiMahanta1
 
PPTX
nutriquiz grade 4.pptx...............................................
ferdinandsanbuenaven
 
PPTX
How to Configure Access Rights of Manufacturing Orders in Odoo 18 Manufacturing
Celine George
 
PPSX
Health Planning in india - Unit 03 - CHN 2 - GNM 3RD YEAR.ppsx
Priyanshu Anand
 
PPTX
Capitol Doctoral Presentation -July 2025.pptx
CapitolTechU
 
PDF
FULL DOCUMENT: Read the full Deloitte and Touche audit report on the National...
Kweku Zurek
 
PPTX
How to Configure Storno Accounting in Odoo 18 Accounting
Celine George
 
PPTX
THE HUMAN INTEGUMENTARY SYSTEM#MLT#BCRAPC.pptx
Subham Panja
 
PPTX
2025 Winter SWAYAM NPTEL & A Student.pptx
Utsav Yagnik
 
PPTX
Optimizing Cancer Screening With MCED Technologies: From Science to Practical...
i3 Health
 
PPT on the Development of Education in the Victorian England
Beena E S
 
Zoology (Animal Physiology) practical Manual
raviralanaresh2
 
Modern analytical techniques used to characterize organic compounds. Birbhum ...
AyanHossain
 
Explorando Recursos do Summer '25: Dicas Essenciais - 02
Mauricio Alexandre Silva
 
water conservation .pdf by Nandni Kumari XI C
Directorate of Education Delhi
 
Gall bladder, Small intestine and Large intestine.pptx
rekhapositivity
 
Comprehensive Guide to Writing Effective Literature Reviews for Academic Publ...
AJAYI SAMUEL
 
Blanket Order in Odoo 17 Purchase App - Odoo Slides
Celine George
 
Presentation: Climate Citizenship Digital Education
Karl Donert
 
Federal dollars withheld by district, charter, grant recipient
Mebane Rash
 
Views on Education of Indian Thinkers J.Krishnamurthy..pptx
ShrutiMahanta1
 
nutriquiz grade 4.pptx...............................................
ferdinandsanbuenaven
 
How to Configure Access Rights of Manufacturing Orders in Odoo 18 Manufacturing
Celine George
 
Health Planning in india - Unit 03 - CHN 2 - GNM 3RD YEAR.ppsx
Priyanshu Anand
 
Capitol Doctoral Presentation -July 2025.pptx
CapitolTechU
 
FULL DOCUMENT: Read the full Deloitte and Touche audit report on the National...
Kweku Zurek
 
How to Configure Storno Accounting in Odoo 18 Accounting
Celine George
 
THE HUMAN INTEGUMENTARY SYSTEM#MLT#BCRAPC.pptx
Subham Panja
 
2025 Winter SWAYAM NPTEL & A Student.pptx
Utsav Yagnik
 
Optimizing Cancer Screening With MCED Technologies: From Science to Practical...
i3 Health
 
Ad

Lesson-1-Statistics-Types-of-Variable-and-Levels-of-Measurement-Copy.pdf

  • 1. Quarter 3 SENIOR HIGH SCHOOL Agno National High School MARK LEE P. CARRERA A teacher. A learner. Faculty, Agno NHS SHS Department
  • 2. INTRODUCTION TO STATISTICS MARK LEE P. CARRERA Special Science Teacher I
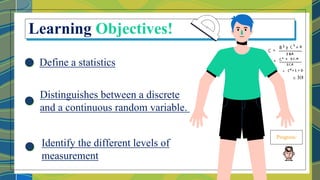
  • 3. Define a statistics Progress: Learning Objectives! Distinguishes between a discrete and a continuous random variable. Identify the different levels of measurement
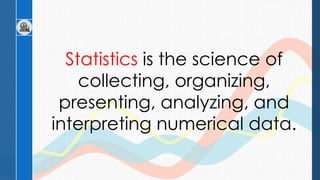
  • 5. Statistics is the science of collecting, organizing, presenting, analyzing, and interpreting numerical data.
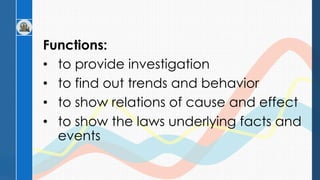
  • 6. Functions: • to provide investigation • to find out trends and behavior • to show relations of cause and effect • to show the laws underlying facts and events
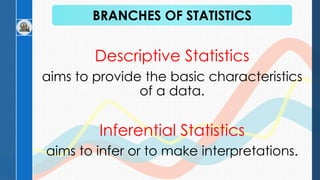
  • 9. Descriptive Statistics aims to provide the basic characteristics of a data. Inferential Statistics aims to infer or to make interpretations. BRANCHES OF STATISTICS
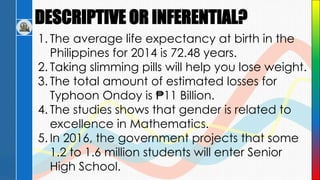
  • 10. DESCRIPTIVE OR INFERENTIAL? 1. The average life expectancy at birth in the Philippines for 2014 is 72.48 years. 2. Taking slimming pills will help you lose weight. 3. The total amount of estimated losses for Typhoon Ondoy is ₱11 Billion. 4. The studies shows that gender is related to excellence in Mathematics. 5. In 2016, the government projects that some 1.2 to 1.6 million students will enter Senior High School.
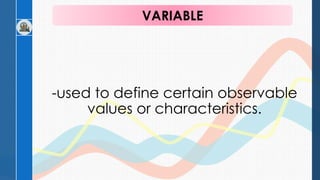
  • 12. -used to define certain observable values or characteristics. VARIABLE
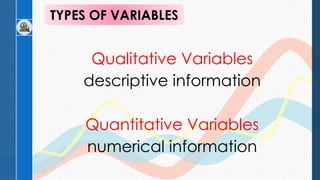
  • 14. Qualitative Variables descriptive information Quantitative Variables numerical information TYPES OF VARIABLES
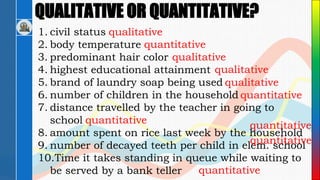
  • 15. QUALITATIVE OR QUANTITATIVE? 1. civil status 2. body temperature 3. predominant hair color 4. highest educational attainment 5. brand of laundry soap being used 6. number of children in the household 7. distance travelled by the teacher in going to school 8. amount spent on rice last week by the household 9. number of decayed teeth per child in elem. school 10.Time it takes standing in queue while waiting to be served by a bank teller qualitative quantitative qualitative qualitative qualitative quantitative quantitative quantitative quantitative quantitative
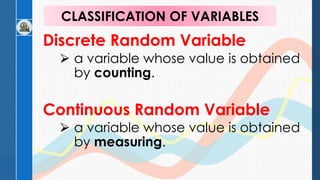
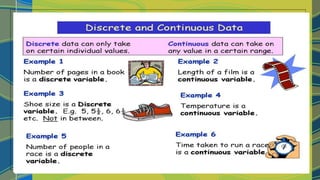
  • 17. Discrete Random Variable ⮚ a variable whose value is obtained by counting. Continuous Random Variable ⮚ a variable whose value is obtained by measuring. CLASSIFICATION OF VARIABLES
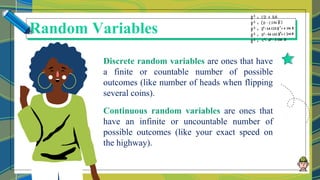
  • 18. Discrete random variables are ones that have a finite or countable number of possible outcomes (like number of heads when flipping several coins). Continuous random variables are ones that have an infinite or uncountable number of possible outcomes (like your exact speed on the highway). Random Variables
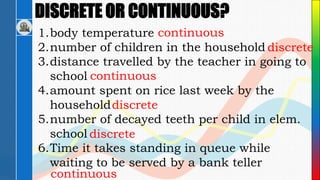
  • 20. DISCRETE OR CONTINUOUS? 1.body temperature 2.number of children in the household 3.distance travelled by the teacher in going to school 4.amount spent on rice last week by the household 5.number of decayed teeth per child in elem. school 6.Time it takes standing in queue while waiting to be served by a bank teller continuous discrete continuous discrete discrete continuous
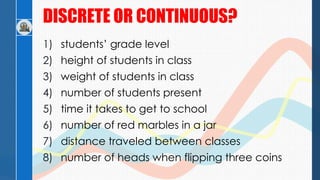
  • 21. DISCRETE OR CONTINUOUS? 1) students’ grade level 2) height of students in class 3) weight of students in class 4) number of students present 5) time it takes to get to school 6) number of red marbles in a jar 7) distance traveled between classes 8) number of heads when flipping three coins
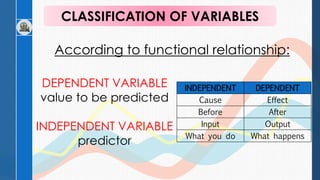
  • 22. According to functional relationship: CLASSIFICATION OF VARIABLES DEPENDENT VARIABLE value to be predicted INDEPENDENT VARIABLE predictor INDEPENDENT DEPENDENT Cause Effect Before After Input Output What you do What happens
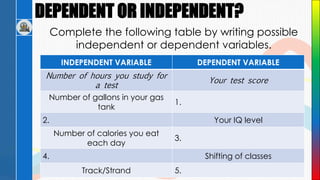
  • 23. DEPENDENT OR INDEPENDENT? Complete the following table by writing possible independent or dependent variables. INDEPENDENT VARIABLE DEPENDENT VARIABLE Number of hours you study for a test Your test score Number of gallons in your gas tank 1. 2. Your IQ level Number of calories you eat each day 3. 4. Shifting of classes Track/Strand 5.
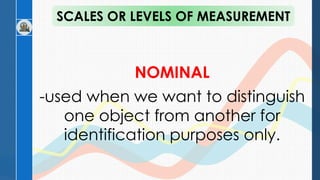
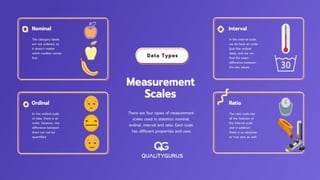
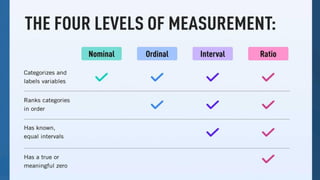
  • 25. NOMINAL -used when we want to distinguish one object from another for identification purposes only. SCALES OR LEVELS OF MEASUREMENT
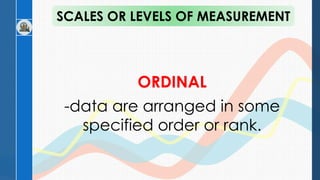
  • 26. ORDINAL -data are arranged in some specified order or rank. SCALES OR LEVELS OF MEASUREMENT
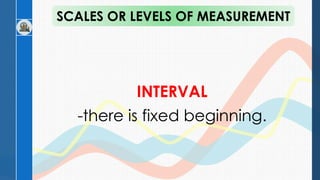
  • 27. INTERVAL -there is fixed beginning. SCALES OR LEVELS OF MEASUREMENT
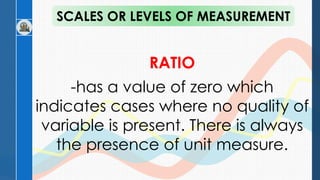
  • 28. RATIO -has a value of zero which indicates cases where no quality of variable is present. There is always the presence of unit measure. SCALES OR LEVELS OF MEASUREMENT
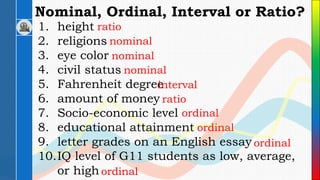
  • 31. Nominal, Ordinal, Interval or Ratio? 1. height 2. religions 3. eye color 4. civil status 5. Fahrenheit degree 6. amount of money 7. Socio-economic level 8. educational attainment 9. letter grades on an English essay 10.IQ level of G11 students as low, average, or high ratio nominal nominal nominal interval ratio ordinal ordinal ordinal ordinal
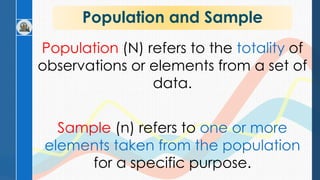
  • 32. Population and Sample Population (N) refers to the totality of observations or elements from a set of data. Sample (n) refers to one or more elements taken from the population for a specific purpose.
  • 33. POPULATION OR SAMPLE? 1. The total number of students in a school. 2. A group of 40 patients in a hospital who are given a particular treatment. 3. The ages of all employees of a certain company. 4. The top 50 taxpayers in the Philippines. 5. The list of all the countries in the world.
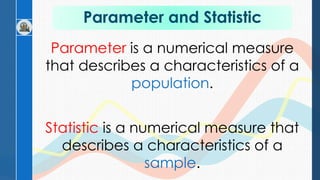
  • 34. Parameter and Statistic Parameter is a numerical measure that describes a characteristics of a population. Statistic is a numerical measure that describes a characteristics of a sample.
  • 35. The Food and Nutrition Research Institute of the Department of Science and Technology (FNRI-DOST) surveyed 14 million Filipino adults aged 20 and above and determined that 80% of Filipino adults are at risk of hypertension. Parameter: The percentage of adults at risk of hypertension out of all Filipino adults aged 20 and above. Statistic: The percentage of 80% obtained from the sample of 14 million adults.
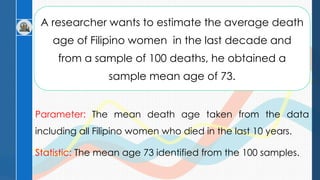
  • 36. A researcher wants to estimate the average death age of Filipino women in the last decade and from a sample of 100 deaths, he obtained a sample mean age of 73. Parameter: The mean death age taken from the data including all Filipino women who died in the last 10 years. Statistic: The mean age 73 identified from the 100 samples.
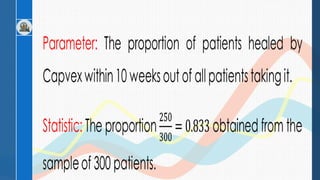
  • 37. Capvex is a drug used to treat patients with metastatic breast cancer. An oncologist wants to determine the proportion of patients taking Capvex who are healed within 10 weeks. A random sample of 300 breast cancer patients was selected and 250 of them were healed after 10 weeks.
  • 39. Identify whether the statement is a parameter or statistic.
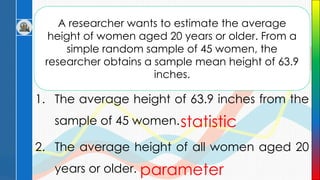
  • 40. A researcher wants to estimate the average height of women aged 20 years or older. From a simple random sample of 45 women, the researcher obtains a sample mean height of 63.9 inches. 1. The average height of 63.9 inches from the sample of 45 women. 2. The average height of all women aged 20 years or older. statistic parameter
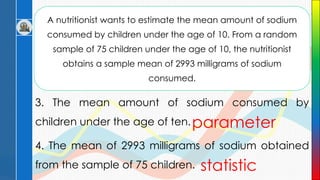
  • 41. A nutritionist wants to estimate the mean amount of sodium consumed by children under the age of 10. From a random sample of 75 children under the age of 10, the nutritionist obtains a sample mean of 2993 milligrams of sodium consumed. 3. The mean amount of sodium consumed by children under the age of ten. 4. The mean of 2993 milligrams of sodium obtained from the sample of 75 children. parameter statistic
  • 42. Identify the parameter and statistic in the study.