SlideShare a Scribd company logo
G R O U P 1 :
N G U Y Ễ N T R Ầ N H O À I P H Ư Ơ N G
P H Ạ M P H Ú C K H Á N H M I N H
N G U Y Ễ N N G Ọ C C H Â U
N G U Y Ễ N M Ỹ K H Á N H
V Õ T H Ị T H A N H T H Ư
Đ Ỗ T H Ị B Ạ C H V Â N
CHAPTER 3
Measurement and Descriptive Statistics
Outline
3.1. Frequency distributions
3.2. Levels of measurement
3.2.1. Nominal
3.2.2. Ordinal
3.2.3. Interval
3.2.4. Ratio
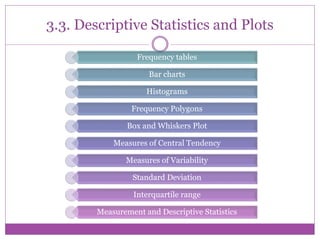
3.3. Descriptive Statistics and Plots
3.3.1. Frequency tables
3.3.2. Bar charts
3.3.3. Histograms
3.3.4. Frequency Polygons
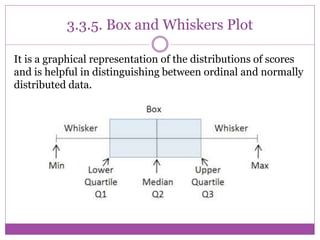
3.3.5. Box and Whiskers Plot
3.3.6. Measures of Central Tendency
3.3.7. Measures of Variability
3.3.8. Standard Deviation
3.3.9. Interquartile range
3.3.10.Measurement and Descriptive Statistics
3.1. Frequency Distributions
A frequency distribution is a tally or count of the
number of times each score on a single variable
occurs.
Grade Frequency
A 7
B 20
C 18
D 5
Total 50
Example:
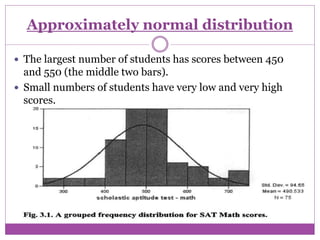
Approximately normal distribution
 The largest number of students has scores between 450
and 550 (the middle two bars).
 Small numbers of students have very low and very high
scores.
Approximately normal distribution
 When there are most scores for the middle values and a
small number of scores for the low and high values, the
distribution is said to be approximately normal.
normal,
bell
shaped
curve
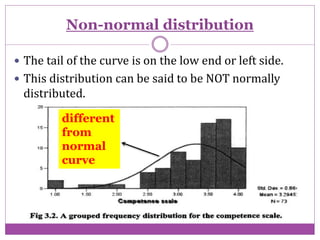
Non-normal distribution
 The tail of the curve is on the low end or left side.
 This distribution can be said to be NOT normally
distributed.
different
from
normal
curve
3.2. Levels of measurement
Nominal
Ordinal
Interval
Ratio
3.2.1. Nominal
 Two or more unordered categories
Example:
3.2.2. Ordinal
 Ordered levels, in which the difference
in magnitude between levels is not
equal.
Example:
very dissatisfied
somewhat dissatisfied
somewhat satisfied
1
2
3
4 very satisfied
3.2.3. Interval
 Ordered levels, in which the difference in magnitude
between levels is equal
 Example: Temperature, Dates (data that has an
arbitrary zero), etc.
3.2.4. Ratio
 Interval data with a natural zero point (data that has
an absolute zero)
Example: height, weight, age, length, ruler, year of
experience, etc.
Identify the scale of measurement for the
following: military title -- Lieutenant,
Captain, Major.
A. nominal
B. ordinal
C. interval
D. ratio
Question 1
Question 2
Identify the scale of measurement for the
following categorization of clothing: hat, shirt,
shoes, pants
A. nominal
B. ordinal
C. interval
D. ratio
Question 3
Identify the scale of measurement for the
following: heat measured in degrees
centigrade.
A. nominal
B. ordinal
C. interval
D. ratio
Question 4
A score on a 5-point quiz measuring knowledge
of algebra is an example of a(n)
A. nominal
B. ordinal
C. interval
D. ratio
Question 5
Amount of money you have in your pocket
right now (25 cents, 55 cents, etc.) is an
example of:
A. nominal
B. ordinal
C. interval
D. ratio
3.3. Descriptive Statistics and Plots
Frequency tables
Bar charts
Histograms
Frequency Polygons
Box and Whiskers Plot
Measures of Central Tendency
Measures of Variability
Standard Deviation
Interquartile range
Measurement and Descriptive Statistics
3.3.1. Frequency Tables
A frequency table is a table that shows the total
for each category or group of data.
3.3.2. Bar chart
Bar charts are used well for the frequency
distribution of variables like religion, ethic
group or other nominal variables.
0
5
10
15
20
25
30
35
Protestant Catholic No religion
3.3.3. Histograms
Histograms look like bar charts; however there is no
space between the boxes, indicating that there is a
continuous variable theoretically underlying the
scores.
3.3.4. Frequency Polygons
It connects the points between the categories and is
best used with approximately normal data. It is also
used with ordinal data.
3.3.5. Box and Whiskers Plot
It is a graphical representation of the distributions of scores
and is helpful in distinguishing between ordinal and normally
distributed data.
3.3.6. Measures of Central Tendency
Three measures of the center of a distribution are
commonly used: mean, median and mode.
1. Mean: sum of the values divided by the
number of cases
Example: We have a set of data: 15, 24, 49, 8, 50.
Mean: (15 +24 + 49 +8 +50)/5 = 29. 2
2. Median: the middle score or median is the
appropriate measure of central tendency for ordinal
level raw data.
The median represents the middle of the ordered
sample data
- When the sample size is even, the median is the
midpoint/mean of the two middle values
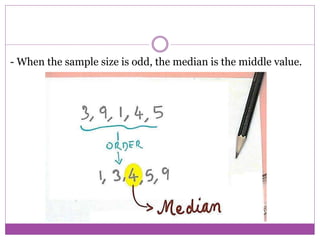
- When the sample size is odd, the median is the middle value.
3. Mode: is the number that appeared frequently
in the data set.
3.3.7. Measures of Variability
Variability tells us about the spread or dispersion of the
scores.
1. Range: the area of variation between upper and lower
limits on a particular scale.
Example: 8, 15, 24, 47, 50
=> Range = 50 – 8 = 42.
2. Standard deviation: (SD) measures the amount of
variation or dispersion from the average.
Example: 1, 2, 3, 4, 5
+ Mean: = (1 +2+3+4+5)/ 5 = 3
+ (X- )² : (1-3)² = 4, continue to do like this and then we
have the sum of this is 10.
+ Apply the formula. The result is: 1.58
SD
3.3.8. Interquartile range
In descriptive statistics, the interquartile
range (IQR), is a measure of statistical dispersion,
being equal to the difference between the upper
and lower quartiles, IQR = Q3 − Q1
Example 1: if the number of values is odd
Example 2: if the number of values is even
3.3.9. Measurement and Descriptive Statistics
- Statistics based on means and standard deviation
are valid for normally distributed or normal data.
- Typically, these data are used in the most powerful
tests called - parametric statistics. However, if the
data are ordered but grossly non–normal, means
and standard deviations may not give meaningful
answers. Then the median and a nonparametric test
would be preferred.
THANK YOU FOR
YOUR LISTENING

More Related Content

What's hot (20)

PPT
Statistics for interpreting test scores
mpazhou
 
PPT
The sampling distribution
Harve Abella
 
PPTX
Bahagi ng Kurikulum
cherriemaepanergabasa
 
PPT
Statistics-Measures of dispersions
Capricorn
 
PPT
T Test For Two Independent Samples
shoffma5
 
PPTX
The Normal distribution
Sarfraz Ahmad
 
PPTX
Measures of Variability
Mary Krystle Dawn Sulleza
 
PPTX
MEASURESOF CENTRAL TENDENCY
Richelle Saberon
 
PPTX
Basic Statistics
Chie Pegollo
 
PPTX
Normal or skewed distributions (descriptive both2) - Copyright updated
Ken Plummer
 
PPT
Fil1 prelim-1
Otilesoj Oiretemed
 
PPSX
frequency distribution table
Monie Ali
 
PPTX
Variance and standard deviation
Amrit Swaroop
 
PPTX
Measures of central tendency ppt
NighatKanwal
 
PPTX
Edukasyong Bilinggwal at Multilinggwal
Allan Lloyd Martinez
 
PPTX
CABT SHS Statistics & Probability - Mean and Variance of Sampling Distributio...
Gilbert Joseph Abueg
 
PPTX
4. parameter and statistic
ONE Virtual Services
 
PPTX
Phi (φ) Correlation
Sharlaine Ruth
 
PPTX
Measures of dispersion
Self-employed
 
PDF
Baylingwalismo
Grasya Hilario
 
Statistics for interpreting test scores
mpazhou
 
The sampling distribution
Harve Abella
 
Bahagi ng Kurikulum
cherriemaepanergabasa
 
Statistics-Measures of dispersions
Capricorn
 
T Test For Two Independent Samples
shoffma5
 
The Normal distribution
Sarfraz Ahmad
 
Measures of Variability
Mary Krystle Dawn Sulleza
 
MEASURESOF CENTRAL TENDENCY
Richelle Saberon
 
Basic Statistics
Chie Pegollo
 
Normal or skewed distributions (descriptive both2) - Copyright updated
Ken Plummer
 
Fil1 prelim-1
Otilesoj Oiretemed
 
frequency distribution table
Monie Ali
 
Variance and standard deviation
Amrit Swaroop
 
Measures of central tendency ppt
NighatKanwal
 
Edukasyong Bilinggwal at Multilinggwal
Allan Lloyd Martinez
 
CABT SHS Statistics & Probability - Mean and Variance of Sampling Distributio...
Gilbert Joseph Abueg
 
4. parameter and statistic
ONE Virtual Services
 
Phi (φ) Correlation
Sharlaine Ruth
 
Measures of dispersion
Self-employed
 
Baylingwalismo
Grasya Hilario
 

Viewers also liked (6)

PPT
Statistics
pikuoec
 
PPTX
Myths to Truths: Acting on evidence about student learning from assessment
Tansy Jessop
 
PPT
Triola 11 chapter 3
babygirl5810
 
PPT
FREQUENCY DISTRIBUTION ( distribusi frekuensi) - STATISTICS
Airlangga University , Indonesia
 
PPT
Measure of Dispersion
sonia gupta
 
PPT
Measurement scales
Aiden Yeh
 
Statistics
pikuoec
 
Myths to Truths: Acting on evidence about student learning from assessment
Tansy Jessop
 
Triola 11 chapter 3
babygirl5810
 
FREQUENCY DISTRIBUTION ( distribusi frekuensi) - STATISTICS
Airlangga University , Indonesia
 
Measure of Dispersion
sonia gupta
 
Measurement scales
Aiden Yeh
 
Ad

Similar to Measurement and descriptive statistics (20)

PPTX
Basic Statistical Concepts in Machine Learning.pptx
bajajrishabh96tech
 
PPT
Week 7 a statistics
wawaaa789
 
PPT
presentation
Pwalmiki
 
PPT
Student’s presentation
Pwalmiki
 
DOCX
descriptive and inferential statistics
Mona Sajid
 
PPTX
3.1 Measures of center
Long Beach City College
 
PPT
Descriptivestatistics
Carla Piper
 
PPTX
Descriptive
Mmedsc Hahm
 
PPTX
Statistics review
jpcagphil
 
PPT
Statistical methods
venkataramanan Thiru
 
PPTX
Introduction to Descriptive Statistics
Sanju Rusara Seneviratne
 
PPT
EDUCATIONAL STATISTICS_Unit_I.ppt
Sasi Kumar
 
PPT
Statistical Method for engineers and science
usaproductservices
 
PDF
Statistics and permeability engineering reports
wwwmostafalaith99
 
PPTX
Experimentation design of different Agricultural Research
BonnyAloka
 
PDF
Chapter 4 MMW.pdf
RaRaRamirez
 
PDF
1 descriptive statistics
Sanu Kumar
 
PPT
Statistics
Deepanshu Sharma
 
PDF
SUMMARY MEASURES.pdf
GillaMarieLeopardas1
 
PPT
8490370.ppt
ssuserfa15e21
 
Basic Statistical Concepts in Machine Learning.pptx
bajajrishabh96tech
 
Week 7 a statistics
wawaaa789
 
presentation
Pwalmiki
 
Student’s presentation
Pwalmiki
 
descriptive and inferential statistics
Mona Sajid
 
3.1 Measures of center
Long Beach City College
 
Descriptivestatistics
Carla Piper
 
Descriptive
Mmedsc Hahm
 
Statistics review
jpcagphil
 
Statistical methods
venkataramanan Thiru
 
Introduction to Descriptive Statistics
Sanju Rusara Seneviratne
 
EDUCATIONAL STATISTICS_Unit_I.ppt
Sasi Kumar
 
Statistical Method for engineers and science
usaproductservices
 
Statistics and permeability engineering reports
wwwmostafalaith99
 
Experimentation design of different Agricultural Research
BonnyAloka
 
Chapter 4 MMW.pdf
RaRaRamirez
 
1 descriptive statistics
Sanu Kumar
 
Statistics
Deepanshu Sharma
 
SUMMARY MEASURES.pdf
GillaMarieLeopardas1
 
8490370.ppt
ssuserfa15e21
 
Ad

More from Phạm Phúc Khánh Minh (14)

PPTX
Intercultural communication - Language and culture relationship
Phạm Phúc Khánh Minh
 
PPTX
Trends in EFL
Phạm Phúc Khánh Minh
 
PPTX
Translation as a Cognitive Activity
Phạm Phúc Khánh Minh
 
PPTX
Formative assessment
Phạm Phúc Khánh Minh
 
PPTX
Testing language areas and skills
Phạm Phúc Khánh Minh
 
PPTX
Test production process - Approaches to language testing - Techniques of lang...
Phạm Phúc Khánh Minh
 
PPTX
How to Teach Fiction
Phạm Phúc Khánh Minh
 
PPTX
Types of tests and types of testing
Phạm Phúc Khánh Minh
 
PPTX
Testing language ability
Phạm Phúc Khánh Minh
 
PPTX
Fundamental concepts and principles in Language Testing
Phạm Phúc Khánh Minh
 
PPTX
Age Differences in Second Language Acquisition
Phạm Phúc Khánh Minh
 
PPTX
Ethnographic & Grounded Theory
Phạm Phúc Khánh Minh
 
PPTX
Materials for General English
Phạm Phúc Khánh Minh
 
PPTX
Adapting published materials - Materials for GE
Phạm Phúc Khánh Minh
 
Intercultural communication - Language and culture relationship
Phạm Phúc Khánh Minh
 
Translation as a Cognitive Activity
Phạm Phúc Khánh Minh
 
Formative assessment
Phạm Phúc Khánh Minh
 
Testing language areas and skills
Phạm Phúc Khánh Minh
 
Test production process - Approaches to language testing - Techniques of lang...
Phạm Phúc Khánh Minh
 
How to Teach Fiction
Phạm Phúc Khánh Minh
 
Types of tests and types of testing
Phạm Phúc Khánh Minh
 
Testing language ability
Phạm Phúc Khánh Minh
 
Fundamental concepts and principles in Language Testing
Phạm Phúc Khánh Minh
 
Age Differences in Second Language Acquisition
Phạm Phúc Khánh Minh
 
Ethnographic & Grounded Theory
Phạm Phúc Khánh Minh
 
Materials for General English
Phạm Phúc Khánh Minh
 
Adapting published materials - Materials for GE
Phạm Phúc Khánh Minh
 

Recently uploaded (20)

PPTX
Optimizing Cancer Screening With MCED Technologies: From Science to Practical...
i3 Health
 
PPTX
nutriquiz grade 4.pptx...............................................
ferdinandsanbuenaven
 
PPSX
Health Planning in india - Unit 03 - CHN 2 - GNM 3RD YEAR.ppsx
Priyanshu Anand
 
PPTX
How to Configure Prepayments in Odoo 18 Sales
Celine George
 
PPTX
Views on Education of Indian Thinkers Mahatma Gandhi.pptx
ShrutiMahanta1
 
PDF
water conservation .pdf by Nandni Kumari XI C
Directorate of Education Delhi
 
PPTX
SAMPLING: DEFINITION,PROCESS,TYPES,SAMPLE SIZE, SAMPLING ERROR.pptx
PRADEEP ABOTHU
 
PPTX
PPT on the Development of Education in the Victorian England
Beena E S
 
PPTX
HEAD INJURY IN CHILDREN: NURSING MANAGEMENGT.pptx
PRADEEP ABOTHU
 
PPTX
Optimizing Cancer Screening With MCED Technologies: From Science to Practical...
i3 Health
 
PPTX
THE HUMAN INTEGUMENTARY SYSTEM#MLT#BCRAPC.pptx
Subham Panja
 
PPTX
How to Define Translation to Custom Module And Add a new language in Odoo 18
Celine George
 
PPTX
ENGLISH LEARNING ACTIVITY SHE W5Q1.pptxY
CHERIEANNAPRILSULIT1
 
PPTX
PYLORIC STENOSIS: NURSING MANAGEMENT.pptx
PRADEEP ABOTHU
 
PDF
07.15.2025 - Managing Your Members Using a Membership Portal.pdf
TechSoup
 
PPTX
Mrs Mhondiwa Introduction to Algebra class
sabinaschimanga
 
PPTX
Blanket Order in Odoo 17 Purchase App - Odoo Slides
Celine George
 
PPTX
Presentation: Climate Citizenship Digital Education
Karl Donert
 
PDF
IMP NAAC REFORMS 2024 - 10 Attributes.pdf
BHARTIWADEKAR
 
PDF
Federal dollars withheld by district, charter, grant recipient
Mebane Rash
 
Optimizing Cancer Screening With MCED Technologies: From Science to Practical...
i3 Health
 
nutriquiz grade 4.pptx...............................................
ferdinandsanbuenaven
 
Health Planning in india - Unit 03 - CHN 2 - GNM 3RD YEAR.ppsx
Priyanshu Anand
 
How to Configure Prepayments in Odoo 18 Sales
Celine George
 
Views on Education of Indian Thinkers Mahatma Gandhi.pptx
ShrutiMahanta1
 
water conservation .pdf by Nandni Kumari XI C
Directorate of Education Delhi
 
SAMPLING: DEFINITION,PROCESS,TYPES,SAMPLE SIZE, SAMPLING ERROR.pptx
PRADEEP ABOTHU
 
PPT on the Development of Education in the Victorian England
Beena E S
 
HEAD INJURY IN CHILDREN: NURSING MANAGEMENGT.pptx
PRADEEP ABOTHU
 
Optimizing Cancer Screening With MCED Technologies: From Science to Practical...
i3 Health
 
THE HUMAN INTEGUMENTARY SYSTEM#MLT#BCRAPC.pptx
Subham Panja
 
How to Define Translation to Custom Module And Add a new language in Odoo 18
Celine George
 
ENGLISH LEARNING ACTIVITY SHE W5Q1.pptxY
CHERIEANNAPRILSULIT1
 
PYLORIC STENOSIS: NURSING MANAGEMENT.pptx
PRADEEP ABOTHU
 
07.15.2025 - Managing Your Members Using a Membership Portal.pdf
TechSoup
 
Mrs Mhondiwa Introduction to Algebra class
sabinaschimanga
 
Blanket Order in Odoo 17 Purchase App - Odoo Slides
Celine George
 
Presentation: Climate Citizenship Digital Education
Karl Donert
 
IMP NAAC REFORMS 2024 - 10 Attributes.pdf
BHARTIWADEKAR
 
Federal dollars withheld by district, charter, grant recipient
Mebane Rash
 

Measurement and descriptive statistics

  • 1. G R O U P 1 : N G U Y Ễ N T R Ầ N H O À I P H Ư Ơ N G P H Ạ M P H Ú C K H Á N H M I N H N G U Y Ễ N N G Ọ C C H Â U N G U Y Ễ N M Ỹ K H Á N H V Õ T H Ị T H A N H T H Ư Đ Ỗ T H Ị B Ạ C H V Â N CHAPTER 3 Measurement and Descriptive Statistics
  • 2. Outline 3.1. Frequency distributions 3.2. Levels of measurement 3.2.1. Nominal 3.2.2. Ordinal 3.2.3. Interval 3.2.4. Ratio 3.3. Descriptive Statistics and Plots 3.3.1. Frequency tables 3.3.2. Bar charts 3.3.3. Histograms 3.3.4. Frequency Polygons 3.3.5. Box and Whiskers Plot 3.3.6. Measures of Central Tendency 3.3.7. Measures of Variability 3.3.8. Standard Deviation 3.3.9. Interquartile range 3.3.10.Measurement and Descriptive Statistics
  • 3. 3.1. Frequency Distributions A frequency distribution is a tally or count of the number of times each score on a single variable occurs. Grade Frequency A 7 B 20 C 18 D 5 Total 50 Example:
  • 4. Approximately normal distribution  The largest number of students has scores between 450 and 550 (the middle two bars).  Small numbers of students have very low and very high scores.
  • 5. Approximately normal distribution  When there are most scores for the middle values and a small number of scores for the low and high values, the distribution is said to be approximately normal. normal, bell shaped curve
  • 6. Non-normal distribution  The tail of the curve is on the low end or left side.  This distribution can be said to be NOT normally distributed. different from normal curve
  • 7. 3.2. Levels of measurement Nominal Ordinal Interval Ratio
  • 8. 3.2.1. Nominal  Two or more unordered categories Example:
  • 9. 3.2.2. Ordinal  Ordered levels, in which the difference in magnitude between levels is not equal. Example: very dissatisfied somewhat dissatisfied somewhat satisfied 1 2 3 4 very satisfied
  • 10. 3.2.3. Interval  Ordered levels, in which the difference in magnitude between levels is equal  Example: Temperature, Dates (data that has an arbitrary zero), etc.
  • 11. 3.2.4. Ratio  Interval data with a natural zero point (data that has an absolute zero) Example: height, weight, age, length, ruler, year of experience, etc.
  • 12. Identify the scale of measurement for the following: military title -- Lieutenant, Captain, Major. A. nominal B. ordinal C. interval D. ratio Question 1
  • 13. Question 2 Identify the scale of measurement for the following categorization of clothing: hat, shirt, shoes, pants A. nominal B. ordinal C. interval D. ratio
  • 14. Question 3 Identify the scale of measurement for the following: heat measured in degrees centigrade. A. nominal B. ordinal C. interval D. ratio
  • 15. Question 4 A score on a 5-point quiz measuring knowledge of algebra is an example of a(n) A. nominal B. ordinal C. interval D. ratio
  • 16. Question 5 Amount of money you have in your pocket right now (25 cents, 55 cents, etc.) is an example of: A. nominal B. ordinal C. interval D. ratio
  • 17. 3.3. Descriptive Statistics and Plots Frequency tables Bar charts Histograms Frequency Polygons Box and Whiskers Plot Measures of Central Tendency Measures of Variability Standard Deviation Interquartile range Measurement and Descriptive Statistics
  • 18. 3.3.1. Frequency Tables A frequency table is a table that shows the total for each category or group of data.
  • 19. 3.3.2. Bar chart Bar charts are used well for the frequency distribution of variables like religion, ethic group or other nominal variables. 0 5 10 15 20 25 30 35 Protestant Catholic No religion
  • 20. 3.3.3. Histograms Histograms look like bar charts; however there is no space between the boxes, indicating that there is a continuous variable theoretically underlying the scores.
  • 21. 3.3.4. Frequency Polygons It connects the points between the categories and is best used with approximately normal data. It is also used with ordinal data.
  • 22. 3.3.5. Box and Whiskers Plot It is a graphical representation of the distributions of scores and is helpful in distinguishing between ordinal and normally distributed data.
  • 23. 3.3.6. Measures of Central Tendency Three measures of the center of a distribution are commonly used: mean, median and mode. 1. Mean: sum of the values divided by the number of cases Example: We have a set of data: 15, 24, 49, 8, 50. Mean: (15 +24 + 49 +8 +50)/5 = 29. 2
  • 24. 2. Median: the middle score or median is the appropriate measure of central tendency for ordinal level raw data. The median represents the middle of the ordered sample data - When the sample size is even, the median is the midpoint/mean of the two middle values
  • 25. - When the sample size is odd, the median is the middle value.
  • 26. 3. Mode: is the number that appeared frequently in the data set.
  • 27. 3.3.7. Measures of Variability Variability tells us about the spread or dispersion of the scores. 1. Range: the area of variation between upper and lower limits on a particular scale. Example: 8, 15, 24, 47, 50 => Range = 50 – 8 = 42.
  • 28. 2. Standard deviation: (SD) measures the amount of variation or dispersion from the average. Example: 1, 2, 3, 4, 5 + Mean: = (1 +2+3+4+5)/ 5 = 3 + (X- )² : (1-3)² = 4, continue to do like this and then we have the sum of this is 10. + Apply the formula. The result is: 1.58 SD
  • 29. 3.3.8. Interquartile range In descriptive statistics, the interquartile range (IQR), is a measure of statistical dispersion, being equal to the difference between the upper and lower quartiles, IQR = Q3 − Q1
  • 30. Example 1: if the number of values is odd Example 2: if the number of values is even
  • 31. 3.3.9. Measurement and Descriptive Statistics - Statistics based on means and standard deviation are valid for normally distributed or normal data. - Typically, these data are used in the most powerful tests called - parametric statistics. However, if the data are ordered but grossly non–normal, means and standard deviations may not give meaningful answers. Then the median and a nonparametric test would be preferred.
  • 32. THANK YOU FOR YOUR LISTENING