Application of Excel and SPSS software for statistical analysis- Biostatistics and Research methodology 8th Sem Unit-4
Download as PPTX, PDF3 likes11,310 views

The document provides an overview of statistical analysis using MS Excel, SPSS, and Minitab, highlighting their features, advantages, and limitations. MS Excel is favored for its ease of use in data entry and calculation, while SPSS is preferred for its robust capabilities in social science data analysis. Minitab excels in statistical process improvement and is commonly used in various industries, although it has a steeper learning curve compared to Excel.

Application of Excel and SPSS software for statistical analysis- Biostatistics and Research methodology 8th Sem Unit-4
- 1. Statistical Analysis using Software UNIT – 4 PART - 2 MR. HIMANSHU SHARMA SHRI RAM COLLEGE OF PHARMACY Biostatistics and Research Methodology B.Pharm 4th Year 8th Sem
- 2. Statistical Analysis using- MS Excel SPSS Minitab
- 3. Statistical Analysis using MS Excel • MS Excel is one of the most commonly used tools for data analysis. The convenience of use and cost are two very important reasons why most data professionals prefer using Excel for statistical data analysis. • However, using Excel for statistical analysis requires clarity of thought, data analysis knowledge, and strong decision-making skills. • It features calculation or computation capabilities, graphing tools, pivot tables, and a macro programming language called Visual Basic for Applications.
- 4. Using Excel for Statistical Analysis: Descriptive Statistics: • Descriptive Statistics tool in the Data Analysis add-in can be used on an existing data set to get up to 16 different descriptive statistics, without having to enter a single function on the worksheet. • Descriptive statistics allow the summarization of a given set of data. This can be a population sample or an entire population’s representation. • Descriptive Statistics gives you a general idea of trends in your data including: 1. The mean, mode, median and range 2. Variance and standard deviation 3. Skewness 4. Sample Variance 5. Kurtosis and Skewness 6. Count, maximum and minimum
- 5. Advantages of MS Excel 1) Easy data input: MS Excel is frequently used for data entry or analysis since there is no limit to the quantity of information that can be saved in a spreadsheet, making it simple to enter as much data as you wish. Is. In Excel, filtering data is simple and highly useful. 2) Data retrieval is easier: Finding information printed on paper may take longer; however, this is not the case with an Excel spreadsheet. Data can be located and retrieved with ease. 3) Mathematical formulae that are Simple to Use: MS Excel's formula feature has made calculations simpler and faster.
- 6. 4. More reliable: These spreadsheets, which may be password-protected on a laptop or desktop computer, are significantly less likely to be lost than records or pieces of paper with data that have been written down. 5. One location for all data: When the paperwork was completed in the past, data was housed in separate files and registers. Now that several worksheets may be added to a single MS Excel file, it has become more practical.
- 7. Disadvantages of MS Excel 1) Data And Growth: One of the primary issues with MS Excel is that it cannot manage more than a few thousand rows without grinding to a halt. It also imposes file size restrictions. 2) Difficult To Learn: Another Limitation of MS Excel is that it can be difficult to learn. This is because there are many different elements, such as formulas, functions, and keyboard shortcuts. However, this disadvantage may be alleviated with Excel tutorials for beginners or using templates to start quickly with a good learning method and regular practice.
- 8. 4. Errors in Calculation: The most significant of MS Excel's drawbacks is that there are inaccuracies in computations. When working with fractions or percentages, for example, the decimal point may be lost, resulting in an error on the screen. This might make it tough for someone who doesn't know what they're doing to solve the problem without the aid of a professional. You'll also need to understand how to use the date and currency forms correctly.
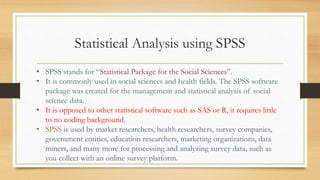
- 9. Statistical Analysis using SPSS • SPSS stands for “Statistical Package for the Social Sciences”. • It is commonly used in social sciences and health fields. The SPSS software package was created for the management and statistical analysis of social science data. • It is opposed to other statistical software such as SAS or R, it requires little to no coding background. • SPSS is used by market researchers, health researchers, survey companies, government entities, education researchers, marketing organizations, data miners, and many more for processing and analyzing survey data, such as you collect with an online survey platform.
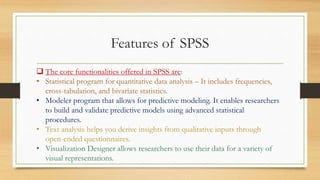
- 10. Features of SPSS The core functionalities offered in SPSS are: • Statistical program for quantitative data analysis – It includes frequencies, cross-tabulation, and bivariate statistics. • Modeler program that allows for predictive modeling. It enables researchers to build and validate predictive models using advanced statistical procedures. • Text analysis helps you derive insights from qualitative inputs through open-ended questionnaires. • Visualization Designer allows researchers to use their data for a variety of visual representations.
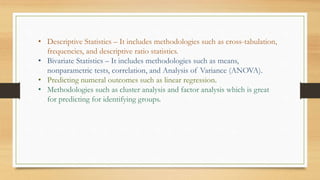
- 11. • Descriptive Statistics – It includes methodologies such as cross-tabulation, frequencies, and descriptive ratio statistics. • Bivariate Statistics – It includes methodologies such as means, nonparametric tests, correlation, and Analysis of Variance (ANOVA). • Predicting numeral outcomes such as linear regression. • Methodologies such as cluster analysis and factor analysis which is great for predicting for identifying groups.
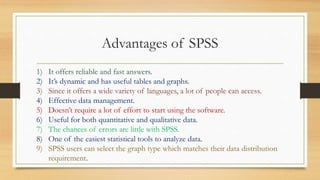
- 12. Advantages of SPSS 1) It offers reliable and fast answers. 2) It’s dynamic and has useful tables and graphs. 3) Since it offers a wide variety of languages, a lot of people can access. 4) Effective data management. 5) Doesn’t require a lot of effort to start using the software. 6) Useful for both quantitative and qualitative data. 7) The chances of errors are little with SPSS. 8) One of the easiest statistical tools to analyze data. 9) SPSS users can select the graph type which matches their data distribution requirement.
- 13. Limitations of SPSS 1) SPSS can be expensive to purchase for students. 2) Usually involves added training to completely exploit all the available features. 3) The graph features are not as simple as of Microsoft Excel.
- 14. Statistical Analysis using MiniTab • MiniTab is data analysis, statistical and process improvement software tool used by organizations worldwide to improve quality and reduce costs. • Minitab is a data analysis software package that is used for data analysis. • It is widely used in a variety of industries, including healthcare, manufacturing, and education. • Minitab provides users with tools to perform statistical analysis, including hypothesis testing, regression analysis, and ANOVA. • Additionally, Minitab provides various graphical tools to help users visualize data.
- 15. MiniTab in Six Sigma • Six Sigma is a methodology of quality improvement that uses data and statistical analysis to identify defects and improve processes. The mini tab software is used to help identify problems and potential improvements in a process. It can also be used to help track progress and verify results. Minitab also helps in several ways: • You can utilize Minitab's functions for the DMAIC (Define Measure, Analyze and Improve, Control) roadmap. • Reduce the usage of equations for data analysis explanations. • Maximize the knowledge of Minitab's outputs for data analysis. You will learn about the Minitab screens utilized to create graphs, perform data analysis, and improve presentation displays.
- 16. Benefits of MiniTab 1) Easy to Use and Learn. 2) Robust Statistical Analysis Capabilities. (Statisticians and data analysts use it to perform various tasks, including regression analysis, ANOVA, and hypothesis testing.) 3) Ability to Handle Large Data Sets. 4) Comprehensive Data Visualization Options. (can quickly and easily create stunning visualizations that help you make better decisions) 5) Flexible Reporting and Export Options. (you can export your data in various formats (including PDF, Excel, and CSV) and customize the look of your reports to make them more visually appealing.)
- 17. MiniTab vs Excel Excel is a kind of spreadsheet program that has been around for many years. MiniTab is a newer program that is growing in popularity. Both programs have their strengths and weaknesses, but there are some critical differences between them: 1. Excel is primarily a number-crunching tool, while MiniTab is designed for statistical analysis. This means that Excel is better suited for tasks like financial modeling, while MiniTab is better for jobs like analyzing data sets. 2. Excel is easy to learn and use, while MiniTab has a steeper learning curve. This is because Excel is designed for general users, while MiniTab is intended for statisticians and other data experts.
- 18. • Excel is available on Windows and Mac, while MiniTab is only available on Windows. This is because Excel is a Microsoft product, while a third party develops MiniTab. • MiniTab is explicitly designed for statistical analysis, while Excel is a general-purpose spreadsheet program. • MiniTab has more features and options for statistical analysis than Excel. • MiniTab is more expensive than Excel. • Excel is more widely used than MiniTab, although MiniTab is gaining popularity in specific industries.
- 19. THANK YOU