


STATISTICS
- 2. Definitions “ Statistics is a numerical statement of facts in any department of enquiry placed in relation to each other’. -Bowley “ Statistics are the classified facts representing the conditions of the people in a State specially those facts which can be stated in numbers or any tabular or classified arrangement”. -Webster “ Statistics can be defined as the aggregate of facts affected to a marked extent by multiplicity of causes, numerically expressed, enumerated or estimated according to a reasonable standard of accuracy, collected in in a systematic manner, for a pre-determined purpose and placed in relation to each other”. -Secrist Statistics is the science of collecting, organizing , analyzing, interpreting and presenting data.
- 3. SCOPE OF STATISTICS 1.Social Sciences -Man Power Planning -Crime Rates -Income & Wealth Analysis of Society -In studying Pricing, Production, Consumption, Investments & Profits etc. 2.Planning -Agriculture -Industry -Textiles -Education etc. For ex. Five Year Plans in India. n
- 4. SCOPE OF STATISTICS contd… 3 . Mathematics -Extensive use of Differentiation, Algebra, Trigonometry, Matrices etc in modern business analysis. -Statistics now treated as Applied Mathematics. 4. Economics - Family Budgeting -Applied in solving economic problems related to production, consumption, distribution of products as per income & wealth related patterns, wages, prices, profits & individual savings, investments, unemployment & poverty etc.
- 5. SCOPE OF STATISTICS contd… 5 . Business Management - Trend Analysis - Market Research & Analysis - Product Life Cycle i) Marketing Marketing Policy Decisions depend on forecasting, demand analysis, time & motion studies, inventory control, investments & analysis of consumer data for production & sales.
- 6. SCOPE OF STATISTICS contd… ii) Production - Designs - Methods of Production - Technology Selection - Quality Control Mechanisms - Product Mix - Quantities - Time Schedules for Manufacturing & Distribution
- 7. SCOPE OF STATISTICS contd… iii) Finance -Correlation Analysis of profits & dividends, assets & liabilities -Analysis of income & expenditure - Financial forecasts, break-even analysis, investment & risk analysis iv) Sales -Demand Analysis -Sales Forecasts v) Personnel - Wage plans, Incentive plans, Cost of living, Labor turnover ratio, Employment trends, Accidental Rates, Performance Appraisals etc.
- 8. SCOPE OF STATISTICS contd… vi) Accounting & Auditing -Analysis of Income, Expenditure, Investment, Profits and Optimization of Production etc - Forecasting costs of production & price vii) Other Areas -Insurance, Astronomy, Social Sciences, Medical Sciences, Psychology, Education etc.
- 9. LIMITATIONS OF STATISTICS Does not study individual items, deals with aggregates. Statistical laws are not exact. Not suitable for the study of qualitative phenomenon. Statistical methods are only means and not end for solving problems.
- 10. ROLE OF STATISTICS IN MANAGEMENT DECISIONS A. Marketing & Sales - Product selection & competence strategies - Utilization of resources including territory control - Advertising decisions for cost & time effectiveness - Forecasting & trend analysis - Pricing & market research
- 11. ROLE OF STATISTICS IN MANAGEMENT DECISIONS contd… B. Production Management - Product mix & product positioning - Facility & production planning - Distribution management - Material handling & facility planning - Maintenance policies - Activity planning & resources allocation - Quality control decisions
- 12. ROLE OF STATISTICS IN MANAGEMENT DECISIONS contd… C. Materials Management - Buying policy- Sourcing & Procurement - Material Planning & Lead Times D. Finance, Investments & Budgeting - Profit planning - Cash Flow Analysis - Investment decisions - Dividend policy decisions - Risk Analysis - Portfolio Analysis
- 13. ROLE OF STATISTICS IN MANAGEMENT DECISIONS contd… E. Personnel Management - Optimum organization level - Job evaluation & assignment analysis - Social / habit analysis - Salary / wage policies - Recruitment & Training
- 14. ROLE OF STATISTICS IN MANAGEMENT DECISIONS contd… F. Research & Development - Area of thrust – Analysis & Planning - Project Selection Criteria\ - Alternatives analysis - Trade – off analysis - cost & revenue
- 15. ROLE OF STATISTICS IN MANAGEMENT DECISIONS contd… G. Defense - Optimization of weapon system - Force deployment - Transportation Cost Analysis - Assignment Suitabilities
- 16. Definitions Continued Observations: Numerical quantities that measure specific characteristics. Examples include height, weight, gross sales, net profit, etc.
- 17. Some More Definitions Raw Data: Data collected in original form. Classes / class intervals: Subgroups within a set of collected data. Ex.10-20,20-30 etc Width of class-interval = upper limit – lower limit Mid – Value = (U.L + L.L)/2 Frequency: The number of times a certain value or class of values occurs. Frequency Distribution Table: The organization of raw data into table form using classes and frequencies.
- 18. More Definitions Cumulative Frequency of a class is the sum of the frequency of that class and the frequencies of all the preceding or succeeding classes which are listed in some sensible order (numerical order, alphabetical order, etc.)
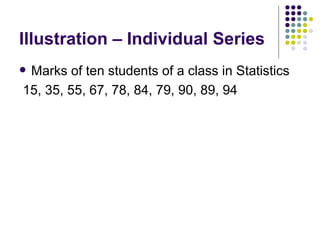
- 19. Illustration – Individual Series Marks of ten students of a class in Statistics 15, 35, 55, 67, 78, 84, 79, 90, 89, 94
- 20. Illustration – Discrete Frequency Distribution 4 68 6 66 10 64 18 62 12 60 No. of Students Height (in inches)
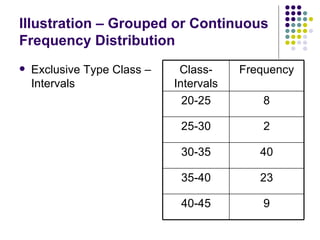
- 21. Illustration – Grouped or Continuous Frequency Distribution Exclusive Type Class – Intervals 9 40-45 23 35-40 40 30-35 2 25-30 8 20-25 Frequency Class-Intervals
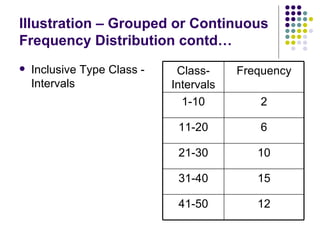
- 22. Illustration – Grouped or Continuous Frequency Distribution contd… Inclusive Type Class - Intervals 12 41-50 15 31-40 10 21-30 6 11-20 2 1-10 Frequency Class-Intervals
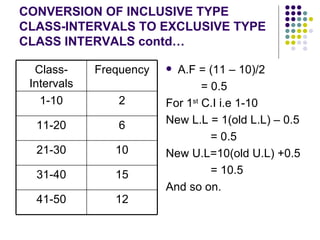
- 23. CONVERSION OF INCLUSIVE TYPE CLASS-INTERVALS TO EXCLUSIVE TYPE CLASS INTERVALS Calculate ADJUSTMENT FACTOR as follows: A.F= Lower Limit of Next C.I – Upper Limit of Previous C.I 2 using the given inclusive type class intervals. 2. Obtain new class intervals as follows: New Lower Limit = Old Lower limit – A.F New Upper Limit = Old Upper Limit + A.F
- 24. CONVERSION OF INCLUSIVE TYPE CLASS-INTERVALS TO EXCLUSIVE TYPE CLASS INTERVALS contd… A.F = (11 – 10)/2 = 0.5 For 1 st C.I i.e 1-10 New L.L = 1(old L.L) – 0.5 = 0.5 New U.L=10(old U.L) +0.5 = 10.5 And so on. 12 41-50 15 31-40 10 21-30 6 11-20 2 1-10 Frequency Class-Intervals
- 25. CONVERSION OF INCLUSIVE TYPE CLASS-INTERVALS TO EXCLUSIVE TYPE CLASS INTERVALS contd… Now calculations can be made. 12 40.5-50.5 15 30.5-40.5 10 20.5-30.5 6 10.5-20.5 2 0.5-10.5 Frequency Class-Intervals
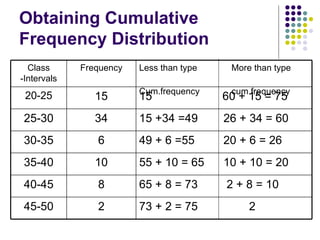
- 26. Obtaining Cumulative Frequency Distribution 73 + 2 = 75 2 2 45-50 65 + 8 = 73 2 + 8 = 10 8 40-45 55 + 10 = 65 10 + 10 = 20 10 35-40 49 + 6 =55 20 + 6 = 26 6 30-35 15 +34 =49 26 + 34 = 60 34 25-30 15 60 + 15 = 75 15 20-25 Less than type More than type Cum.frequency cum.frequency Frequency Class -Intervals
- 27. Introduction to Measures of Central Tendency Also known as averages. Values show a distinct tendency to cluster or group around a value. This behavior is central tendency of data. The value around which the data clusters is the measure of central tendency which represents the whole set of data.
- 28. Objectives of Averages To find out one value that represents the whole mass of data. To enable comparison. To establish relationship. To derive inferences about universe to which sample belongs. To aid decision – making.
- 29. Requisites of a Good Average Should be rigidly defined. Should be mathematically expressed. Should be readily comprehensible & easy to calculate. Should be calculated on the basis of all the observations. Should be least affected by extreme values and sampling fluctuations. Should be suitable for further mathematical treatment.
- 30. Common Measures of Central Tendency Arithmetic Mean Geometric Mean Harmonic Mean Median Mode Partition Values like Deciles ,Quartiles & Percentiles.
- 31. Averages Mathematical Averages Positional Averages A.M G.M H.M Median Mode
- 32. Arithmetic Mean Individual Series μ = x 1 + x 2 +…… + x n n For ex. A.M of 3, 6, 24 and 48 μ = 3 + 6 + 24 + 48 4 = 81/4 = 20.25 Ans.
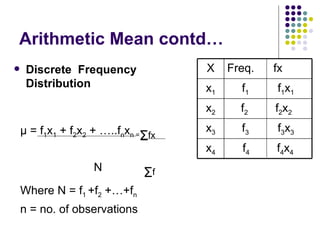
- 33. Arithmetic Mean contd… Discrete Frequency Distribution μ = f 1 x 1 + f 2 x 2 + …..f n x n = Σ fx N Σ f Where N = f 1 +f 2 +…+f n n = no. of observations f 4 f 4 x 4 x 4 f 3 f 3 x 3 x 3 f 2 f 2 x 2 x 2 f 1 f 1 x 1 x 1 Freq. fx X
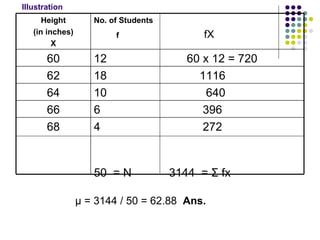
- 34. μ = 3144 / 50 = 62.88 Ans. Illustration 4 272 50 = N 3144 = Σ fx 68 6 396 66 10 640 64 18 1116 62 12 60 x 12 = 720 60 No. of Students f fX Height (in inches) X
- 35. Arithmetic Mean contd… Continuous Frequency Distribution - Direct Method - Assumed Mean Method - Step Deviation Method
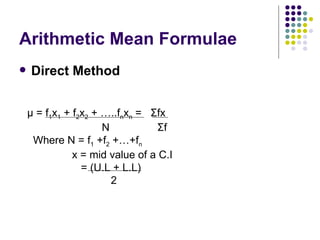
- 36. Arithmetic Mean Formulae Direct Method μ = f 1 x 1 + f 2 x 2 + …..f n x n = Σ fx N Σ f Where N = f 1 +f 2 +…+f n x = mid value of a C.I = (U.L + L.L) 2
- 37. Arithmetic Mean Formulae contd… Assumed Mean Method μ = A + Σ fd N Where A = assumed mean N = Σ f d = x – A x = mid - value
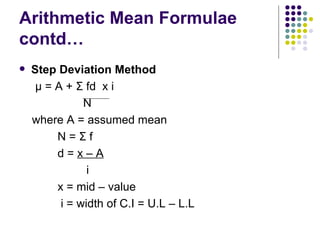
- 38. Arithmetic Mean Formulae contd… Step Deviation Method μ = A + Σ fd x i N where A = assumed mean N = Σ f d = x – A i x = mid – value i = width of C.I = U.L – L.L
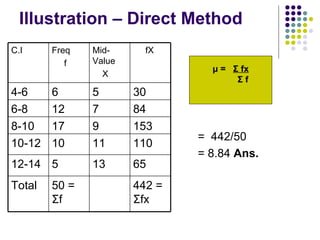
- 39. Illustration – Direct Method = 442/50 = 8.84 Ans. μ = Σ fx Σ f 442 = Σ fx 50 = Σ f Total 65 13 5 12-14 110 11 10 10-12 153 9 17 8-10 84 7 12 6-8 30 5 6 4-6 fX Mid-Value X Freq f C.I
- 40. Illustration – Assumed Mean Method = 22.5 + 105 36 = 22.5 + 2.916 = 25.416 Ans. μ = A + Σ fd Σ f Σ fd = 105 Σ f= 36 60 15 37.5 4 35-40 60 10 32.5 6 30-35 40 5 27.5 8 25-30 0 0 22.5 = A 9 20-25 -35 -5 17.5 7 15-20 -20 -10 12.5 2 10-15 fd d =(x-A) Mid Values (x) Freq. f C.I
- 41. Illustration- Step Deviation Method = 22.5 + 2100 x 5 3600 = 22.5 + 2.916 = 25.416 Ans. μ = A + Σ fd x i Σ f Σ fd = 2100 Σ f= 3600 1200 3 37.5 400 35-40 1200 2 32.5 600 30-35 800 1 27.5 800 25-30 0 0 22.5 = A 900 20-25 -700 -1 17.5 700 15-20 -400 -2 12.5 200 10-15 fd d= (x-A) I (i= 5) MidValues (x) Freq.(f) C.I
- 42. Illustration Proceed as usual 2-0=2 90-100 2 90 0 100 9-2=7 80-90 9 80 25-9=16 70-80 25 70 45-25=20 60-70 45 60 75-45=30 50-60 75 50 100-75=25 40-50 100 40 118-100=18 30-40 118 30 133-118=15 20-30 133 20 140-133= 7 10-20 140 10 Freq. C.I Cum. Freq. Marks X or more
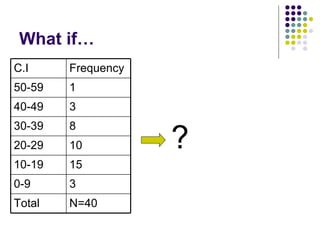
- 43. What if… ? N=40 Total 3 0-9 15 10-19 10 20-29 8 30-39 3 40-49 1 50-59 Frequency C.I
- 44. A.F = (L.L of 1 st C.I – U.L of 2 nd C.I)/2 = (50-49)/2 = 0.5 New C.I L.L of new C.I = L.L of original C.I – A.F U.L of new C.I= U.L of original C.I + A.F For ex. For 1 st C.I,new L.L = 50-0.5 = 49.5 new U.L = 59 +0.5 = 59.5 and so on. Now Continue as usual.
- 45. Determining missing frequency when A.M is known – Illustration Mean = 16.82 Σ fd = -12 N = 70 + f 4 24 3 32.5 8 30-35 20 2 27.5 10 25-30 14 1 22.5 14 20-25 0 0 17.5 = A ? = f 4 15-20 -16 -1 12.5 16 10-15 -24 -2 7.5 12 5-10 -30 -3 2.5 10 0-5 fd d= (x –A)/i M.V (x) Freq. Marks
- 46. Determining missing frequency when A.M is known - Illustration Soln . μ = A + Σ fd x I Σ f μ = 16.82 (given) , I = 5 Hence 16.82 = 17.5 + ( -12 ) x 5 70 + f 4 - 0.68 = - 60 70 + f 4 - 0.68 (70 + f 4 ) = - 60 f 4 = 12.4/0.68 = 18 approx. Ans.
- 47. Some More Applications of A.M Q1.The avg. marks secured by 50 students was 44.Later on it was discovered that a score 36 was misread as 56. Find the correct average marks secured by the students. Soln . Given N = 50 and mean μ = 44 μ = Σ X N Σ X = 44N i.e Σ X = 44x55 Σ X = 2200 Since 36 was misread as 56 Hence correct Σ X = 2200 – 56 + 36 = 2180 Correct mean = 2180/50 = 43.6 Ans.
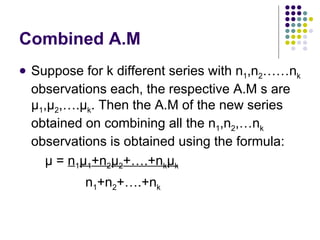
- 48. Combined A.M Suppose for k different series with n 1 ,n 2 ……n k observations each, the respective A.M s are μ 1 , μ 2 ,…. μ k . Then the A.M of the new series obtained on combining all the n 1 ,n 2 ,…n k observations is obtained using the formula: μ = n 1 μ 1 +n 2 μ 2 +….+n k μ k n 1 +n 2 +….+n k
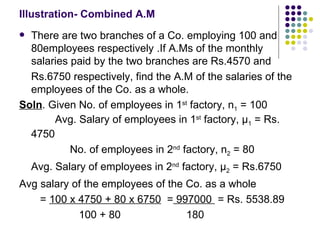
- 49. Illustration- Combined A.M There are two branches of a Co. employing 100 and 80employees respectively .If A.Ms of the monthly salaries paid by the two branches are Rs.4570 and Rs.6750 respectively, find the A.M of the salaries of the employees of the Co. as a whole. Soln . Given No. of employees in 1 st factory, n 1 = 100 Avg. Salary of employees in 1 st factory, μ 1 = Rs. 4750 No. of employees in 2 nd factory, n 2 = 80 Avg. Salary of employees in 2 nd factory, μ 2 = Rs.6750 Avg salary of the employees of the Co. as a whole = 100 x 4750 + 80 x 6750 = 997000 = Rs. 5538.89 100 + 80 180
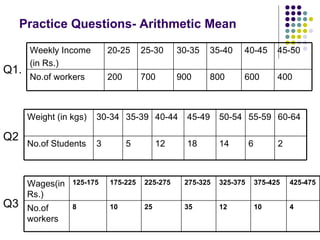
- 50. Practice Questions- Arithmetic Mean Q1. Q2 Q3 400 600 800 900 700 200 No.of workers 45-50 40-45 35-40 30-35 25-30 20-25 Weekly Income (in Rs.) 2 6 14 18 12 5 3 No.of Students 60-64 55-59 50-54 45-49 40-44 35-39 30-34 Weight (in kgs) 4 10 12 35 25 10 8 No.of workers 425-475 375-425 325-375 275-325 225-275 175-225 125-175 Wages(in Rs.)
- 51. Practice Questions- Arithmetic Mean contd… Q4 374 Less than 1000 392 Less than 1100 400 Less than 1200 324 Less than 900 265 Less than 800 194 Less than 700 116 Less than 600 60 Less than 500 20 Less than 400 0 Less than 300 No. of tubes Lifetime (in hrs.)
- 52. Merits of A.M Is rigidly defined and has a definite value. Is based on all the observations. Is capable of algebraic treatments for further data analysis & interpretation. Easy to calculate & simple to understand. For a large no. of observations, A.M provides a good basis of comparison.
- 53. Drawbacks of A.M Being based on all the observations, is considerably affected by abnormal observations. For ex. A.M of 1000, 25, 35 & 40 will be (1000+25+35+40)/4 = 275 which is not at all a representative figure. Cannot be calculated even if a single observation is missing. Cannot be obtained just by inspection as in case of median & mode. May give absurd results. For ex. If avg. no. of children per family is to be calculated and the result is 3.4 children per family, how would you interpret it?
- 54. Weighted Arithmetic Mean Formula Used μ w = x 1 w 1 + x 2 w 2 +…….+x n w n w 1 + w 2 +…….+w n
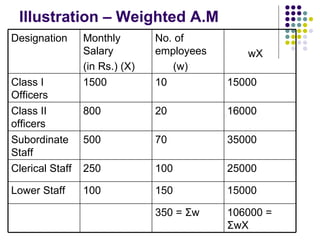
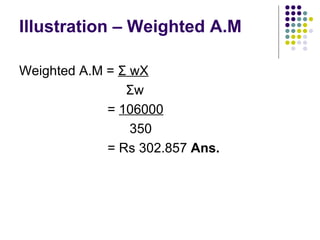
- 55. Illustration – Weighted A.M 106000 = Σ wX 350 = Σ w 15000 150 100 Lower Staff 25000 100 250 Clerical Staff 35000 70 500 Subordinate Staff 16000 20 800 Class II officers 15000 10 1500 Class I Officers wX No. of employees (w) Monthly Salary (in Rs.) (X) Designation
- 56. Illustration – Weighted A.M Weighted A.M = Σ wX Σ w = 106000 350 = Rs 302.857 Ans.
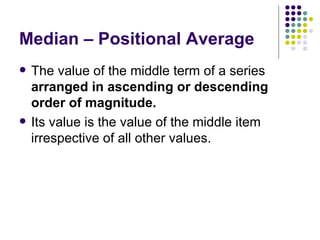
- 57. Median – Positional Average The value of the middle term of a series arranged in ascending or descending order of magnitude. Its value is the value of the middle item irrespective of all other values.
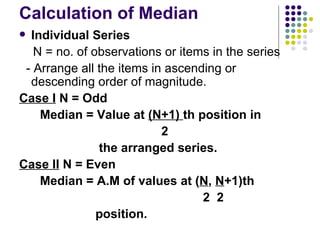
- 58. Calculation of Median Individual Series N = no. of observations or items in the series - Arrange all the items in ascending or descending order of magnitude. Case I N = Odd Median = Value at (N+1) th position in 2 the arranged series. Case II N = Even Median = A.M of values at ( N , N +1)th 2 2 position.
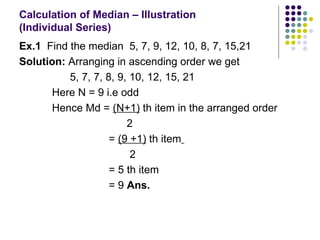
- 59. Calculation of Median – Illustration (Individual Series) Ex.1 Find the median 5, 7, 9, 12, 10, 8, 7, 15,21 Solution: Arranging in ascending order we get 5, 7, 7, 8, 9, 10, 12, 15, 21 Here N = 9 i.e odd Hence Md = (N+1) th item in the arranged order 2 = (9 +1) th item 2 = 5 th item = 9 Ans.
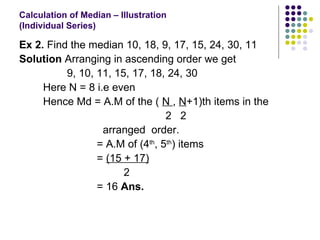
- 60. Calculation of Median – Illustration (Individual Series) Ex 2. Find the median 10, 18, 9, 17, 15, 24, 30, 11 Solution Arranging in ascending order we get 9, 10, 11, 15, 17, 18, 24, 30 Here N = 8 i.e even Hence Md = A.M of the ( N , N +1)th items in the 2 2 arranged order. = A.M of (4 th , 5 th ) items = (15 + 17) 2 = 16 Ans.
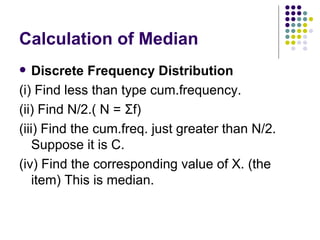
- 61. Calculation of Median Discrete Frequency Distribution (i) Find less than type cum.frequency. (ii) Find N/2.( N = Σ f) (iii) Find the cum.freq. just greater than N/2. Suppose it is C. (iv) Find the corresponding value of X. (the item) This is median.
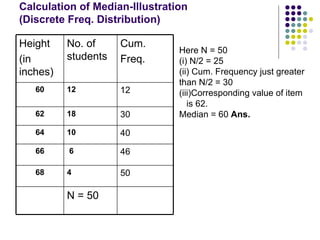
- 62. Calculation of Median-Illustration (Discrete Freq. Distribution) Here N = 50 (i) N/2 = 25 (ii) Cum. Frequency just greater than N/2 = 30 (iii)Corresponding value of item is 62. Median = 60 Ans. 12 12 60 30 18 62 40 10 64 46 6 66 50 4 68 N = 50 Cum. Freq. No. of students Height (in inches)
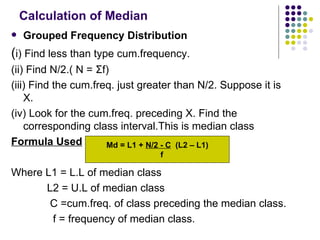
- 63. Calculation of Median Grouped Frequency Distribution ( i) Find less than type cum.frequency. (ii) Find N/2.( N = Σ f) (iii) Find the cum.freq. just greater than N/2. Suppose it is X. (iv) Look for the cum.freq. preceding X. Find the corresponding class interval.This is median class Formula Used Where L1 = L.L of median class L2 = U.L of median class C =cum.freq. of class preceding the median class. f = frequency of median class. Md = L1 + N/2 - C (L2 – L1) f
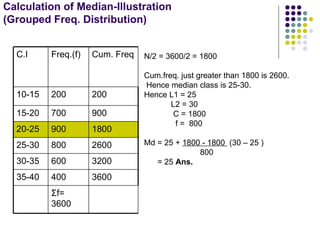
- 64. Calculation of Median-Illustration (Grouped Freq. Distribution) N/2 = 3600/2 = 1800 Cum.freq. just greater than 1800 is 2600. Hence median class is 25-30. Hence L1 = 25 L2 = 30 C = 1800 f = 800 Md = 25 + 1800 - 1800 (30 – 25 ) 800 = 25 Ans. Σ f= 3600 3600 400 35-40 3200 600 30-35 2600 800 25-30 1800 900 20-25 900 700 15-20 200 200 10-15 Cum. Freq Freq.(f) C.I
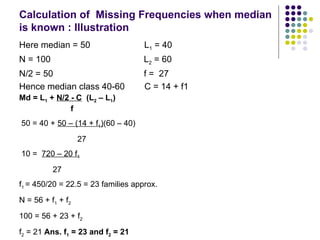
- 65. Calculation of Missing Frequencies when median is known : Illustration : Median = 50 N = 100 15 56 + f1 + f2 80-100 ? = f 2 41+ f 1 +f 2 60-80 27 41 + f 1 40-60 ? = f 1 14 + f 1 20-40 14 14 0-20 No. of Families Cumulative Freq. Expenditure
- 66. Calculation of Missing Frequencies when median is known : Illustration Here median = 50 L 1 = 40 N = 100 L 2 = 60 N/2 = 50 f = 27 Hence median class 40-60 C = 14 + f1 Md = L 1 + N/2 - C (L 2 – L 1 ) f 50 = 40 + 50 – (14 + f 1 ) (60 – 40) 27 10 = 720 – 20 f 1 27 f 1 = 450/20 = 22.5 = 23 families approx. N = 56 + f 1 + f 2 100 = 56 + 23 + f 2 f 2 = 21 Ans. f 1 = 23 and f 2 = 21
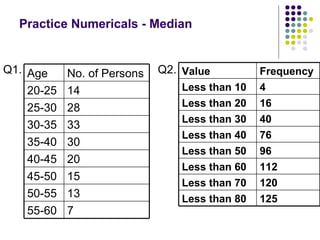
- 67. Practice Numericals - Median Q1. Q2. 7 55-60 13 50-55 15 45-50 20 40-45 30 35-40 33 30-35 28 25-30 14 20-25 No. of Persons Age 125 Less than 80 120 Less than 70 112 Less than 60 96 Less than 50 76 Less than 40 40 Less than 30 16 Less than 20 4 Less than 10 Frequency Value
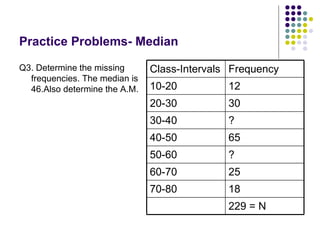
- 68. Practice Problems- Median Q3. Determine the missing frequencies. The median is 46.Also determine the A.M. 229 = N 18 70-80 25 60-70 ? 50-60 65 40-50 ? 30-40 30 20-30 12 10-20 Frequency Class-Intervals
- 69. Merits - Median Is rigidly defined. Can be easily calculated. Not affected by extreme values. Can be located merely by inspection.
- 70. Demerits - Median May not represent the entire series in many cases. Not suitable for further algebraic treatment. More likely to be affected by sampling fluctuations.
- 71. Mode The value occurring the largest no. of times in a series. That is the value having the maximum frequency. Is calculated for discrete and continuous frequency distributions only. For ex. How to obtain the mode for 1,2,3,4,5 ? as the maximum frequency is 1 and each observation has frequency 1.
- 72. Mode – Discrete Frequency Distribution The value corresponding to maximum frequency is the mode. For ex . The weight 132 pounds has the maximum frequency 3. Hence 130 pounds is the mode for this frequency distribution. 10 Total 1 141 1 140 2 135 2 132 3 130 1 120 No.of students Wt. in pounds
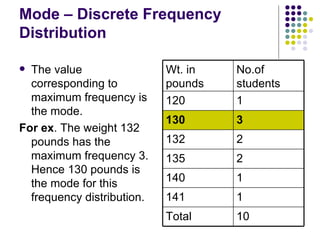
- 73. Mode – Continuous Frequency Distribution 1.Look for the class-interval with maximum frequency. This is the modal class. 2. Note down the following: L 1 = lower limit of the modal class. i = width of class-interval f 0 = frequency of class preceding the modal class. f 1 = frequency of modal class. f 2 = frequency of class succeeding the modal class.
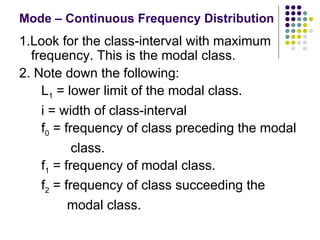
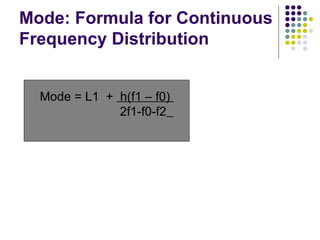
- 74. Mode: Formula for Continuous Frequency Distribution Mode = L1 + h(f1 – f0) 2f1-f0-f2
- 75. Empirical Relationship between Mean, Median & Mode Mode = 3 Median – 2 Mean
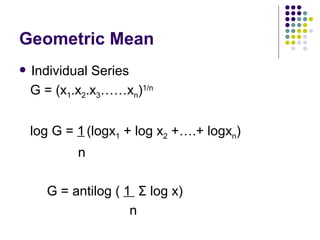
- 76. Geometric Mean Individual Series G = (x 1 .x 2 .x 3 ……x n ) 1/n log G = 1 (logx 1 + log x 2 +….+ logx n ) n G = antilog ( 1 Σ log x) n
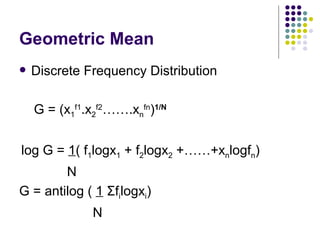
- 77. Geometric Mean Discrete Frequency Distribution G = (x 1 f1 .x 2 f2 …….x n fn ) 1/N log G = 1 ( f 1 logx 1 + f 2 logx 2 +……+x n logf n ) N G = antilog ( 1 Σ f i logx i ) N
- 78. Geometric Mean Continuous Frequency Distribution - Formula same as in case of discrete frequency distribution with x (as observations) replaced by x (as mid-values)
- 79. Harmonic Mean Reciprocal of A.M of reciprocals - Individual Series H = 1 1 ( 1 + 1 +…..+ 1 ) n x 1 x 2 x n H = n Σ ( 1 ) x
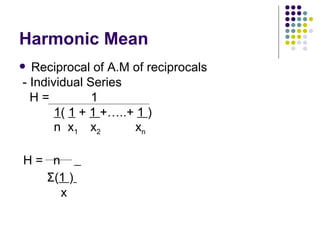
- 80. Harmonic Mean -Discrete Frequency Distribution H = 1 1 ( f 1 + f 2 +…..+ f n ) N x 1 x 2 x n H = N Σ ( f i ) x i
- 81. Harmonic Mean Continuous Frequency Distribution - Formula same as that of Discrete Frequency Distribution with x (as observations) replaced by x (as mid values).