SlideShare a Scribd company logo
- 1 - MAR
Introduction to Statistics
Statistics:
In singular form,
Statistics is the science of collecting, presenting, analyzing and interpreting data to assist
in making more effective decision.
In plural form,
A collection of numerical information is called statistics.
Example:
Life expectancy of Bangladesh is 70.65
Types of statistics:
There are two types of statistics
1. Descriptive statistics
2. Inferential statistics.
1. Descriptive Statistics: Descriptive statistics involve graphical and numerical
procedures that are used to summarize and process data and to transform data into
information.
Example:
A study found that 49% of the people in a survey knew the name of the first book of the
Bible. The statistic 49 describes the number out of every 100 persons who knew the
answer.
2. Inferential Statistics: inferential statistics are used to make inferences about a
population from a sample in order to generalize (make assumptions about this wider
population) and/or make predictions about the future. Inferential statistics provide the
bases for prediction, forecasts and estimates that are used to transform information into
knowledge.
Example:
TV networks constantly monitor the popularity of their programs by hiring Nielsen and
other organizations to sample the preferences of TV viewer.
***Descriptive statistics is the discipline of quantitatively describing the main features of
a collection of information, or the quantitative description itself. Descriptive statistics are
distinguished from inferential statistics (or inductive statistics), in that descriptive
statistics aim to summarize a sample, rather than use the data to learn about the
population that the sample of data is thought to represent.
Some important definitions:
Population: A Population is a Collection of all possible individuals, objects, or
measurements of interest.
Sample: A sample is a representative part of the population.
- 2 - MAR
Parameter: A Parameter is a measurable characteristic of a population.
Statistic: A statistic is a measurable characteristic of a sample.
Application areas: modeling of text and Web data, network traffic modeling,
probabilistic analysis of algorithms and graphs, reliability modeling, simulation
algorithms, data mining, and speech recognition, Machine Learning portion, data science
etc.
Limitations of Statistics
The limitations of statistics are being pointed out as follows:
 Statistics does not deal with qualitative phenomenon. However, qualitative
phenomenon can be analyzed if it is expressed numerically or if it is scored after
assigning appropriate number.
 Statistics deals with population and statistical methods deal with a mass of data
and not with a single figure.
 Statistics can be misused. The data placed in the hands of an inexpert may lead to
be compiled inaccurately and interpreted unscientifically.
 Statistical results are true only on an average.
Variable
Any characteristics of a population which may vary from person to person or object to
object either in magnitude or in quality are called variables.
Example
a. The heights of adult males
b. Sex of a person
- 3 - MAR
Qualitative Variable or an attribute
The variable for which numerical measurement is not possible and has only several
mutually exclusive categories is called qualitative variable.
Examples
a. Gender (Male, Female)
b. Religion (Muslim, Non-Muslim),
c. Eye color (Blue, Black, Brown)
d. Marital Status (Single, Married, Widowed, Divorced, Separated)
Quantitative Variable
The variable for which numerical measurement is possible and thus possesses a natural
ordering is called quantitative variable.
Examples
a. Height of a person
b. Weight of a person
c. family size
d. No of accident in one day etc.
Quantitative variables are either discrete or continuous.
i. Discrete Variable
When a variable can assume only the isolated values which are countable within a
given range is called discrete variable.
Examples
a. No of children in a family
b. Family size etc.
ii. Continuous Variable
When a variable can assume any value within a specific range is called continuous
variable.
Examples
a. Height of a person
b. Weight of a person etc.
Levels of Measurement
There are actually four levels of measurement.
1. Nominal-Level Data
2. Ordinal-Level Data
3. Interval-Level Data
4. Ratio-Level Data.
- 4 - MAR
1. Nominal-Level Data:
 In nominal data, the categories of variables differ only one another in name
only.
 In other words, one category of a variable is not necessarily higher or lower,
or greater or smaller than the other category.
 Even when the labels are numerically coded, the data categories have no
logical order.
Example:
a. Gender
b. Religion (Muslim, Non-Muslim),
c. Eye color (Blue, Black, Brown)
d. Marital Status (Single, Married, Widowed, Divorced, Separated)
2. Ordinal –Level Data:
 There is an ordered relationship among the categories.
 You can level/rank your data.
Example:
a. Your level of knowledge in Statistics (good, average or poor)
b. Your visit in the hospital ( frequent, occasional, rare and never )
3. Interval –Level Data:
 An interval variable is one where the distance (or interval) between any two
category is known and constant.
 An interval level data is that it does not have a true zero point.
Example:
a. Temperature:
It is approximate to say that the difference in the temperature between two
objects, one having temperature 200
C and the other having temperature 600
C
is 400
C, but it is not correct to say that the object having 600
C is thrice as hot
as the other object having temperature 200
C.
b. IQ test score.
4. Ratio –Level Data:
 Meaningful zero point and ration between variables, e.g. the zero point is the
absence of the characteristics and the ratio between two numbers is also
meaningful.
Example:
a. Height
b. Weight
c. Distance

More Related Content

Similar to Statistics (2).doc (20)

PPTX
lesson-1_Introduction-to-Statistics.pptx
RizalieIco
 
PDF
Statistics: Chapter One
Saed Jama
 
PPT
Chap001.ppt
ManoloTaquire
 
PPTX
fundamentals of data science and analytics on descriptive analysis.pptx
kumaragurusv
 
PPTX
INTRODUCTION-TO-STATISTICS-and-FDT-2 (1).pptx
angeliquebartolome1
 
PDF
Biostatistics ppt.pdf
AbdulrezakHusein
 
PPTX
statistics.pptxghfhsahkjhsghkjhahkjhgfjkjkg
Central University of South Bihar
 
PDF
Chapter-1 Introduction to Statistics.pdf
TaraRijal
 
PPT
Business statistics (Basics)
AhmedToheed3
 
PPTX
Topic 1 ELEMENTARY STATISTICS.pptx
moisespadillacpsu19
 
PPT
Introduction to statistics
Shaamma(Simi_ch) Fiverr
 
PPTX
Biostatistics ppt itroductionchapter 1.pptx
jkmrz2302
 
PPT
Introduction To Statistics.ppt
Manish Agarwal
 
PPT
businessstatistics-stat10022-200411201812.ppt
tejashreegurav243
 
PPTX
Basics of statistics
donthuraj
 
PPT
Chap1 BStat SemA201 Intro.ppt
najwalyaa
 
PPT
what is statistics? Mc Graw Hills/Irwin
Maryam Xahra
 
PPT
7jjjjjjjjjjjjjvcxzffghjknbvfhjknbvcduukkk
yeasmin75648
 
PPTX
01 Introduction (1).pptx
BAVAHRNIAPSUBRAMANIA
 
PPT
What is statistics chapter one class .ppt
XniaBelletNavarro
 
lesson-1_Introduction-to-Statistics.pptx
RizalieIco
 
Statistics: Chapter One
Saed Jama
 
Chap001.ppt
ManoloTaquire
 
fundamentals of data science and analytics on descriptive analysis.pptx
kumaragurusv
 
INTRODUCTION-TO-STATISTICS-and-FDT-2 (1).pptx
angeliquebartolome1
 
Biostatistics ppt.pdf
AbdulrezakHusein
 
statistics.pptxghfhsahkjhsghkjhahkjhgfjkjkg
Central University of South Bihar
 
Chapter-1 Introduction to Statistics.pdf
TaraRijal
 
Business statistics (Basics)
AhmedToheed3
 
Topic 1 ELEMENTARY STATISTICS.pptx
moisespadillacpsu19
 
Introduction to statistics
Shaamma(Simi_ch) Fiverr
 
Biostatistics ppt itroductionchapter 1.pptx
jkmrz2302
 
Introduction To Statistics.ppt
Manish Agarwal
 
businessstatistics-stat10022-200411201812.ppt
tejashreegurav243
 
Basics of statistics
donthuraj
 
Chap1 BStat SemA201 Intro.ppt
najwalyaa
 
what is statistics? Mc Graw Hills/Irwin
Maryam Xahra
 
7jjjjjjjjjjjjjvcxzffghjknbvfhjknbvcduukkk
yeasmin75648
 
01 Introduction (1).pptx
BAVAHRNIAPSUBRAMANIA
 
What is statistics chapter one class .ppt
XniaBelletNavarro
 

More from Atoshe Elmi (20)

PPTX
Chapter Two (final) (1).pptx; Industrial Efficiency
Atoshe Elmi
 
PPTX
Chapter 1 (1).pptx Introduction to Industrial Economics
Atoshe Elmi
 
PPT
CH 02. FINANCIAL ANALYSIS AND PLANNING.ppt
Atoshe Elmi
 
PPT
CH 03; FINANCIAL STATEMENT ANALYSIS INppt
Atoshe Elmi
 
PPTX
CHAPTER 04; THE POLITICAL ENVIRONMENT - A CRITICAL CONCERN.pptx
Atoshe Elmi
 
PPTX
CHAPTER 05; THE INTERNATIONAL LEGAL ENVIRONMENT.pptx
Atoshe Elmi
 
PPTX
CHAPTER 10; STRATEGIC MANAGEMENT OF BUSINESS FIRMS.pptx
Atoshe Elmi
 
PPTX
CHAPTER 09; INTRODUCTION TO CONTROLLING.pptx
Atoshe Elmi
 
PPTX
Chapter 8; MOATIVATING EMPLOYEE FOR ORGANISATIONS.pptx
Atoshe Elmi
 
PPTX
Chapter 6; BASIC ORGANISATIONAL DESIGN.pptx
Atoshe Elmi
 
PPTX
CHAPTER ONE_ Basic Probability Theory (1).pptx
Atoshe Elmi
 
PPTX
chapter 5.pptx: Urban Poverty and Public Policy
Atoshe Elmi
 
PPTX
Chapter 4.pptx: Urban Land use patterns and land values
Atoshe Elmi
 
PPTX
Chapter 3.pptx: Location decision of firms
Atoshe Elmi
 
PPTX
Chapter 2.pptx: Market Forces in the cites
Atoshe Elmi
 
PPTX
Chapter 1.pptx: Urban economics analysis
Atoshe Elmi
 
PPTX
CH 07; BASIC ORGANIZATIONAL DESIGN FOR MARKEING.pptx
Atoshe Elmi
 
PPTX
CH 06; STRATEGIC MANAGEMENT FOR MARKETING MANAGEMENT.pptx
Atoshe Elmi
 
PPTX
CH 05; FOUNDATIONS OF PLANNING IN MANAGEMENT.pptx
Atoshe Elmi
 
PPTX
CH 04; MANAGERS AS DECISION MAKERS OF MANAGEMENT.pptx
Atoshe Elmi
 
Chapter Two (final) (1).pptx; Industrial Efficiency
Atoshe Elmi
 
Chapter 1 (1).pptx Introduction to Industrial Economics
Atoshe Elmi
 
CH 02. FINANCIAL ANALYSIS AND PLANNING.ppt
Atoshe Elmi
 
CH 03; FINANCIAL STATEMENT ANALYSIS INppt
Atoshe Elmi
 
CHAPTER 04; THE POLITICAL ENVIRONMENT - A CRITICAL CONCERN.pptx
Atoshe Elmi
 
CHAPTER 05; THE INTERNATIONAL LEGAL ENVIRONMENT.pptx
Atoshe Elmi
 
CHAPTER 10; STRATEGIC MANAGEMENT OF BUSINESS FIRMS.pptx
Atoshe Elmi
 
CHAPTER 09; INTRODUCTION TO CONTROLLING.pptx
Atoshe Elmi
 
Chapter 8; MOATIVATING EMPLOYEE FOR ORGANISATIONS.pptx
Atoshe Elmi
 
Chapter 6; BASIC ORGANISATIONAL DESIGN.pptx
Atoshe Elmi
 
CHAPTER ONE_ Basic Probability Theory (1).pptx
Atoshe Elmi
 
chapter 5.pptx: Urban Poverty and Public Policy
Atoshe Elmi
 
Chapter 4.pptx: Urban Land use patterns and land values
Atoshe Elmi
 
Chapter 3.pptx: Location decision of firms
Atoshe Elmi
 
Chapter 2.pptx: Market Forces in the cites
Atoshe Elmi
 
Chapter 1.pptx: Urban economics analysis
Atoshe Elmi
 
CH 07; BASIC ORGANIZATIONAL DESIGN FOR MARKEING.pptx
Atoshe Elmi
 
CH 06; STRATEGIC MANAGEMENT FOR MARKETING MANAGEMENT.pptx
Atoshe Elmi
 
CH 05; FOUNDATIONS OF PLANNING IN MANAGEMENT.pptx
Atoshe Elmi
 
CH 04; MANAGERS AS DECISION MAKERS OF MANAGEMENT.pptx
Atoshe Elmi
 
Ad

Recently uploaded (20)

PPTX
7Cs_of_Communication_PresentatADGDAion.pptx
YuriWiispeiehebeoheb
 
PPTX
Power BI Dashboard Design Core Principles of Effective Data Visualization.pptx
360factors
 
PPTX
Kotler_mm16e_inppt_11-Managing-Pricing-and-Sales-Promotions-2.pptx
RonnelPineda2
 
PDF
Tran Quoc Bao - The CFA Powering Asia’s Healthcare Revolution
Gorman Bain Capital
 
PPTX
Gender Budget and Women Empowerment in the Current scenario.pptx
radhikaramesh14
 
PPTX
Highlights of the Current Union Budget 2025-26.pptx
radhikaramesh14
 
PPTX
Seminar 4 Slides - Week 4 - Islamic Capital Markets.pptx
MushtaqHussain412351
 
PPTX
How to Mitigate Risk as part of Generative AI Deployment
PaulYoung221210
 
PDF
Chapter 2 Foundations Of AI in Finance.pdf
Templifyr
 
PPTX
How best to implement Financial Planning and Analysis Solution
PaulYoung221210
 
PPTX
united states Presentation Debt crises 1st.pptx
marialabib40
 
PDF
Newsweek Hospital Rankings 2025 – Ophthalmology Top 9 Eye Hospitals in Ho Chi...
Gorman Bain Capital
 
PDF
Asia’s Most Influential Hospital CEOs: The Leaders Transforming Healthcare Ac...
Gorman Bain Capital
 
PPTX
Predict Customer Churn With AI Driven Analytics.pptx
360factors
 
PDF
Internet of service and industrial internet
Claudia Lanteri
 
PPTX
Global_Financial_Sectors_Presentation.pptx
yashasvisanskrityan11
 
PPTX
A Guide to Maximizing Business Performance with Operational KPI Metrics.pptx
360factors
 
PDF
The Man Who Turned a Hospital into a Healthcare Empire
Gorman Bain Capital
 
PDF
Tran Quoc Bao named Asia’s Healthcare Powerhouse -The 10 Most Influential Hos...
Gorman Bain Capital
 
PPTX
Role of Financial Modeling for Asset Mgt
PaulYoung221210
 
7Cs_of_Communication_PresentatADGDAion.pptx
YuriWiispeiehebeoheb
 
Power BI Dashboard Design Core Principles of Effective Data Visualization.pptx
360factors
 
Kotler_mm16e_inppt_11-Managing-Pricing-and-Sales-Promotions-2.pptx
RonnelPineda2
 
Tran Quoc Bao - The CFA Powering Asia’s Healthcare Revolution
Gorman Bain Capital
 
Gender Budget and Women Empowerment in the Current scenario.pptx
radhikaramesh14
 
Highlights of the Current Union Budget 2025-26.pptx
radhikaramesh14
 
Seminar 4 Slides - Week 4 - Islamic Capital Markets.pptx
MushtaqHussain412351
 
How to Mitigate Risk as part of Generative AI Deployment
PaulYoung221210
 
Chapter 2 Foundations Of AI in Finance.pdf
Templifyr
 
How best to implement Financial Planning and Analysis Solution
PaulYoung221210
 
united states Presentation Debt crises 1st.pptx
marialabib40
 
Newsweek Hospital Rankings 2025 – Ophthalmology Top 9 Eye Hospitals in Ho Chi...
Gorman Bain Capital
 
Asia’s Most Influential Hospital CEOs: The Leaders Transforming Healthcare Ac...
Gorman Bain Capital
 
Predict Customer Churn With AI Driven Analytics.pptx
360factors
 
Internet of service and industrial internet
Claudia Lanteri
 
Global_Financial_Sectors_Presentation.pptx
yashasvisanskrityan11
 
A Guide to Maximizing Business Performance with Operational KPI Metrics.pptx
360factors
 
The Man Who Turned a Hospital into a Healthcare Empire
Gorman Bain Capital
 
Tran Quoc Bao named Asia’s Healthcare Powerhouse -The 10 Most Influential Hos...
Gorman Bain Capital
 
Role of Financial Modeling for Asset Mgt
PaulYoung221210
 
Ad

Statistics (2).doc

  • 1. - 1 - MAR Introduction to Statistics Statistics: In singular form, Statistics is the science of collecting, presenting, analyzing and interpreting data to assist in making more effective decision. In plural form, A collection of numerical information is called statistics. Example: Life expectancy of Bangladesh is 70.65 Types of statistics: There are two types of statistics 1. Descriptive statistics 2. Inferential statistics. 1. Descriptive Statistics: Descriptive statistics involve graphical and numerical procedures that are used to summarize and process data and to transform data into information. Example: A study found that 49% of the people in a survey knew the name of the first book of the Bible. The statistic 49 describes the number out of every 100 persons who knew the answer. 2. Inferential Statistics: inferential statistics are used to make inferences about a population from a sample in order to generalize (make assumptions about this wider population) and/or make predictions about the future. Inferential statistics provide the bases for prediction, forecasts and estimates that are used to transform information into knowledge. Example: TV networks constantly monitor the popularity of their programs by hiring Nielsen and other organizations to sample the preferences of TV viewer. ***Descriptive statistics is the discipline of quantitatively describing the main features of a collection of information, or the quantitative description itself. Descriptive statistics are distinguished from inferential statistics (or inductive statistics), in that descriptive statistics aim to summarize a sample, rather than use the data to learn about the population that the sample of data is thought to represent. Some important definitions: Population: A Population is a Collection of all possible individuals, objects, or measurements of interest. Sample: A sample is a representative part of the population.
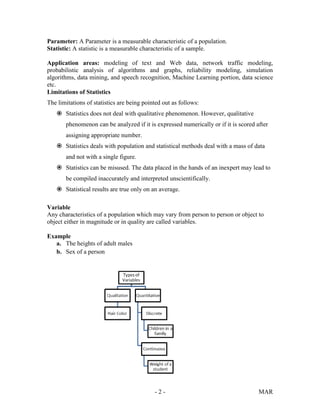
  • 2. - 2 - MAR Parameter: A Parameter is a measurable characteristic of a population. Statistic: A statistic is a measurable characteristic of a sample. Application areas: modeling of text and Web data, network traffic modeling, probabilistic analysis of algorithms and graphs, reliability modeling, simulation algorithms, data mining, and speech recognition, Machine Learning portion, data science etc. Limitations of Statistics The limitations of statistics are being pointed out as follows:  Statistics does not deal with qualitative phenomenon. However, qualitative phenomenon can be analyzed if it is expressed numerically or if it is scored after assigning appropriate number.  Statistics deals with population and statistical methods deal with a mass of data and not with a single figure.  Statistics can be misused. The data placed in the hands of an inexpert may lead to be compiled inaccurately and interpreted unscientifically.  Statistical results are true only on an average. Variable Any characteristics of a population which may vary from person to person or object to object either in magnitude or in quality are called variables. Example a. The heights of adult males b. Sex of a person
  • 3. - 3 - MAR Qualitative Variable or an attribute The variable for which numerical measurement is not possible and has only several mutually exclusive categories is called qualitative variable. Examples a. Gender (Male, Female) b. Religion (Muslim, Non-Muslim), c. Eye color (Blue, Black, Brown) d. Marital Status (Single, Married, Widowed, Divorced, Separated) Quantitative Variable The variable for which numerical measurement is possible and thus possesses a natural ordering is called quantitative variable. Examples a. Height of a person b. Weight of a person c. family size d. No of accident in one day etc. Quantitative variables are either discrete or continuous. i. Discrete Variable When a variable can assume only the isolated values which are countable within a given range is called discrete variable. Examples a. No of children in a family b. Family size etc. ii. Continuous Variable When a variable can assume any value within a specific range is called continuous variable. Examples a. Height of a person b. Weight of a person etc. Levels of Measurement There are actually four levels of measurement. 1. Nominal-Level Data 2. Ordinal-Level Data 3. Interval-Level Data 4. Ratio-Level Data.
  • 4. - 4 - MAR 1. Nominal-Level Data:  In nominal data, the categories of variables differ only one another in name only.  In other words, one category of a variable is not necessarily higher or lower, or greater or smaller than the other category.  Even when the labels are numerically coded, the data categories have no logical order. Example: a. Gender b. Religion (Muslim, Non-Muslim), c. Eye color (Blue, Black, Brown) d. Marital Status (Single, Married, Widowed, Divorced, Separated) 2. Ordinal –Level Data:  There is an ordered relationship among the categories.  You can level/rank your data. Example: a. Your level of knowledge in Statistics (good, average or poor) b. Your visit in the hospital ( frequent, occasional, rare and never ) 3. Interval –Level Data:  An interval variable is one where the distance (or interval) between any two category is known and constant.  An interval level data is that it does not have a true zero point. Example: a. Temperature: It is approximate to say that the difference in the temperature between two objects, one having temperature 200 C and the other having temperature 600 C is 400 C, but it is not correct to say that the object having 600 C is thrice as hot as the other object having temperature 200 C. b. IQ test score. 4. Ratio –Level Data:  Meaningful zero point and ration between variables, e.g. the zero point is the absence of the characteristics and the ratio between two numbers is also meaningful. Example: a. Height b. Weight c. Distance