SlideShare a Scribd company logo
2
Most read
Statistics
Chapter One
Introduction
Meaning
Statistic (singular) - is a science that deals with the principles and procedures for the
collection, organization, summarization, presentation and analysis of numerical data.
Statistics (plural)-set of data or mass of observation
Fields of statistics
Mathematical statistics- development and exposition of theories
Applied statistics- application of statistical methods to solve real problems
Branches of Statistics
Descriptive statistics- methods of summarizing and presenting data (collection,
extraction, summarization, presentation, measures of central tendency, measures of
location and measures of variability)
Inferential statistics-the process of drawing and making decision on the population
based on evidence obtained from a sample (estimation and hypothesis testing)
Classification of Statistics
Parametic statistics- is an approach which assumes a random sample from a normal
distribution and involves testing of hypothesis about the population parameter
 Appropriate for interval and ratio data
 Requires large sample size to appeal normality
Nonparametic statistics/distribution-free method-is an approach for estimating and
hypothesis testing when no underlying data is assumed
 Can be used for nominal, ordinal scaled data
 Can be used for interval and ratio scaled data where the distribution of the
random variable of interest is unspecified
 Good when there is not enough sample size to assess the form of the distribution
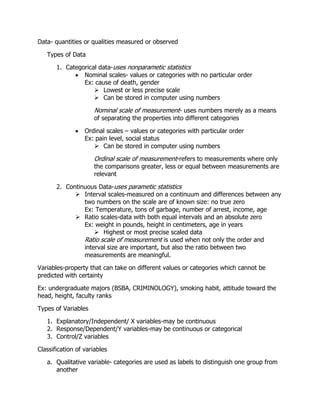
Data- quantities or qualities measured or observed
Types of Data
1. Categorical data-uses nonparametic statistics
 Nominal scales- values or categories with no particular order
Ex: cause of death, gender
 Lowest or less precise scale
 Can be stored in computer using numbers
Nominal scale of measurement- uses numbers merely as a means
of separating the properties into different categories
 Ordinal scales – values or categories with particular order
Ex: pain level, social status
 Can be stored in computer using numbers
Ordinal scale of measurement-refers to measurements where only
the comparisons greater, less or equal between measurements are
relevant
2. Continuous Data-uses parametic statistics
 Interval scales-measured on a continuum and differences between any
two numbers on the scale are of known size: no true zero
Ex: Temperature, tons of garbage, number of arrest, income, age
 Ratio scales-data with both equal intervals and an absolute zero
Ex: weight in pounds, height in centimeters, age in years
 Highest or most precise scaled data
Ratio scale of measurement is used when not only the order and
interval size are important, but also the ratio between two
measurements are meaningful.
Variables-property that can take on different values or categories which cannot be
predicted with certainty
Ex: undergraduate majors (BSBA, CRIMINOLOGY), smoking habit, attitude toward the
head, height, faculty ranks
Types of Variables
1. Explanatory/Independent/ X variables-may be continuous
2. Response/Dependent/Y variables-may be continuous or categorical
3. Control/Z variables
Classification of variables
a. Qualitative variable- categories are used as labels to distinguish one group from
another
Ex: cause of death, nationality, race, gender, severity of pain
b. Quantitative variable-whose categories can be measured and ordered according
to quantity;
Ex: number of children in a family, age
Quantitative variable classification:
i. Discrete variables-values that is either finite or countably infinite
 There are gaps between its possible values
Ex: number of missing teeth and number of household members
ii. Continuous variables- has a set of possible values including all values in
an interval of the real line
Ex: Body Mass Index, height
 There is no gaps between possible values
Sources of Data
a) Primary source
b) Secondary source
Presentation of Data
a) Textual presentation-uses statements
b) Tabular presentation-uses statistical table
c) Graphical presentation-uses graph
I. Bar graph
II. Circle graph
III. Line graph
Chapter Two
Sampling Techniques
Population [N]-totality of the individuals
Target population-entire set of individuals which we require info from
Sampled population-finite set of individuals from which sample is drawn
Coverage error-when the sampled population and the target population are not identical
Sample-representative portion of the population understudy
Principle of Randomization
“Four basic reasons for the use of samples”
1. It allows us to obtain information with greater speed
2. It allows us to obtain information with reduced cost
3. It allows us to obtain information over a greater scope
4. It allows us to obtain information with greater accuracy
Probability sampling and Non-probability Sampling
Probability sampling-uses random selection
Methods of Probability Sampling
1. Simple random sampling-choosing a sample from a set
Techniques in drawing SRS
a) Table of Random Numbers
b) Lottery of fishbowl technique
May be done in two ways
a) With replacement
b) Without replacement
Advantages
 Simple and is more easily understood that other sampling designs
Disadvantages
 List of all the members in the population is needed.
 Assigning numbers to each member of the sampled population is
frequently impractical.
 It may be difficult to collect the sample data with SRS if the samples
are spread inconveniently throughout the population.
 It is often less precise than other sampling plans because it disregards
any information already known about the population.
When to use
 When the population is homogeneous with respect to the
characteristics understudy.
2. Systematic random sampling-selection of the desired sample in a list by
arranging them systematically
Formula: 𝑘 =
N
n
Where k=sampling interval
N=population size
n=sample size
Advantages:
 Easier to apply and less likely to make mistakes.
 It is possible to select a sample in the field without a sampling frame.
 It could give more precise estimate than SRS when there is order in
the samples
Disadvantages:
 If periodic regularities are found in the lists, a systematic sample may
consist only of similar types
 If the population is not in random order, one cannot validly estimate
the variance of the mean from a single systematic sample
 Could be less precise than SRS
When to use:
 If the ordering of the population is essentially random
 When stratification with numerous data is used
3. Stratified random sampling- population [N] is divided into a number
Advantages:
 Gain in the precision of the estimates of characteristics of the
population
 It allows for more comprehensive data analysis since information is
provided for each stratum
 Accommodate administrative convenience, fieldwork is organized by
strata, which usually result in saving in cost
 Accommodate different sampling plans in different strata
Disadvantages:
 Sampling frame is necessary for every stratum
 Prior information about the population and its subpopulations is
necessary for stratification purposes
When to use:
 Population is known to be heterogeneous or the population can be
subdivided into mutually exclusive and exhaustive groups
4. Cluster sampling- used when the population is very large and widely spread out
over a wide range of geographical area
Advantages:
 Sampling frame for the entire population is not necessary, only a
frame of clusters, i.e., a list of clusters in the population
 Reduced listing and transportation costs
 The procedure saves time, effort and money
Disadvantages:
 Entail more statistical analysis
 Estimation procedures are difficult, especially when the clusters are of
unequal size
When to use
 Sampling frame is not available and the cost of constructing such a
frame is very high
 For economic consideration, i.e., when the time, effort and cost
involved in obtaining information on the population units increase as
the distances separating these units increase
5. Multistage sampling- the selection of sample is done in two or more stages
Advantages:
 Like cluster sampling, transportation and listing cost are reduced
Disadvantages:
 The procedures are difficult, especially when the first-stage units are
not of the same size
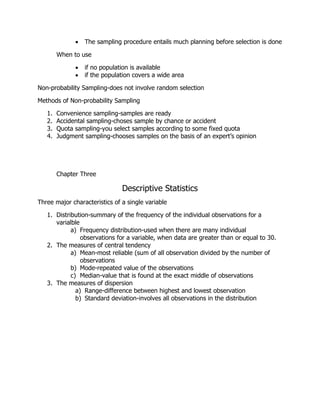
 The sampling procedure entails much planning before selection is done
When to use
 if no population is available
 if the population covers a wide area
Non-probability Sampling-does not involve random selection
Methods of Non-probability Sampling
1. Convenience sampling-samples are ready
2. Accidental sampling-choses sample by chance or accident
3. Quota sampling-you select samples according to some fixed quota
4. Judgment sampling-chooses samples on the basis of an expert’s opinion
Chapter Three
Descriptive Statistics
Three major characteristics of a single variable
1. Distribution-summary of the frequency of the individual observations for a
varialble
a) Frequency distribution-used when there are many individual
observations for a variable, when data are greater than or equal to 30.
2. The measures of central tendency
a) Mean-most reliable (sum of all observation divided by the number of
observations
b) Mode-repeated value of the observations
c) Median-value that is found at the exact middle of observations
3. The measures of dispersion
a) Range-difference between highest and lowest observation
b) Standard deviation-involves all observations in the distribution

More Related Content

What's hot (20)

PPT
Use of Biostatics in Dentistry /certified fixed orthodontic courses by Indian...
Indian dental academy
 
PPT
Chapter 1: Statistics
Andrilyn Alcantara
 
PPT
Biostatistics
priyarokz
 
PPT
Introduction to basic concept in sampling and sampling techniques
Jezhabeth Villegas
 
PPTX
Sampling fundamentals
Thangamani Ramalingam
 
PPT
Introduction to Statistics and Statistical Inference
Jezhabeth Villegas
 
PPTX
Biostatics
Navneet Randhawa
 
PPTX
Introduction to Statistics (Part -I)
YesAnalytics
 
PDF
Basic statistics concepts
ECRD2015
 
PDF
Introduction to biostatistics
Weam Banjar
 
PPTX
Biostats in ortho
Raunak Manjeet
 
PDF
2 biostatistics presenting data
Dr. Nazar Jaf
 
PPTX
Descriptive statistics
Attaullah Khan
 
PPTX
Statistics
itutor
 
PDF
2. sampling techniques
Debasish Padhy
 
PPTX
biostatistics
Mehul Shinde
 
PPTX
Statistics:Fundamentals Of Statistics
St Mary's College,Thrissur,Kerala
 
PPTX
Descriptive statistics
Abdul Kader
 
PPTX
Statistics
Manish Runthala
 
PPTX
Research methodology unit6
Aman Adhikari
 
Use of Biostatics in Dentistry /certified fixed orthodontic courses by Indian...
Indian dental academy
 
Chapter 1: Statistics
Andrilyn Alcantara
 
Biostatistics
priyarokz
 
Introduction to basic concept in sampling and sampling techniques
Jezhabeth Villegas
 
Sampling fundamentals
Thangamani Ramalingam
 
Introduction to Statistics and Statistical Inference
Jezhabeth Villegas
 
Biostatics
Navneet Randhawa
 
Introduction to Statistics (Part -I)
YesAnalytics
 
Basic statistics concepts
ECRD2015
 
Introduction to biostatistics
Weam Banjar
 
Biostats in ortho
Raunak Manjeet
 
2 biostatistics presenting data
Dr. Nazar Jaf
 
Descriptive statistics
Attaullah Khan
 
Statistics
itutor
 
2. sampling techniques
Debasish Padhy
 
biostatistics
Mehul Shinde
 
Statistics:Fundamentals Of Statistics
St Mary's College,Thrissur,Kerala
 
Descriptive statistics
Abdul Kader
 
Statistics
Manish Runthala
 
Research methodology unit6
Aman Adhikari
 

Similar to Statistics (20)

PPTX
chapter 1.pptx
ObsaHassanMohamed
 
PDF
Statistics for Data Analytics
SSaudia
 
PPTX
Statistics and prob.
Emmanuel Alimpolos
 
PPTX
Statistics and prob.
Emmanuel Alimpolos
 
PPT
A basic Introduction To Statistics with examples
ShibsekharRoy1
 
PPTX
Stat-Lesson.pptx
JennilynFeliciano2
 
PPTX
SAMPLING TECHNIQUES.pptx
MayFerry
 
PPT
Introduction-To-Statistics-18032022-010747pm (1).ppt
Israr36
 
PPT
Intro statistics
Arash Kamrani
 
PPTX
biostats.pptx hjvbuvfyjgvguyjgvfvtfugvghjbk
anweshagarg49
 
PPTX
introduction to statistical theory
Unsa Shakir
 
PPTX
Statistics ppt.ppt
Heni524956
 
PPTX
BASIC CONCEPTS in STAT 1 [Autosaved].pptx
JhunafilRas2
 
PPT
Introduction to statistics
Shaamma(Simi_ch) Fiverr
 
PPT
Manpreet kay bhatia Business Statistics.ppt
Noorien3
 
PPT
Introduction To Statistics.ppt
Manish Agarwal
 
PPTX
biostatistics-210618023858.pptx bbbbbbbbbb
RAMJIBANYADAV2
 
PPTX
Biostatistics in Orthodontics -ARATHY.pptx
ARATHY91
 
PPTX
chapter one business mathematical statistics.pptx
sadiqfarhan2
 
PPTX
Presentation1
Nalini Singh
 
chapter 1.pptx
ObsaHassanMohamed
 
Statistics for Data Analytics
SSaudia
 
Statistics and prob.
Emmanuel Alimpolos
 
Statistics and prob.
Emmanuel Alimpolos
 
A basic Introduction To Statistics with examples
ShibsekharRoy1
 
Stat-Lesson.pptx
JennilynFeliciano2
 
SAMPLING TECHNIQUES.pptx
MayFerry
 
Introduction-To-Statistics-18032022-010747pm (1).ppt
Israr36
 
Intro statistics
Arash Kamrani
 
biostats.pptx hjvbuvfyjgvguyjgvfvtfugvghjbk
anweshagarg49
 
introduction to statistical theory
Unsa Shakir
 
Statistics ppt.ppt
Heni524956
 
BASIC CONCEPTS in STAT 1 [Autosaved].pptx
JhunafilRas2
 
Introduction to statistics
Shaamma(Simi_ch) Fiverr
 
Manpreet kay bhatia Business Statistics.ppt
Noorien3
 
Introduction To Statistics.ppt
Manish Agarwal
 
biostatistics-210618023858.pptx bbbbbbbbbb
RAMJIBANYADAV2
 
Biostatistics in Orthodontics -ARATHY.pptx
ARATHY91
 
chapter one business mathematical statistics.pptx
sadiqfarhan2
 
Presentation1
Nalini Singh
 
Ad

More from University of Cebu (9)

DOCX
Phases of od
University of Cebu
 
DOCX
Executive functions
University of Cebu
 
DOCX
In basket technique
University of Cebu
 
DOCX
Hr planning, recruitment and selection
University of Cebu
 
PPT
Projective Technique
University of Cebu
 
PPTX
Social system and organizational culture
University of Cebu
 
PPTX
Philippine Business
University of Cebu
 
PPTX
Phases of Organizational Development
University of Cebu
 
PPTX
Marketing Trend
University of Cebu
 
Phases of od
University of Cebu
 
Executive functions
University of Cebu
 
In basket technique
University of Cebu
 
Hr planning, recruitment and selection
University of Cebu
 
Projective Technique
University of Cebu
 
Social system and organizational culture
University of Cebu
 
Philippine Business
University of Cebu
 
Phases of Organizational Development
University of Cebu
 
Marketing Trend
University of Cebu
 
Ad

Recently uploaded (20)

PPTX
CLEFT LIP AND PALATE: NURSING MANAGEMENT.pptx
PRADEEP ABOTHU
 
PPTX
Views on Education of Indian Thinkers Mahatma Gandhi.pptx
ShrutiMahanta1
 
PDF
Federal dollars withheld by district, charter, grant recipient
Mebane Rash
 
PPTX
Nutrition Month 2025 TARP.pptx presentation
FairyLouHernandezMej
 
PPTX
Blanket Order in Odoo 17 Purchase App - Odoo Slides
Celine George
 
PPTX
PPT on the Development of Education in the Victorian England
Beena E S
 
PPSX
Health Planning in india - Unit 03 - CHN 2 - GNM 3RD YEAR.ppsx
Priyanshu Anand
 
PPTX
classroom based quiz bee.pptx...................
ferdinandsanbuenaven
 
PPTX
HEAD INJURY IN CHILDREN: NURSING MANAGEMENGT.pptx
PRADEEP ABOTHU
 
PPTX
Gall bladder, Small intestine and Large intestine.pptx
rekhapositivity
 
PPTX
2025 Winter SWAYAM NPTEL & A Student.pptx
Utsav Yagnik
 
PPTX
How to Define Translation to Custom Module And Add a new language in Odoo 18
Celine George
 
PDF
water conservation .pdf by Nandni Kumari XI C
Directorate of Education Delhi
 
PPTX
SCHOOL-BASED SEXUAL HARASSMENT PREVENTION AND RESPONSE WORKSHOP
komlalokoe
 
PDF
IMP NAAC REFORMS 2024 - 10 Attributes.pdf
BHARTIWADEKAR
 
PDF
IMP NAAC-Reforms-Stakeholder-Consultation-Presentation-on-Draft-Metrics-Unive...
BHARTIWADEKAR
 
PPTX
Capitol Doctoral Presentation -July 2025.pptx
CapitolTechU
 
PPTX
ANORECTAL MALFORMATIONS: NURSING MANAGEMENT.pptx
PRADEEP ABOTHU
 
PPTX
Optimizing Cancer Screening With MCED Technologies: From Science to Practical...
i3 Health
 
PDF
Zoology (Animal Physiology) practical Manual
raviralanaresh2
 
CLEFT LIP AND PALATE: NURSING MANAGEMENT.pptx
PRADEEP ABOTHU
 
Views on Education of Indian Thinkers Mahatma Gandhi.pptx
ShrutiMahanta1
 
Federal dollars withheld by district, charter, grant recipient
Mebane Rash
 
Nutrition Month 2025 TARP.pptx presentation
FairyLouHernandezMej
 
Blanket Order in Odoo 17 Purchase App - Odoo Slides
Celine George
 
PPT on the Development of Education in the Victorian England
Beena E S
 
Health Planning in india - Unit 03 - CHN 2 - GNM 3RD YEAR.ppsx
Priyanshu Anand
 
classroom based quiz bee.pptx...................
ferdinandsanbuenaven
 
HEAD INJURY IN CHILDREN: NURSING MANAGEMENGT.pptx
PRADEEP ABOTHU
 
Gall bladder, Small intestine and Large intestine.pptx
rekhapositivity
 
2025 Winter SWAYAM NPTEL & A Student.pptx
Utsav Yagnik
 
How to Define Translation to Custom Module And Add a new language in Odoo 18
Celine George
 
water conservation .pdf by Nandni Kumari XI C
Directorate of Education Delhi
 
SCHOOL-BASED SEXUAL HARASSMENT PREVENTION AND RESPONSE WORKSHOP
komlalokoe
 
IMP NAAC REFORMS 2024 - 10 Attributes.pdf
BHARTIWADEKAR
 
IMP NAAC-Reforms-Stakeholder-Consultation-Presentation-on-Draft-Metrics-Unive...
BHARTIWADEKAR
 
Capitol Doctoral Presentation -July 2025.pptx
CapitolTechU
 
ANORECTAL MALFORMATIONS: NURSING MANAGEMENT.pptx
PRADEEP ABOTHU
 
Optimizing Cancer Screening With MCED Technologies: From Science to Practical...
i3 Health
 
Zoology (Animal Physiology) practical Manual
raviralanaresh2
 

Statistics

  • 2. Chapter One Introduction Meaning Statistic (singular) - is a science that deals with the principles and procedures for the collection, organization, summarization, presentation and analysis of numerical data. Statistics (plural)-set of data or mass of observation Fields of statistics Mathematical statistics- development and exposition of theories Applied statistics- application of statistical methods to solve real problems Branches of Statistics Descriptive statistics- methods of summarizing and presenting data (collection, extraction, summarization, presentation, measures of central tendency, measures of location and measures of variability) Inferential statistics-the process of drawing and making decision on the population based on evidence obtained from a sample (estimation and hypothesis testing) Classification of Statistics Parametic statistics- is an approach which assumes a random sample from a normal distribution and involves testing of hypothesis about the population parameter  Appropriate for interval and ratio data  Requires large sample size to appeal normality Nonparametic statistics/distribution-free method-is an approach for estimating and hypothesis testing when no underlying data is assumed  Can be used for nominal, ordinal scaled data  Can be used for interval and ratio scaled data where the distribution of the random variable of interest is unspecified  Good when there is not enough sample size to assess the form of the distribution
  • 3. Data- quantities or qualities measured or observed Types of Data 1. Categorical data-uses nonparametic statistics  Nominal scales- values or categories with no particular order Ex: cause of death, gender  Lowest or less precise scale  Can be stored in computer using numbers Nominal scale of measurement- uses numbers merely as a means of separating the properties into different categories  Ordinal scales – values or categories with particular order Ex: pain level, social status  Can be stored in computer using numbers Ordinal scale of measurement-refers to measurements where only the comparisons greater, less or equal between measurements are relevant 2. Continuous Data-uses parametic statistics  Interval scales-measured on a continuum and differences between any two numbers on the scale are of known size: no true zero Ex: Temperature, tons of garbage, number of arrest, income, age  Ratio scales-data with both equal intervals and an absolute zero Ex: weight in pounds, height in centimeters, age in years  Highest or most precise scaled data Ratio scale of measurement is used when not only the order and interval size are important, but also the ratio between two measurements are meaningful. Variables-property that can take on different values or categories which cannot be predicted with certainty Ex: undergraduate majors (BSBA, CRIMINOLOGY), smoking habit, attitude toward the head, height, faculty ranks Types of Variables 1. Explanatory/Independent/ X variables-may be continuous 2. Response/Dependent/Y variables-may be continuous or categorical 3. Control/Z variables Classification of variables a. Qualitative variable- categories are used as labels to distinguish one group from another
  • 4. Ex: cause of death, nationality, race, gender, severity of pain b. Quantitative variable-whose categories can be measured and ordered according to quantity; Ex: number of children in a family, age Quantitative variable classification: i. Discrete variables-values that is either finite or countably infinite  There are gaps between its possible values Ex: number of missing teeth and number of household members ii. Continuous variables- has a set of possible values including all values in an interval of the real line Ex: Body Mass Index, height  There is no gaps between possible values Sources of Data a) Primary source b) Secondary source Presentation of Data a) Textual presentation-uses statements b) Tabular presentation-uses statistical table c) Graphical presentation-uses graph I. Bar graph II. Circle graph III. Line graph
  • 5. Chapter Two Sampling Techniques Population [N]-totality of the individuals Target population-entire set of individuals which we require info from Sampled population-finite set of individuals from which sample is drawn Coverage error-when the sampled population and the target population are not identical Sample-representative portion of the population understudy Principle of Randomization “Four basic reasons for the use of samples” 1. It allows us to obtain information with greater speed 2. It allows us to obtain information with reduced cost 3. It allows us to obtain information over a greater scope 4. It allows us to obtain information with greater accuracy Probability sampling and Non-probability Sampling Probability sampling-uses random selection Methods of Probability Sampling 1. Simple random sampling-choosing a sample from a set Techniques in drawing SRS a) Table of Random Numbers b) Lottery of fishbowl technique May be done in two ways a) With replacement b) Without replacement Advantages  Simple and is more easily understood that other sampling designs Disadvantages  List of all the members in the population is needed.  Assigning numbers to each member of the sampled population is frequently impractical.  It may be difficult to collect the sample data with SRS if the samples are spread inconveniently throughout the population.
  • 6.  It is often less precise than other sampling plans because it disregards any information already known about the population. When to use  When the population is homogeneous with respect to the characteristics understudy. 2. Systematic random sampling-selection of the desired sample in a list by arranging them systematically Formula: 𝑘 = N n Where k=sampling interval N=population size n=sample size Advantages:  Easier to apply and less likely to make mistakes.  It is possible to select a sample in the field without a sampling frame.  It could give more precise estimate than SRS when there is order in the samples Disadvantages:  If periodic regularities are found in the lists, a systematic sample may consist only of similar types  If the population is not in random order, one cannot validly estimate the variance of the mean from a single systematic sample  Could be less precise than SRS When to use:  If the ordering of the population is essentially random  When stratification with numerous data is used 3. Stratified random sampling- population [N] is divided into a number Advantages:  Gain in the precision of the estimates of characteristics of the population  It allows for more comprehensive data analysis since information is provided for each stratum  Accommodate administrative convenience, fieldwork is organized by strata, which usually result in saving in cost
  • 7.  Accommodate different sampling plans in different strata Disadvantages:  Sampling frame is necessary for every stratum  Prior information about the population and its subpopulations is necessary for stratification purposes When to use:  Population is known to be heterogeneous or the population can be subdivided into mutually exclusive and exhaustive groups 4. Cluster sampling- used when the population is very large and widely spread out over a wide range of geographical area Advantages:  Sampling frame for the entire population is not necessary, only a frame of clusters, i.e., a list of clusters in the population  Reduced listing and transportation costs  The procedure saves time, effort and money Disadvantages:  Entail more statistical analysis  Estimation procedures are difficult, especially when the clusters are of unequal size When to use  Sampling frame is not available and the cost of constructing such a frame is very high  For economic consideration, i.e., when the time, effort and cost involved in obtaining information on the population units increase as the distances separating these units increase 5. Multistage sampling- the selection of sample is done in two or more stages Advantages:  Like cluster sampling, transportation and listing cost are reduced Disadvantages:  The procedures are difficult, especially when the first-stage units are not of the same size
  • 8.  The sampling procedure entails much planning before selection is done When to use  if no population is available  if the population covers a wide area Non-probability Sampling-does not involve random selection Methods of Non-probability Sampling 1. Convenience sampling-samples are ready 2. Accidental sampling-choses sample by chance or accident 3. Quota sampling-you select samples according to some fixed quota 4. Judgment sampling-chooses samples on the basis of an expert’s opinion Chapter Three Descriptive Statistics Three major characteristics of a single variable 1. Distribution-summary of the frequency of the individual observations for a varialble a) Frequency distribution-used when there are many individual observations for a variable, when data are greater than or equal to 30. 2. The measures of central tendency a) Mean-most reliable (sum of all observation divided by the number of observations b) Mode-repeated value of the observations c) Median-value that is found at the exact middle of observations 3. The measures of dispersion a) Range-difference between highest and lowest observation b) Standard deviation-involves all observations in the distribution