SlideShare a Scribd company logo
STATISTICS &
 PROBABILITY

Hypothesis Testing
What is a Hypothesis?
I assume the mean    • an assumption about
 GPA of this class     the population
      is 3.5!
                       parameter
             • an educated guess
               about the population
               parameter
Hypotheses Testing: This is the process of
  making an inference or generalization on
population parameters based on the results of
            the study on samples.
                  Reject?
                  Accept?


    Statistical Hypotheses: It is a guess or
        prediction made by the researcher
   regarding the possible outcome of the study.
Hypotheses Testing
is deciding between what is
          REALITY
          and what
     is COINCIDENCE!
Types of Statistical Hypotheses
       Null Hypothesis (Ho): is
       always hoped to be rejected
       Always contains “=“ sign
Alternative Hypothesis (Ha):
•Challenges Ho
•Never contains “=“ sign
•Uses “< or > or ≠ “
•It generally represents the idea
 which the researcher wants to prove.
The Null Hypothesis: Ho
Ex. Ho: The average GPA of this class is 3.5
             µ = 3.5
             H0:
     The Alternative Hypothesis: Ha

     Ha: The average GPA of this class is
             a) higher than 3.5 (Ha: µ > 3.5)
             b) lower than 3.5 (Ha: µ < 3.5)
             c) not equal to 3.5 (Ha:
µ ≠ 3.5)
Types of Hypotheses Tests
1. One-tailed left directional test
   – this is used if Ha uses < symbol


                              Critical value is
α = 0.05                          obtained
                Acceptance     from the table
                  region
           Area = 0.05
   Rejection region
Types of Hypotheses Tests
 2. One-tailed right directional test
    – this is used if Ha uses > symbol


                              Critical value is
α = 0.05     Acceptance
                                  obtained
                               from the table
               region
                   Area= 0.05
                      Rejection region
Types of Hypotheses Tests
3. Two-tailed test: Non-directional
   – this is used if Ha uses ≠ symbol


                                Critical value is
 α = 0.05/2                         obtained
               Acceptance
                                 from the table
                 region

           Area=.025   Area=.025
   Rejection region     Rejection region
Level of Significance, α and the Rejection Region

α 0.05,
 =        means the probability of being right is 95% , and
 the probability of being wrong is 5%. So what is α 0.01?
                                                    =


                                          Rejection region
                  Acceptance              Area is 0.05
                    Region

                                  α = 0.05
                  .
Level of Significance, α and the Rejection Region

α=   0.01, means the researcher is taking a 1% risk of being
 wrong and a 99% risk of being right. So, what is α = 0.05?


 Rejection region
 Area is 0.01     Acceptance
                   Region


         α = 0.01
Level of Significance, α and the Rejection Region

α = 0.05 means the probability of committing Type I error is 5%.

     α = 0.05, since it is 2-T, then α = 0.05/2= 0.025


                       Acceptance
                         region


                 Area=.025     Area=.025
         Rejection region       Rejection region
Level of Significance, α and the Rejection
                         Region
To summarize:
α
= 0.05,  means the probability of being right is 95% and the
 probability of being wrong is 5%. So what is α 0.01?
                                                 =


α=    0.01, means the researcher is taking a 1% risk of being
 wrong and a 99% risk of being right. So, what is α = 0.05?

α = 0.05 means the probability of committing Type I error is
5%.
                   α
      So what is       = 0.01?
Errors in Hypothesis Testing


                                           Ho: ERAP is not guilty
Type I (α error )         Errors
Rejecting a true                             If the court convicts
      Ho!                                    ERAP, when in fact
                                              he is not guilty, the
                    Errors in Decisions
                                                 court commits
                                                  Type I error!

                Errors in Conclusions

   Type I is the same as the       α or the level of significance.
                                                  © 1984-1994 T/Maker Co.
Errors in Hypothesis Testing


Type II (β error )     Errors
Accepting a false                      Ho: ERAP is not guilty
      Ho!
                                           If the court acquits
                 Errors in Decisions       ERAP, when in fact
                                             he is guilty, the
                                              court commits
                                              Type II error!
                 Errors in Conclusions
Decisions made regarding Ho
 (Reject Ho/Do not reject Ho)

If we reject Ho, it means it is wrong!


       If we do not reject Ho,
    it doesn’t mean it is correct,
          we just don’t have
           enough evidence
              to reject it!


                                 © 1984-1994 T/Maker Co.
Testing the Significance of Difference Between Means


      Z-test
                         σ   is known
      n ≥ 30

     t-test
                        σ is unknown
     n < 30

     F-test
                         3 or more µ s
   (ANOVA)
Testing the Significance of Difference Between Means
       “n is large or when n ≥ 30 & σ is known.”

              Z-test               σ   is known
              n ≥ 30
      • Hypothesized/population mean VS Sample mean
       and population standard deviation is known.


       Z=
          (x − µ )    n     x - is the sample mean
                            µ - is the population mean
                 σ          n - is the sample size
                           σ - is the population std. dev.
              Using PHStat: Go to…
“One-Sample Tests; Z-Test for the Mean:Sigma Known”
Testing the Significance of Difference Between Means
      “n is large or when n ≥ 30 & σ is known.”
           Z-test
                                σ   is known
           n ≥ 30
         • Sample mean 1 VS Sample mean 2
      and population standard deviation is known.


        x1 − x 2          x1 - is the mean of sample 1
   Z=                     x 2 - is the mean of sample 2
          1 1
      σ     +        n1 & n2 - are the sample
          n1 n2           σ - is the population std. dev.
                             sizes
Testing the Significance of Difference Between Means
      “n is large or when n ≥ 30 & σ is known.”
              Z-test
                                  σ is unknown
              n ≥ 30
           • Sample mean 1 VS Sample mean 2
       and 2 sample standard deviations are known.

                            x1 - is the mean of sample 1
       x1 − x 2
 Z=                         x 2 - is the mean of sample 2
       s12 s2 2 n1 & n2 - are the sample
          +
       n1 n2 s1 & s2 - are the sample std. devs.
                        sizes
Using Microsoft Excel: Go to…“Z-Test: Two-Sample For Means”
The Critical Value Approach in
        Testing the Significance of Difference
                    Between Means
The 5-step solution
Step 1. Formulate Ho and Ha

Step 2. Set the level of significance α , usually
        it is given in the problem.
Step 3. Formulate the decision rule (when to reject Ho);
        Find the critical value/P-value.
Step 4. Make your decision.

Step 5. Formulate your conclusion.
Approaches in
                      Hypothesis Testing

                  Critical value    p- value
                    approach        approach

      Computed vs. Critical                      p-valueα vs.α
                                                    α ≤
5-step solution                    5-step solution
1.Ho: ___________                  1.Ho : ___________
   Ha: ___________                   Ha : ___________
2.α = ___; Cri-value= ______       2. α = ___; p- value=________
                                       α
3. Decision rule: Reject Ho        3. Decision rule: Reject Ho if
 if Comp − value ≥ Cri − value       p- value ≤ α
                                               ≤α
4. Decision:     α                 4. Decision:
5. Conclusion:                     5. Conclusion:
Finding Critical Values: One-Tailed
    What Is Z Given α = 0.05?


       .45
             .05
  Α= α = .05
                      Z         4     5
       Z=1.65
     Critical value   1.5   .4382   .4394
                      1.6   .4495   .4505
Critical Values: Z - Table

                  α         .01            0.05
       Type
       One-T            ±   2.33        ± 1.65
       Two-T            ±   2.58       ±   1.96

You will refer to this table to get the critical value of Z
or the Z tabular .
CRITERION:
1. One-tailed test (right directional)
   “Reject H0 if Zc ≥ Zt “
2. One-tailed test (left directional)
   “Reject H0 if Zc ≤ Zt
3. Two-tailed test (Zc = +)
    “Reject H0 if Zc ≥ Zt “
4. Two-tailed test (Zc = -)
    ‘Reject H0 if Zc ≤ Zt “
EXERCISES:
1. Past records showed that the average
 final examination grade of students in
 Statistics was 70 with standard deviation
 of 8.0. A random sample of 100 students
 was taken and found to have a mean final
 examination grade of 71.8. Is this an
 indication that the sample grade is better
 than the rest of the students? Test at 0.05
 level of significance.
2. A certain type of battery is known to have
 a mean life of 60 hours. In random sample
 of 40 batteries, the mean life was found to
 be 58 hours with a standard deviation of
 4.5 hours. Does it indicate that the mean
 lifetime of such battery has been reduced?
 Test at 0.01 level of significance.
3. The manager of a rent-a-car business
  wants to know whether the true average
  numbers of cars rented a day is 25 with a
  standard deviation of 6.9 rentals. A
  random sample of 30 days was taken and
  found to have an average of 22.8 rentals.
  Is there a significance between the mean
  and the sample mean? Test at 0.05 level
  of significance.
4. Advertisements claim that the average
 nicotine content of a certain kind of
 cigarette is 0.30 milligram. Suspecting that
 this figure is too low, a consumer
 protection service takes a random sample
 of 50 of these cigarette from different
 production slots and find that their nicotine
 content has a mean of 0.33 milligram with
 a standard deviation of 0.18 milligram.
 Use the 0.05 level of significance to test
 the null hypothesis µ = 0.30 against the
 alternative hypothesis µ < 0.30.
5. An experiment was planned to compare the mean time
   (in days) required to recover from common cold for
   person given a daily doze of 4 mgs. of vitamin C versus
   those who were not given a vitamin supplement.
   Suppose that 35 adults were randomly selected for each
   treatment category and that the mean recovery times
   and standard deviations for the 2 groups were as
   follows:
                     n         X         δ
   W/ vit. C        35        5.8       1.2
   W/o vit. C       35        6.9       5.8
  Suppose your research objective is to show that the use
   of vit. C increases the mean time required to recover
   from common cold. Test using α = 0.05.
Ad

More Related Content

What's hot (20)

Mann Whitney U test
Mann Whitney U testMann Whitney U test
Mann Whitney U test
Dr. Ankit Gaur
 
Lesson 24 testing the hypothesis
Lesson 24 testing the hypothesisLesson 24 testing the hypothesis
Lesson 24 testing the hypothesis
mjlobetos
 
SCATTER PLOTS
SCATTER PLOTSSCATTER PLOTS
SCATTER PLOTS
ONE Virtual Services
 
Inferential Statistics
Inferential StatisticsInferential Statistics
Inferential Statistics
University of Jaffna
 
SAMPLING and SAMPLING DISTRIBUTION
SAMPLING and SAMPLING DISTRIBUTIONSAMPLING and SAMPLING DISTRIBUTION
SAMPLING and SAMPLING DISTRIBUTION
Ria Micor
 
Independent sample t test
Independent sample t testIndependent sample t test
Independent sample t test
Shajar Khan
 
Advance Statistics - Wilcoxon Signed Rank Test
Advance Statistics - Wilcoxon Signed Rank TestAdvance Statistics - Wilcoxon Signed Rank Test
Advance Statistics - Wilcoxon Signed Rank Test
Joshua Batalla
 
Binary Logistic Regression
Binary Logistic RegressionBinary Logistic Regression
Binary Logistic Regression
Seth Anandaram Jaipuria College
 
Testing for normality
Testing for normalityTesting for normality
Testing for normality
Dr. Ankita Srivastava
 
Correlational research
Correlational researchCorrelational research
Correlational research
Azura Zaki
 
4. parameter and statistic
4. parameter and statistic4. parameter and statistic
4. parameter and statistic
ONE Virtual Services
 
Simple Linear Regression (simplified)
Simple Linear Regression (simplified)Simple Linear Regression (simplified)
Simple Linear Regression (simplified)
Haoran Zhang
 
Mann Whitney U Test | Statistics
Mann Whitney U Test | StatisticsMann Whitney U Test | Statistics
Mann Whitney U Test | Statistics
Transweb Global Inc
 
Data analysis with spss anova
Data analysis with spss anovaData analysis with spss anova
Data analysis with spss anova
Surjeet Randhir Singh Dhaka
 
Statistical inference
Statistical inferenceStatistical inference
Statistical inference
Jags Jagdish
 
Regression analysis
Regression analysisRegression analysis
Regression analysis
Teachers Mitraa
 
Inferential statistics powerpoint
Inferential statistics powerpointInferential statistics powerpoint
Inferential statistics powerpoint
kellula
 
Linear Regression Using SPSS
Linear Regression Using SPSSLinear Regression Using SPSS
Linear Regression Using SPSS
Dr Athar Khan
 
Basis of statistical inference
Basis of statistical inferenceBasis of statistical inference
Basis of statistical inference
zahidacademy
 
Introduction to ANOVAs
Introduction to ANOVAsIntroduction to ANOVAs
Introduction to ANOVAs
florentinoz
 
Lesson 24 testing the hypothesis
Lesson 24 testing the hypothesisLesson 24 testing the hypothesis
Lesson 24 testing the hypothesis
mjlobetos
 
SAMPLING and SAMPLING DISTRIBUTION
SAMPLING and SAMPLING DISTRIBUTIONSAMPLING and SAMPLING DISTRIBUTION
SAMPLING and SAMPLING DISTRIBUTION
Ria Micor
 
Independent sample t test
Independent sample t testIndependent sample t test
Independent sample t test
Shajar Khan
 
Advance Statistics - Wilcoxon Signed Rank Test
Advance Statistics - Wilcoxon Signed Rank TestAdvance Statistics - Wilcoxon Signed Rank Test
Advance Statistics - Wilcoxon Signed Rank Test
Joshua Batalla
 
Correlational research
Correlational researchCorrelational research
Correlational research
Azura Zaki
 
Simple Linear Regression (simplified)
Simple Linear Regression (simplified)Simple Linear Regression (simplified)
Simple Linear Regression (simplified)
Haoran Zhang
 
Mann Whitney U Test | Statistics
Mann Whitney U Test | StatisticsMann Whitney U Test | Statistics
Mann Whitney U Test | Statistics
Transweb Global Inc
 
Statistical inference
Statistical inferenceStatistical inference
Statistical inference
Jags Jagdish
 
Inferential statistics powerpoint
Inferential statistics powerpointInferential statistics powerpoint
Inferential statistics powerpoint
kellula
 
Linear Regression Using SPSS
Linear Regression Using SPSSLinear Regression Using SPSS
Linear Regression Using SPSS
Dr Athar Khan
 
Basis of statistical inference
Basis of statistical inferenceBasis of statistical inference
Basis of statistical inference
zahidacademy
 
Introduction to ANOVAs
Introduction to ANOVAsIntroduction to ANOVAs
Introduction to ANOVAs
florentinoz
 

Viewers also liked (15)

Hypothesis Testing
Hypothesis TestingHypothesis Testing
Hypothesis Testing
Jeremy Lane
 
Lect w6 hypothesis_testing
Lect w6 hypothesis_testingLect w6 hypothesis_testing
Lect w6 hypothesis_testing
Rione Drevale
 
Statistics Presentation week 6
Statistics Presentation week 6Statistics Presentation week 6
Statistics Presentation week 6
krookroo
 
Discrete & Continuous Data
Discrete & Continuous DataDiscrete & Continuous Data
Discrete & Continuous Data
Bitsy Griffin
 
discrete and continuous data
discrete and continuous datadiscrete and continuous data
discrete and continuous data
Skills for Life, Suffolk New college
 
Exercise 5:Continuous and Discrete Variable
Exercise 5:Continuous and Discrete VariableExercise 5:Continuous and Discrete Variable
Exercise 5:Continuous and Discrete Variable
Andrilyn Alcantara
 
Discrete And Continuous Simulation
Discrete And Continuous SimulationDiscrete And Continuous Simulation
Discrete And Continuous Simulation
Nguyen Chien
 
parametric test of difference z test f test one-way_two-way_anova
parametric test of difference z test f test one-way_two-way_anova parametric test of difference z test f test one-way_two-way_anova
parametric test of difference z test f test one-way_two-way_anova
Tess Anoza
 
Sampling distribution
Sampling distributionSampling distribution
Sampling distribution
Nilanjan Bhaumik
 
Variables
 Variables Variables
Variables
shoffma5
 
Research Design
Research DesignResearch Design
Research Design
gaurav22
 
Hypothesis
HypothesisHypothesis
Hypothesis
Michael Gezae
 
Hypothesis testing ppt final
Hypothesis testing ppt finalHypothesis testing ppt final
Hypothesis testing ppt final
piyushdhaker
 
Test of hypothesis
Test of hypothesisTest of hypothesis
Test of hypothesis
vikramlawand
 
Hypothesis testing; z test, t-test. f-test
Hypothesis testing; z test, t-test. f-testHypothesis testing; z test, t-test. f-test
Hypothesis testing; z test, t-test. f-test
Shakehand with Life
 
Hypothesis Testing
Hypothesis TestingHypothesis Testing
Hypothesis Testing
Jeremy Lane
 
Lect w6 hypothesis_testing
Lect w6 hypothesis_testingLect w6 hypothesis_testing
Lect w6 hypothesis_testing
Rione Drevale
 
Statistics Presentation week 6
Statistics Presentation week 6Statistics Presentation week 6
Statistics Presentation week 6
krookroo
 
Discrete & Continuous Data
Discrete & Continuous DataDiscrete & Continuous Data
Discrete & Continuous Data
Bitsy Griffin
 
Exercise 5:Continuous and Discrete Variable
Exercise 5:Continuous and Discrete VariableExercise 5:Continuous and Discrete Variable
Exercise 5:Continuous and Discrete Variable
Andrilyn Alcantara
 
Discrete And Continuous Simulation
Discrete And Continuous SimulationDiscrete And Continuous Simulation
Discrete And Continuous Simulation
Nguyen Chien
 
parametric test of difference z test f test one-way_two-way_anova
parametric test of difference z test f test one-way_two-way_anova parametric test of difference z test f test one-way_two-way_anova
parametric test of difference z test f test one-way_two-way_anova
Tess Anoza
 
Variables
 Variables Variables
Variables
shoffma5
 
Research Design
Research DesignResearch Design
Research Design
gaurav22
 
Hypothesis testing ppt final
Hypothesis testing ppt finalHypothesis testing ppt final
Hypothesis testing ppt final
piyushdhaker
 
Test of hypothesis
Test of hypothesisTest of hypothesis
Test of hypothesis
vikramlawand
 
Hypothesis testing; z test, t-test. f-test
Hypothesis testing; z test, t-test. f-testHypothesis testing; z test, t-test. f-test
Hypothesis testing; z test, t-test. f-test
Shakehand with Life
 
Ad

Similar to Statistics Presentation week 7 (20)

Hypothesis testing
Hypothesis testingHypothesis testing
Hypothesis testing
Lorelyn Turtosa-Dumaug
 
STATISTICS: Hypothesis Testing
STATISTICS: Hypothesis TestingSTATISTICS: Hypothesis Testing
STATISTICS: Hypothesis Testing
jundumaug1
 
Critical Value and The P Value
Critical Value and The P ValueCritical Value and The P Value
Critical Value and The P Value
Pharmacy Universe
 
Testing of hypothesis
Testing of hypothesisTesting of hypothesis
Testing of hypothesis
RuchiJainRuchiJain
 
Tests of significance
Tests of significanceTests of significance
Tests of significance
Shubhanshu Gupta
 
Unit 2 Testing of Hypothesis - Hypothesis - Null, Alternative, Type 1 and 2 a...
Unit 2 Testing of Hypothesis - Hypothesis - Null, Alternative, Type 1 and 2 a...Unit 2 Testing of Hypothesis - Hypothesis - Null, Alternative, Type 1 and 2 a...
Unit 2 Testing of Hypothesis - Hypothesis - Null, Alternative, Type 1 and 2 a...
Ravinandan A P
 
hypothesis-tesing.pdf
hypothesis-tesing.pdfhypothesis-tesing.pdf
hypothesis-tesing.pdf
Sandeep Phogat
 
Hypothesis_Testing.ppt
Hypothesis_Testing.pptHypothesis_Testing.ppt
Hypothesis_Testing.ppt
ssuserac2a40
 
Top schools in delhi ncr
Top schools in delhi ncrTop schools in delhi ncr
Top schools in delhi ncr
Edhole.com
 
Testing of hypothesis
Testing of hypothesisTesting of hypothesis
Testing of hypothesis
Jags Jagdish
 
Testing of hypothesis
Testing of hypothesisTesting of hypothesis
Testing of hypothesis
Sanjay Basukala
 
Hypothesis testing
Hypothesis testingHypothesis testing
Hypothesis testing
Kaimrc_Rss_Jd
 
Econometrics chapter 5-two-variable-regression-interval-estimation-
Econometrics chapter 5-two-variable-regression-interval-estimation-Econometrics chapter 5-two-variable-regression-interval-estimation-
Econometrics chapter 5-two-variable-regression-interval-estimation-
Alamin Milton
 
Biostatistics Made Ridiculously Simple by Dr. Aryan (Medical Booklet Series b...
Biostatistics Made Ridiculously Simple by Dr. Aryan (Medical Booklet Series b...Biostatistics Made Ridiculously Simple by Dr. Aryan (Medical Booklet Series b...
Biostatistics Made Ridiculously Simple by Dr. Aryan (Medical Booklet Series b...
Dr. Aryan (Anish Dhakal)
 
hypothesis.pptx
hypothesis.pptxhypothesis.pptx
hypothesis.pptx
PrakharMishra925441
 
More Statistics
More StatisticsMore Statistics
More Statistics
mandrewmartin
 
Testing Hypothesis
Testing HypothesisTesting Hypothesis
Testing Hypothesis
Azmi Mohd Tamil
 
Unit 3
Unit 3Unit 3
Unit 3
Rai University
 
30043005-Hypothesis-Test-Full chapter.pptx
30043005-Hypothesis-Test-Full chapter.pptx30043005-Hypothesis-Test-Full chapter.pptx
30043005-Hypothesis-Test-Full chapter.pptx
shyam1985
 
hypothesis testing and statistical infernce.pptx
hypothesis testing and statistical infernce.pptxhypothesis testing and statistical infernce.pptx
hypothesis testing and statistical infernce.pptx
rehabonehealthcare
 
STATISTICS: Hypothesis Testing
STATISTICS: Hypothesis TestingSTATISTICS: Hypothesis Testing
STATISTICS: Hypothesis Testing
jundumaug1
 
Critical Value and The P Value
Critical Value and The P ValueCritical Value and The P Value
Critical Value and The P Value
Pharmacy Universe
 
Unit 2 Testing of Hypothesis - Hypothesis - Null, Alternative, Type 1 and 2 a...
Unit 2 Testing of Hypothesis - Hypothesis - Null, Alternative, Type 1 and 2 a...Unit 2 Testing of Hypothesis - Hypothesis - Null, Alternative, Type 1 and 2 a...
Unit 2 Testing of Hypothesis - Hypothesis - Null, Alternative, Type 1 and 2 a...
Ravinandan A P
 
Hypothesis_Testing.ppt
Hypothesis_Testing.pptHypothesis_Testing.ppt
Hypothesis_Testing.ppt
ssuserac2a40
 
Top schools in delhi ncr
Top schools in delhi ncrTop schools in delhi ncr
Top schools in delhi ncr
Edhole.com
 
Testing of hypothesis
Testing of hypothesisTesting of hypothesis
Testing of hypothesis
Jags Jagdish
 
Econometrics chapter 5-two-variable-regression-interval-estimation-
Econometrics chapter 5-two-variable-regression-interval-estimation-Econometrics chapter 5-two-variable-regression-interval-estimation-
Econometrics chapter 5-two-variable-regression-interval-estimation-
Alamin Milton
 
Biostatistics Made Ridiculously Simple by Dr. Aryan (Medical Booklet Series b...
Biostatistics Made Ridiculously Simple by Dr. Aryan (Medical Booklet Series b...Biostatistics Made Ridiculously Simple by Dr. Aryan (Medical Booklet Series b...
Biostatistics Made Ridiculously Simple by Dr. Aryan (Medical Booklet Series b...
Dr. Aryan (Anish Dhakal)
 
30043005-Hypothesis-Test-Full chapter.pptx
30043005-Hypothesis-Test-Full chapter.pptx30043005-Hypothesis-Test-Full chapter.pptx
30043005-Hypothesis-Test-Full chapter.pptx
shyam1985
 
hypothesis testing and statistical infernce.pptx
hypothesis testing and statistical infernce.pptxhypothesis testing and statistical infernce.pptx
hypothesis testing and statistical infernce.pptx
rehabonehealthcare
 
Ad

Recently uploaded (20)

Canadian book publishing: Insights from the latest salary survey - Tech Forum...
Canadian book publishing: Insights from the latest salary survey - Tech Forum...Canadian book publishing: Insights from the latest salary survey - Tech Forum...
Canadian book publishing: Insights from the latest salary survey - Tech Forum...
BookNet Canada
 
Connect and Protect: Networks and Network Security
Connect and Protect: Networks and Network SecurityConnect and Protect: Networks and Network Security
Connect and Protect: Networks and Network Security
VICTOR MAESTRE RAMIREZ
 
TrsLabs Consultants - DeFi, WEb3, Token Listing
TrsLabs Consultants - DeFi, WEb3, Token ListingTrsLabs Consultants - DeFi, WEb3, Token Listing
TrsLabs Consultants - DeFi, WEb3, Token Listing
Trs Labs
 
Webinar - Top 5 Backup Mistakes MSPs and Businesses Make .pptx
Webinar - Top 5 Backup Mistakes MSPs and Businesses Make   .pptxWebinar - Top 5 Backup Mistakes MSPs and Businesses Make   .pptx
Webinar - Top 5 Backup Mistakes MSPs and Businesses Make .pptx
MSP360
 
The Future of Cisco Cloud Security: Innovations and AI Integration
The Future of Cisco Cloud Security: Innovations and AI IntegrationThe Future of Cisco Cloud Security: Innovations and AI Integration
The Future of Cisco Cloud Security: Innovations and AI Integration
Re-solution Data Ltd
 
Viam product demo_ Deploying and scaling AI with hardware.pdf
Viam product demo_ Deploying and scaling AI with hardware.pdfViam product demo_ Deploying and scaling AI with hardware.pdf
Viam product demo_ Deploying and scaling AI with hardware.pdf
camilalamoratta
 
fennec fox optimization algorithm for optimal solution
fennec fox optimization algorithm for optimal solutionfennec fox optimization algorithm for optimal solution
fennec fox optimization algorithm for optimal solution
shallal2
 
Bepents tech services - a premier cybersecurity consulting firm
Bepents tech services - a premier cybersecurity consulting firmBepents tech services - a premier cybersecurity consulting firm
Bepents tech services - a premier cybersecurity consulting firm
Benard76
 
Web and Graphics Designing Training in Rajpura
Web and Graphics Designing Training in RajpuraWeb and Graphics Designing Training in Rajpura
Web and Graphics Designing Training in Rajpura
Erginous Technology
 
AsyncAPI v3 : Streamlining Event-Driven API Design
AsyncAPI v3 : Streamlining Event-Driven API DesignAsyncAPI v3 : Streamlining Event-Driven API Design
AsyncAPI v3 : Streamlining Event-Driven API Design
leonid54
 
The No-Code Way to Build a Marketing Team with One AI Agent (Download the n8n...
The No-Code Way to Build a Marketing Team with One AI Agent (Download the n8n...The No-Code Way to Build a Marketing Team with One AI Agent (Download the n8n...
The No-Code Way to Build a Marketing Team with One AI Agent (Download the n8n...
SOFTTECHHUB
 
TrsLabs - Fintech Product & Business Consulting
TrsLabs - Fintech Product & Business ConsultingTrsLabs - Fintech Product & Business Consulting
TrsLabs - Fintech Product & Business Consulting
Trs Labs
 
Unlocking Generative AI in your Web Apps
Unlocking Generative AI in your Web AppsUnlocking Generative AI in your Web Apps
Unlocking Generative AI in your Web Apps
Maximiliano Firtman
 
Vaibhav Gupta BAML: AI work flows without Hallucinations
Vaibhav Gupta BAML: AI work flows without HallucinationsVaibhav Gupta BAML: AI work flows without Hallucinations
Vaibhav Gupta BAML: AI work flows without Hallucinations
john409870
 
The Microsoft Excel Parts Presentation.pdf
The Microsoft Excel Parts Presentation.pdfThe Microsoft Excel Parts Presentation.pdf
The Microsoft Excel Parts Presentation.pdf
YvonneRoseEranista
 
AI You Can Trust: The Critical Role of Governance and Quality.pdf
AI You Can Trust: The Critical Role of Governance and Quality.pdfAI You Can Trust: The Critical Role of Governance and Quality.pdf
AI You Can Trust: The Critical Role of Governance and Quality.pdf
Precisely
 
The Changing Compliance Landscape in 2025.pdf
The Changing Compliance Landscape in 2025.pdfThe Changing Compliance Landscape in 2025.pdf
The Changing Compliance Landscape in 2025.pdf
Precisely
 
Q1 2025 Dropbox Earnings and Investor Presentation
Q1 2025 Dropbox Earnings and Investor PresentationQ1 2025 Dropbox Earnings and Investor Presentation
Q1 2025 Dropbox Earnings and Investor Presentation
Dropbox
 
Heap, Types of Heap, Insertion and Deletion
Heap, Types of Heap, Insertion and DeletionHeap, Types of Heap, Insertion and Deletion
Heap, Types of Heap, Insertion and Deletion
Jaydeep Kale
 
How analogue intelligence complements AI
How analogue intelligence complements AIHow analogue intelligence complements AI
How analogue intelligence complements AI
Paul Rowe
 
Canadian book publishing: Insights from the latest salary survey - Tech Forum...
Canadian book publishing: Insights from the latest salary survey - Tech Forum...Canadian book publishing: Insights from the latest salary survey - Tech Forum...
Canadian book publishing: Insights from the latest salary survey - Tech Forum...
BookNet Canada
 
Connect and Protect: Networks and Network Security
Connect and Protect: Networks and Network SecurityConnect and Protect: Networks and Network Security
Connect and Protect: Networks and Network Security
VICTOR MAESTRE RAMIREZ
 
TrsLabs Consultants - DeFi, WEb3, Token Listing
TrsLabs Consultants - DeFi, WEb3, Token ListingTrsLabs Consultants - DeFi, WEb3, Token Listing
TrsLabs Consultants - DeFi, WEb3, Token Listing
Trs Labs
 
Webinar - Top 5 Backup Mistakes MSPs and Businesses Make .pptx
Webinar - Top 5 Backup Mistakes MSPs and Businesses Make   .pptxWebinar - Top 5 Backup Mistakes MSPs and Businesses Make   .pptx
Webinar - Top 5 Backup Mistakes MSPs and Businesses Make .pptx
MSP360
 
The Future of Cisco Cloud Security: Innovations and AI Integration
The Future of Cisco Cloud Security: Innovations and AI IntegrationThe Future of Cisco Cloud Security: Innovations and AI Integration
The Future of Cisco Cloud Security: Innovations and AI Integration
Re-solution Data Ltd
 
Viam product demo_ Deploying and scaling AI with hardware.pdf
Viam product demo_ Deploying and scaling AI with hardware.pdfViam product demo_ Deploying and scaling AI with hardware.pdf
Viam product demo_ Deploying and scaling AI with hardware.pdf
camilalamoratta
 
fennec fox optimization algorithm for optimal solution
fennec fox optimization algorithm for optimal solutionfennec fox optimization algorithm for optimal solution
fennec fox optimization algorithm for optimal solution
shallal2
 
Bepents tech services - a premier cybersecurity consulting firm
Bepents tech services - a premier cybersecurity consulting firmBepents tech services - a premier cybersecurity consulting firm
Bepents tech services - a premier cybersecurity consulting firm
Benard76
 
Web and Graphics Designing Training in Rajpura
Web and Graphics Designing Training in RajpuraWeb and Graphics Designing Training in Rajpura
Web and Graphics Designing Training in Rajpura
Erginous Technology
 
AsyncAPI v3 : Streamlining Event-Driven API Design
AsyncAPI v3 : Streamlining Event-Driven API DesignAsyncAPI v3 : Streamlining Event-Driven API Design
AsyncAPI v3 : Streamlining Event-Driven API Design
leonid54
 
The No-Code Way to Build a Marketing Team with One AI Agent (Download the n8n...
The No-Code Way to Build a Marketing Team with One AI Agent (Download the n8n...The No-Code Way to Build a Marketing Team with One AI Agent (Download the n8n...
The No-Code Way to Build a Marketing Team with One AI Agent (Download the n8n...
SOFTTECHHUB
 
TrsLabs - Fintech Product & Business Consulting
TrsLabs - Fintech Product & Business ConsultingTrsLabs - Fintech Product & Business Consulting
TrsLabs - Fintech Product & Business Consulting
Trs Labs
 
Unlocking Generative AI in your Web Apps
Unlocking Generative AI in your Web AppsUnlocking Generative AI in your Web Apps
Unlocking Generative AI in your Web Apps
Maximiliano Firtman
 
Vaibhav Gupta BAML: AI work flows without Hallucinations
Vaibhav Gupta BAML: AI work flows without HallucinationsVaibhav Gupta BAML: AI work flows without Hallucinations
Vaibhav Gupta BAML: AI work flows without Hallucinations
john409870
 
The Microsoft Excel Parts Presentation.pdf
The Microsoft Excel Parts Presentation.pdfThe Microsoft Excel Parts Presentation.pdf
The Microsoft Excel Parts Presentation.pdf
YvonneRoseEranista
 
AI You Can Trust: The Critical Role of Governance and Quality.pdf
AI You Can Trust: The Critical Role of Governance and Quality.pdfAI You Can Trust: The Critical Role of Governance and Quality.pdf
AI You Can Trust: The Critical Role of Governance and Quality.pdf
Precisely
 
The Changing Compliance Landscape in 2025.pdf
The Changing Compliance Landscape in 2025.pdfThe Changing Compliance Landscape in 2025.pdf
The Changing Compliance Landscape in 2025.pdf
Precisely
 
Q1 2025 Dropbox Earnings and Investor Presentation
Q1 2025 Dropbox Earnings and Investor PresentationQ1 2025 Dropbox Earnings and Investor Presentation
Q1 2025 Dropbox Earnings and Investor Presentation
Dropbox
 
Heap, Types of Heap, Insertion and Deletion
Heap, Types of Heap, Insertion and DeletionHeap, Types of Heap, Insertion and Deletion
Heap, Types of Heap, Insertion and Deletion
Jaydeep Kale
 
How analogue intelligence complements AI
How analogue intelligence complements AIHow analogue intelligence complements AI
How analogue intelligence complements AI
Paul Rowe
 

Statistics Presentation week 7

  • 2. What is a Hypothesis? I assume the mean • an assumption about GPA of this class the population is 3.5! parameter • an educated guess about the population parameter
  • 3. Hypotheses Testing: This is the process of making an inference or generalization on population parameters based on the results of the study on samples. Reject? Accept? Statistical Hypotheses: It is a guess or prediction made by the researcher regarding the possible outcome of the study.
  • 4. Hypotheses Testing is deciding between what is REALITY and what is COINCIDENCE!
  • 5. Types of Statistical Hypotheses Null Hypothesis (Ho): is always hoped to be rejected Always contains “=“ sign Alternative Hypothesis (Ha): •Challenges Ho •Never contains “=“ sign •Uses “< or > or ≠ “ •It generally represents the idea which the researcher wants to prove.
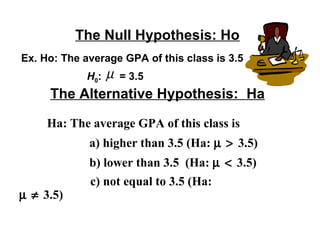
  • 6. The Null Hypothesis: Ho Ex. Ho: The average GPA of this class is 3.5 µ = 3.5 H0: The Alternative Hypothesis: Ha Ha: The average GPA of this class is a) higher than 3.5 (Ha: µ > 3.5) b) lower than 3.5 (Ha: µ < 3.5) c) not equal to 3.5 (Ha: µ ≠ 3.5)
  • 7. Types of Hypotheses Tests 1. One-tailed left directional test – this is used if Ha uses < symbol Critical value is α = 0.05 obtained Acceptance from the table region Area = 0.05 Rejection region
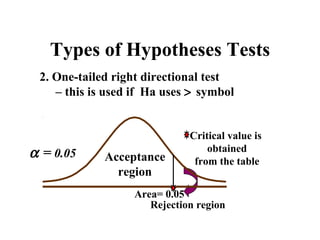
  • 8. Types of Hypotheses Tests 2. One-tailed right directional test – this is used if Ha uses > symbol Critical value is α = 0.05 Acceptance obtained from the table region Area= 0.05 Rejection region
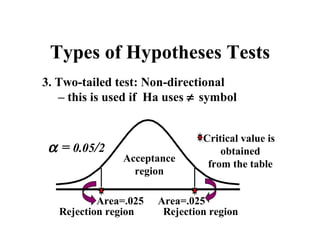
  • 9. Types of Hypotheses Tests 3. Two-tailed test: Non-directional – this is used if Ha uses ≠ symbol Critical value is α = 0.05/2 obtained Acceptance from the table region Area=.025 Area=.025 Rejection region Rejection region
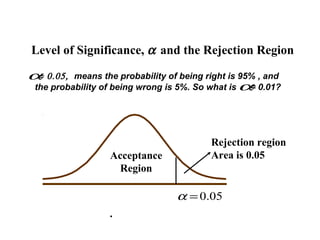
  • 10. Level of Significance, α and the Rejection Region α 0.05, = means the probability of being right is 95% , and the probability of being wrong is 5%. So what is α 0.01? = Rejection region Acceptance Area is 0.05 Region α = 0.05 .
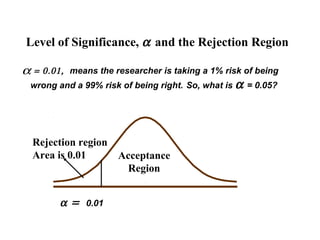
  • 11. Level of Significance, α and the Rejection Region α= 0.01, means the researcher is taking a 1% risk of being wrong and a 99% risk of being right. So, what is α = 0.05? Rejection region Area is 0.01 Acceptance Region α = 0.01
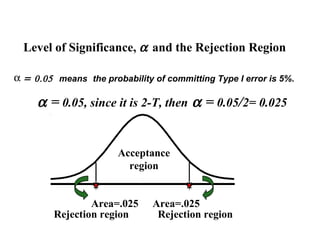
  • 12. Level of Significance, α and the Rejection Region α = 0.05 means the probability of committing Type I error is 5%. α = 0.05, since it is 2-T, then α = 0.05/2= 0.025 Acceptance region Area=.025 Area=.025 Rejection region Rejection region
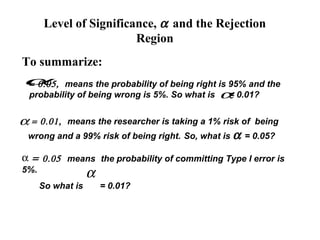
  • 13. Level of Significance, α and the Rejection Region To summarize: α = 0.05, means the probability of being right is 95% and the probability of being wrong is 5%. So what is α 0.01? = α= 0.01, means the researcher is taking a 1% risk of being wrong and a 99% risk of being right. So, what is α = 0.05? α = 0.05 means the probability of committing Type I error is 5%. α So what is = 0.01?
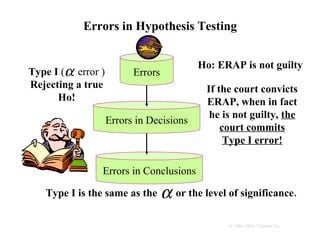
  • 14. Errors in Hypothesis Testing Ho: ERAP is not guilty Type I (α error ) Errors Rejecting a true If the court convicts Ho! ERAP, when in fact he is not guilty, the Errors in Decisions court commits Type I error! Errors in Conclusions Type I is the same as the α or the level of significance. © 1984-1994 T/Maker Co.
  • 15. Errors in Hypothesis Testing Type II (β error ) Errors Accepting a false Ho: ERAP is not guilty Ho! If the court acquits Errors in Decisions ERAP, when in fact he is guilty, the court commits Type II error! Errors in Conclusions
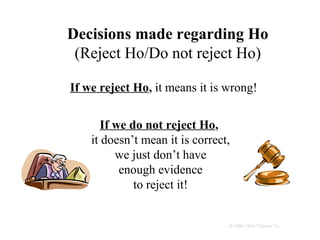
  • 16. Decisions made regarding Ho (Reject Ho/Do not reject Ho) If we reject Ho, it means it is wrong! If we do not reject Ho, it doesn’t mean it is correct, we just don’t have enough evidence to reject it! © 1984-1994 T/Maker Co.
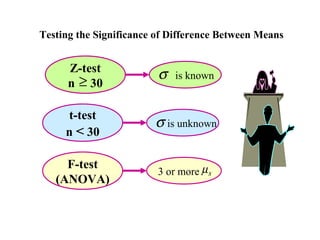
  • 17. Testing the Significance of Difference Between Means Z-test σ is known n ≥ 30 t-test σ is unknown n < 30 F-test 3 or more µ s (ANOVA)
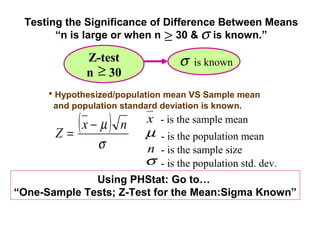
  • 18. Testing the Significance of Difference Between Means “n is large or when n ≥ 30 & σ is known.” Z-test σ is known n ≥ 30 • Hypothesized/population mean VS Sample mean and population standard deviation is known. Z= (x − µ ) n x - is the sample mean µ - is the population mean σ n - is the sample size σ - is the population std. dev. Using PHStat: Go to… “One-Sample Tests; Z-Test for the Mean:Sigma Known”
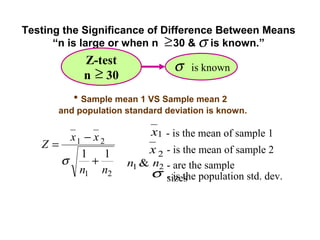
  • 19. Testing the Significance of Difference Between Means “n is large or when n ≥ 30 & σ is known.” Z-test σ is known n ≥ 30 • Sample mean 1 VS Sample mean 2 and population standard deviation is known. x1 − x 2 x1 - is the mean of sample 1 Z= x 2 - is the mean of sample 2 1 1 σ + n1 & n2 - are the sample n1 n2 σ - is the population std. dev. sizes
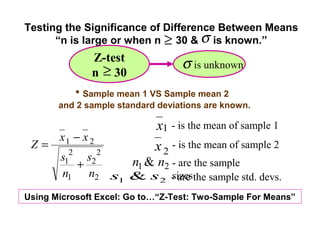
  • 20. Testing the Significance of Difference Between Means “n is large or when n ≥ 30 & σ is known.” Z-test σ is unknown n ≥ 30 • Sample mean 1 VS Sample mean 2 and 2 sample standard deviations are known. x1 - is the mean of sample 1 x1 − x 2 Z= x 2 - is the mean of sample 2 s12 s2 2 n1 & n2 - are the sample + n1 n2 s1 & s2 - are the sample std. devs. sizes Using Microsoft Excel: Go to…“Z-Test: Two-Sample For Means”
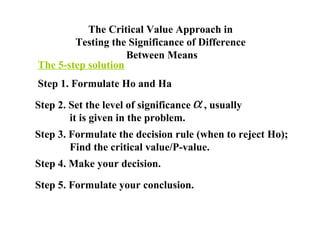
  • 21. The Critical Value Approach in Testing the Significance of Difference Between Means The 5-step solution Step 1. Formulate Ho and Ha Step 2. Set the level of significance α , usually it is given in the problem. Step 3. Formulate the decision rule (when to reject Ho); Find the critical value/P-value. Step 4. Make your decision. Step 5. Formulate your conclusion.
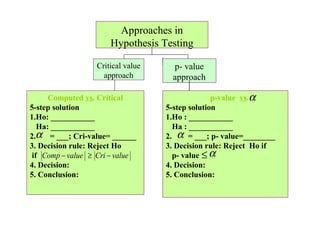
  • 22. Approaches in Hypothesis Testing Critical value p- value approach approach Computed vs. Critical p-valueα vs.α α ≤ 5-step solution 5-step solution 1.Ho: ___________ 1.Ho : ___________ Ha: ___________ Ha : ___________ 2.α = ___; Cri-value= ______ 2. α = ___; p- value=________ α 3. Decision rule: Reject Ho 3. Decision rule: Reject Ho if if Comp − value ≥ Cri − value p- value ≤ α ≤α 4. Decision: α 4. Decision: 5. Conclusion: 5. Conclusion:
  • 23. Finding Critical Values: One-Tailed What Is Z Given α = 0.05? .45 .05 Α= α = .05 Z 4 5 Z=1.65 Critical value 1.5 .4382 .4394 1.6 .4495 .4505
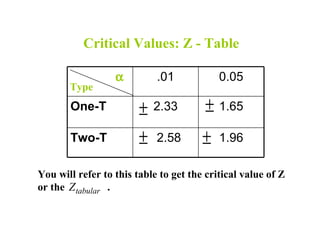
  • 24. Critical Values: Z - Table α .01 0.05 Type One-T ± 2.33 ± 1.65 Two-T ± 2.58 ± 1.96 You will refer to this table to get the critical value of Z or the Z tabular .
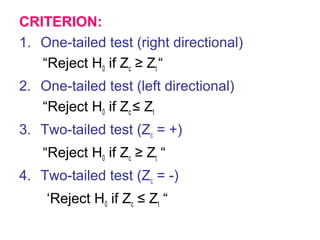
  • 25. CRITERION: 1. One-tailed test (right directional) “Reject H0 if Zc ≥ Zt “ 2. One-tailed test (left directional) “Reject H0 if Zc ≤ Zt 3. Two-tailed test (Zc = +) “Reject H0 if Zc ≥ Zt “ 4. Two-tailed test (Zc = -) ‘Reject H0 if Zc ≤ Zt “
  • 26. EXERCISES: 1. Past records showed that the average final examination grade of students in Statistics was 70 with standard deviation of 8.0. A random sample of 100 students was taken and found to have a mean final examination grade of 71.8. Is this an indication that the sample grade is better than the rest of the students? Test at 0.05 level of significance.
  • 27. 2. A certain type of battery is known to have a mean life of 60 hours. In random sample of 40 batteries, the mean life was found to be 58 hours with a standard deviation of 4.5 hours. Does it indicate that the mean lifetime of such battery has been reduced? Test at 0.01 level of significance.
  • 28. 3. The manager of a rent-a-car business wants to know whether the true average numbers of cars rented a day is 25 with a standard deviation of 6.9 rentals. A random sample of 30 days was taken and found to have an average of 22.8 rentals. Is there a significance between the mean and the sample mean? Test at 0.05 level of significance.
  • 29. 4. Advertisements claim that the average nicotine content of a certain kind of cigarette is 0.30 milligram. Suspecting that this figure is too low, a consumer protection service takes a random sample of 50 of these cigarette from different production slots and find that their nicotine content has a mean of 0.33 milligram with a standard deviation of 0.18 milligram. Use the 0.05 level of significance to test the null hypothesis µ = 0.30 against the alternative hypothesis µ < 0.30.
  • 30. 5. An experiment was planned to compare the mean time (in days) required to recover from common cold for person given a daily doze of 4 mgs. of vitamin C versus those who were not given a vitamin supplement. Suppose that 35 adults were randomly selected for each treatment category and that the mean recovery times and standard deviations for the 2 groups were as follows: n X δ W/ vit. C 35 5.8 1.2 W/o vit. C 35 6.9 5.8 Suppose your research objective is to show that the use of vit. C increases the mean time required to recover from common cold. Test using α = 0.05.