SlideShare a Scribd company logo
Business Statistics:
Data-Driven Decision
Making
•BY- SUVIDHA CHAPLOT
CONTENTS
01
Introduction to
Business Statistics
02
Descriptive Statistics:
Summarizing Data
03
Data Presentation &
Visualization
04
Sampling Techniques
05
Statistical Inference
06
Correlation and
Regression
01
Introduction to Business Statistics
Why Statistics Matter in Business
01
03
02
Key Statistical Concepts
Descriptive statistics, sampling, statistical
inference, correlation, and regression are
fundamental for business operations and
decision-making.
Informed Decisions
Statistics provides tools for data analysis and
interpretation, leading to informed decisions;
essential for navigating complex business
environments.
Unit Overview
We will explore essential statistical methods,
equipping businesses with the ability to apply
them effectively.
The Power of Data Analysis
Data-Driven Insights
Statistics enables businesses to
extract meaningful insights from
data; this helps to identify
trends, patterns, and
relationships.
Improving Business
Outcomes
Analyzing data leads to optimized
strategies, improved operations,
and enhanced decision-making for
better business outcomes.
Staying Competitive
In today's data-rich environment,
statistical analysis is crucial for
staying competitive and adapting
to market changes.
02
Descriptive Statistics: Summarizing Data
Measures of Central Tendency
Mode: The Most Frequent Value
The data point that appears most often; identifies the
most common occurrence; useful for categorical data
and identifying trends.
Mean: The Average Value
Calculated by adding all values and dividing
by the number of observations; provides a
typical value; useful for general overview.
Median: The Middle Value
The central point in an ordered dataset; useful
when data is skewed by outliers; reflects a more
accurate central value.
Measures of Dispersion
The difference between the
highest and lowest values;
offers a simple view of data
spread; sensitive to extreme
values.
Range: Quick Spread
Assessment
Average of squared
differences from the mean;
indicates data variability;
more complex but
comprehensive measure of
spread.
Variance: Measuring Data
Deviation
Square root of variance;
expresses variability in
original data units; easier to
interpret in the context of
the
data.
Standard Deviation:
Interpretable Dispersion
Presenting Data Visually
Importance of Visualization
Visual aids enhance understanding
and make complex data more
accessible and easier to interpret for
decision-makers.
Enhancing Data Clarity
Well-designed visuals can reveal
patterns and insights that might be
missed in raw data; improving
communication effectiveness.
Accessibility and Engagement
Visual presentations can engage a
wider audience and simplify complex
information, leading to better
understanding and decision-making.
Types of Data
Quantitative Data: Measurable Metrics
Numeric data that can be measured and quantified; includes sales
figures, revenue, and employee performance metrics.
Qualitative Data: Categorical Insights
Non-numeric data categorized into groups; examples include
customer preferences, product types, and geographical regions.
03
Data Presentation &
Visualization
有赞云发展历程
Pie Charts: Proportions of a Whole
Circular charts divided into slices;
represents proportions of a whole; best
for showing relative percentages of
categories.
Histograms: Distribution of
Quantitative Data
Displays data distribution across
intervals or bins; helps identify skewness
and outliers; essential for understanding
data patterns.
Bar Charts: Representing
Categories
Rectangular bars representing
categorical data; bar length corresponds
to the category's frequency or value for
quick comparisons.
Frequency Distributions: Tabular
Representation
Tabular data showing outcomes'
frequency; visualized as histograms;
provides a clear count of how often each
value occurs.
Cumulative Frequency Curves
Curves showing accumulated frequencies
as data increases; determines
observations below a value; great for
complex analysis.
Graphical Methods
04
Sampling Techniques
Random Sampling
Equal Chance of Selection
Every individual has an equal chance; minimizes bias; foundational for unbiased data
collection and representation.
Reducing Selection Bias
Helps avoid systematic errors; ensures sample fairly represents population; improves the
reliability of statistical inference.
Foundation for Unbiased Analysis
Provides a solid base for reliable conclusions; essential for trustworthy results; helps to
make valid data-driven decisions.
Stratified Sampling
01 Dividing into Subgroups (Strata)
Population divided into subgroups; random samples taken from each subgroup;
ensures representation across all segments.
02
Ensuring Segment Representation
Guarantees each segment in the population is represented; provides a more accurate
and comprehensive view for analysis.
03
Comprehensive Population View
Useful in highly varied populations; helps to uncover insights that might be missed
using simpler sampling methods.
Systematic Sampling
Selecting Every Nth Item
Selecting every nth item from a list after a random start; simple method;
potential bias if there's order in the data.
Simplicity and Efficiency
Efficient sampling; quick to implement; suited to situations where a list is
readily available and manageable.
Potential for Bias
If data has recurring patterns, sampling can lead to inaccurate results;
critical to be aware of potential bias.
05
Statistical Inference
Confidence Intervals
A range of values where the population
parameter falls within; helps to quantify
uncertainty; essential for informed
decisions.
Defining the Range of Values
A 95% confidence interval means a 95%
probability true mean lies within the
range; expresses precision in estimates.
Probability of True Mean
Indicates estimate accuracy; provides a
measure of confidence; informs
decision-makers about the range of
potential values.
Assessing Estimation Accuracy
Hypothesis Testing
Involves formulating null (no effect) and alternative
(effect tested) hypotheses; guides statistical testing
& interpretations.
Null & Alternative Hypotheses
Used to test assumptions about a population; a
structured method to validate claims; provides
data-driven validation.
Testing Assumptions
Used to determine whether evidence supports
rejecting or accepting the null hypothesis;
fundamental for informed decision-making.
Data-Driven Decisions
Common Hypothesis Tests
01 T-Test: Comparing Two Means
Compares means of two groups; determines if significant difference exists;
useful for assessing group-based changes.
02 Chi-Square Test: Categorical Data
For categorical data; assesses if observed frequencies match expected
frequencies; evaluates independence between variables.
03 Z-Test: Comparing Sample to Population
Compares sample data to a population; variance is known; useful to see if new
data deviates significantly from known data.
06
Correlation and Regression
Correlation
03
02
01
1 Measuring Variable
relationships
Measures strength and direction
between two variables; use to
understand the nature of
associations; essential for insight.
2 Pearson Correlation
Coefficient
Ranges from -1 to +1; quantifies
relationship; 0 indicates no
relationship; the most practical form
measure for correlation.
3 Identifying Key Relationships
Relationship understanding lets
businesses pinpoint key factors;
improve strategies; use information
to enhance outcomes.
Predicting Variable Values
Predicts one variable based on
another; establishes predictive models;
useful for forecasting future values.
Forecasting Business Outcomes
Regression analysis used to forecast sales based on advertisement expenditure;
aids strategic planning and budgeting models.
Fits a straight line to data; dependent
variable predicted; model provides an
equation for forecasting; basic form of
regression.
Simple Linear Regression
Regression
02
03
01
07
Case Studies and Applications
Real-World Examples
01 Applying Statistical
Methods
Showcasing business
statistic applications;
demonstrates practical
relevance; increases
understanding of methods'
potential.
03 Data-Driven Success
Stories
Presents successes from
data-backed strategies;
reinforces data role;
promotes adoption of
statistics to gain business
results.
02 Solving Business
Problems
Discuss how statistical
techniques resolve issues;
highlight real-world impact;
emphasizes usefulness for
decision-making.
Optimizing Business Strategies
Aligning Strategy with Insights
Discuss aligning strategies with data-driven insights; showcases
transformation; strengthens data's influence on corporate strategy.
01
Case Demonstrations
Case studies on how companies leverage statistics; emphasize application;
helps to translate data driven strategies for real-world uses.
02
Making Data-Based Decisions
Discuss using analytics to make decisions; showcase effectiveness; ensures
insights are both accurate and useful.
03
08
Conclusion
Strategic Use of Statistics
03
02
01
1 Recap and Summary
Restate business statistics
importance; highlight analysis and
decisions; underscore role to
success.
2 Embracing Data-Driven
Culture
Encourage data as an integral
aspect; foster insights-led culture;
promotes statistics for all decision
purposes.
3 Future Business Statistics
Data growth trends; discuss
advanced analytics; underline data
importance for future tasks and
future operations.
•Thank you

More Related Content

Similar to SUVIDHA CHAPLOT Business Statistics_ Data-Driven Decision Making.pptx (20)

PPTX
Unit 2_ Descriptive Analytics for MBA .pptx
JANNU VINAY
 
PDF
201505 Statistical Thinking course extract
Jefferson Lynch
 
PPTX
BDA_MO_1_S6_Basic_data_analytics_,reporting,_and_apply_basic_data.pptx
HarikaNimmaganti1
 
PPTX
Business Analytics MBA LPU lovely professional university
✮ Abhishek Sharma ✮
 
PPTX
Statistical Learning - Introduction.pptx
JayaprakashGururaj
 
DOCX
2 Chapter 1 The Where, Why, and How of Data Collection Busines.docx
lorainedeserre
 
PPTX
1505 Statistical Thinking course extract
Jefferson Lynch
 
PPTX
APPLICATION OF STATISTICS IN BUSINESS with Graphs | Business Statistics
Hassan Shaheer
 
PPTX
Introduction-to-Data-Analysis_Final Content.pptx
ItismeItisnotme
 
PPTX
DA-Module 1.pptx
vijayapraba1
 
PPTX
01-introduction-240417110739-ee694cd2.pptx
JetSiegbert
 
PPTX
Making Sense of Data - 3rd Sector Learning Lab
Improvement Skills Consulting Ltd.
 
PPTX
Basic Statistics for Paid Search Advertising
Nina Estenzo
 
PPTX
Data Science topic and introduction to basic concepts involving data manageme...
aashishreddy10
 
PPT
Chapter 12
Cheryl Lawson
 
PPTX
Chapter 1.ppjjjjjjjhhhhhhhhhhhhhhhhhhhhhhhh
javediqra40
 
PPT
Business analysis
Firas Shahbaa
 
PPTX
Business Statistics PPT Unit 1 by Priya Singh.pptx
priyasinghy107
 
PDF
Analytics
Vishnu Rajendran C R
 
Unit 2_ Descriptive Analytics for MBA .pptx
JANNU VINAY
 
201505 Statistical Thinking course extract
Jefferson Lynch
 
BDA_MO_1_S6_Basic_data_analytics_,reporting,_and_apply_basic_data.pptx
HarikaNimmaganti1
 
Business Analytics MBA LPU lovely professional university
✮ Abhishek Sharma ✮
 
Statistical Learning - Introduction.pptx
JayaprakashGururaj
 
2 Chapter 1 The Where, Why, and How of Data Collection Busines.docx
lorainedeserre
 
1505 Statistical Thinking course extract
Jefferson Lynch
 
APPLICATION OF STATISTICS IN BUSINESS with Graphs | Business Statistics
Hassan Shaheer
 
Introduction-to-Data-Analysis_Final Content.pptx
ItismeItisnotme
 
DA-Module 1.pptx
vijayapraba1
 
01-introduction-240417110739-ee694cd2.pptx
JetSiegbert
 
Making Sense of Data - 3rd Sector Learning Lab
Improvement Skills Consulting Ltd.
 
Basic Statistics for Paid Search Advertising
Nina Estenzo
 
Data Science topic and introduction to basic concepts involving data manageme...
aashishreddy10
 
Chapter 12
Cheryl Lawson
 
Chapter 1.ppjjjjjjjhhhhhhhhhhhhhhhhhhhhhhhh
javediqra40
 
Business analysis
Firas Shahbaa
 
Business Statistics PPT Unit 1 by Priya Singh.pptx
priyasinghy107
 

More from CA Suvidha Chaplot (20)

PDF
Cost_Accounting_vs_Financial_Accounting_Infographics_by_CA_Suvidha_Chaplot.pdf
CA Suvidha Chaplot
 
PDF
Costing_101_Infographics_by_CA_Suvidha_Chaplot (1).pdf
CA Suvidha Chaplot
 
PDF
ERP_Infographics_by_CA_Suvidha_Chaplot.pdf
CA Suvidha Chaplot
 
PDF
Operations_Management_Key_Decisions_by_CA_Suvidha_Chaplot.pdf
CA Suvidha Chaplot
 
PDF
AI_Automation_Operations_Infographics_CA_Suvidha_Chaplot.pdf
CA Suvidha Chaplot
 
PDF
Power_of_Data_Analytics_in_HR_by_CA_Suvidha_Chaplot.pdf
CA Suvidha Chaplot
 
PDF
The_Employee_Lifecycle_Infographics_by_CA_Suvidha_Chaplot.pdf
CA Suvidha Chaplot
 
PDF
Workforce_Planning_Infographics_by_CA_Suvidha_Chaplot.pdf
CA Suvidha Chaplot
 
PDF
The_Future_of_HR_Infographics_by_CA_Suvidha_Chaplot.pdf
CA Suvidha Chaplot
 
PDF
50_30_20_Budgeting_Rule_by_CA_Suvidha_Chaplot (2).pdf
CA Suvidha Chaplot
 
PDF
From_Income_to_Wealth_by_CA_Suvidha_Chaplot.pdf
CA Suvidha Chaplot
 
PDF
6_Golden_Rules_Financial_Management_CA_Suvidha_Chaplot.pdf
CA Suvidha Chaplot
 
PDF
Budgeting_Infographics_CA_Suvidha_Chaplot.pdf
CA Suvidha Chaplot
 
PDF
Eisenhower_Matrix_Series_by_CA_Suvidha_Chaplot.pdf
CA Suvidha Chaplot
 
PDF
Daily_Habits_Infographic_Series_by_CA_Suvidha_Chaplot.pdf
CA Suvidha Chaplot
 
PDF
How_to_Speak_Finance_Like_a_Pro_by_CA_Suvidha_Chaplot (1).pdf
CA Suvidha Chaplot
 
PDF
Understanding_EBITDA_ROI_ROE_by_CA_Suvidha_Chaplot (1).pdf
CA Suvidha Chaplot
 
PDF
Understanding_EBITDA_ROI_ROE_by_CA_Suvidha_Chaplot.pdf
CA Suvidha Chaplot
 
PDF
KPIs_Every_Manager_Should_Know_by_CA_Suvidha_Chaplot.pdf
CA Suvidha Chaplot
 
PDF
How_to_Build_a_Strategic_Plan_in_7_Steps_CA_Suvidha_Chaplot.pdf
CA Suvidha Chaplot
 
Cost_Accounting_vs_Financial_Accounting_Infographics_by_CA_Suvidha_Chaplot.pdf
CA Suvidha Chaplot
 
Costing_101_Infographics_by_CA_Suvidha_Chaplot (1).pdf
CA Suvidha Chaplot
 
ERP_Infographics_by_CA_Suvidha_Chaplot.pdf
CA Suvidha Chaplot
 
Operations_Management_Key_Decisions_by_CA_Suvidha_Chaplot.pdf
CA Suvidha Chaplot
 
AI_Automation_Operations_Infographics_CA_Suvidha_Chaplot.pdf
CA Suvidha Chaplot
 
Power_of_Data_Analytics_in_HR_by_CA_Suvidha_Chaplot.pdf
CA Suvidha Chaplot
 
The_Employee_Lifecycle_Infographics_by_CA_Suvidha_Chaplot.pdf
CA Suvidha Chaplot
 
Workforce_Planning_Infographics_by_CA_Suvidha_Chaplot.pdf
CA Suvidha Chaplot
 
The_Future_of_HR_Infographics_by_CA_Suvidha_Chaplot.pdf
CA Suvidha Chaplot
 
50_30_20_Budgeting_Rule_by_CA_Suvidha_Chaplot (2).pdf
CA Suvidha Chaplot
 
From_Income_to_Wealth_by_CA_Suvidha_Chaplot.pdf
CA Suvidha Chaplot
 
6_Golden_Rules_Financial_Management_CA_Suvidha_Chaplot.pdf
CA Suvidha Chaplot
 
Budgeting_Infographics_CA_Suvidha_Chaplot.pdf
CA Suvidha Chaplot
 
Eisenhower_Matrix_Series_by_CA_Suvidha_Chaplot.pdf
CA Suvidha Chaplot
 
Daily_Habits_Infographic_Series_by_CA_Suvidha_Chaplot.pdf
CA Suvidha Chaplot
 
How_to_Speak_Finance_Like_a_Pro_by_CA_Suvidha_Chaplot (1).pdf
CA Suvidha Chaplot
 
Understanding_EBITDA_ROI_ROE_by_CA_Suvidha_Chaplot (1).pdf
CA Suvidha Chaplot
 
Understanding_EBITDA_ROI_ROE_by_CA_Suvidha_Chaplot.pdf
CA Suvidha Chaplot
 
KPIs_Every_Manager_Should_Know_by_CA_Suvidha_Chaplot.pdf
CA Suvidha Chaplot
 
How_to_Build_a_Strategic_Plan_in_7_Steps_CA_Suvidha_Chaplot.pdf
CA Suvidha Chaplot
 
Ad

Recently uploaded (20)

PPTX
classroom based quiz bee.pptx...................
ferdinandsanbuenaven
 
PPTX
Gall bladder, Small intestine and Large intestine.pptx
rekhapositivity
 
PPTX
ANORECTAL MALFORMATIONS: NURSING MANAGEMENT.pptx
PRADEEP ABOTHU
 
PPTX
Capitol Doctoral Presentation -July 2025.pptx
CapitolTechU
 
PDF
IMP NAAC REFORMS 2024 - 10 Attributes.pdf
BHARTIWADEKAR
 
PDF
Comprehensive Guide to Writing Effective Literature Reviews for Academic Publ...
AJAYI SAMUEL
 
PPTX
Optimizing Cancer Screening With MCED Technologies: From Science to Practical...
i3 Health
 
PPTX
PPT on the Development of Education in the Victorian England
Beena E S
 
PPTX
CONVULSIVE DISORDERS: NURSING MANAGEMENT.pptx
PRADEEP ABOTHU
 
PPTX
Optimizing Cancer Screening With MCED Technologies: From Science to Practical...
i3 Health
 
PDF
BÀI TẬP BỔ TRỢ THEO LESSON TIẾNG ANH - I-LEARN SMART WORLD 7 - CẢ NĂM - CÓ ĐÁ...
Nguyen Thanh Tu Collection
 
PPTX
Nutri-QUIZ-Bee-Elementary.pptx...................
ferdinandsanbuenaven
 
PPT
digestive system for Pharm d I year HAP
rekhapositivity
 
PPSX
Health Planning in india - Unit 03 - CHN 2 - GNM 3RD YEAR.ppsx
Priyanshu Anand
 
PDF
Federal dollars withheld by district, charter, grant recipient
Mebane Rash
 
PDF
Zoology (Animal Physiology) practical Manual
raviralanaresh2
 
PPTX
How to Define Translation to Custom Module And Add a new language in Odoo 18
Celine George
 
PPTX
THE HUMAN INTEGUMENTARY SYSTEM#MLT#BCRAPC.pptx
Subham Panja
 
PPTX
SAMPLING: DEFINITION,PROCESS,TYPES,SAMPLE SIZE, SAMPLING ERROR.pptx
PRADEEP ABOTHU
 
PPTX
Folding Off Hours in Gantt View in Odoo 18.2
Celine George
 
classroom based quiz bee.pptx...................
ferdinandsanbuenaven
 
Gall bladder, Small intestine and Large intestine.pptx
rekhapositivity
 
ANORECTAL MALFORMATIONS: NURSING MANAGEMENT.pptx
PRADEEP ABOTHU
 
Capitol Doctoral Presentation -July 2025.pptx
CapitolTechU
 
IMP NAAC REFORMS 2024 - 10 Attributes.pdf
BHARTIWADEKAR
 
Comprehensive Guide to Writing Effective Literature Reviews for Academic Publ...
AJAYI SAMUEL
 
Optimizing Cancer Screening With MCED Technologies: From Science to Practical...
i3 Health
 
PPT on the Development of Education in the Victorian England
Beena E S
 
CONVULSIVE DISORDERS: NURSING MANAGEMENT.pptx
PRADEEP ABOTHU
 
Optimizing Cancer Screening With MCED Technologies: From Science to Practical...
i3 Health
 
BÀI TẬP BỔ TRỢ THEO LESSON TIẾNG ANH - I-LEARN SMART WORLD 7 - CẢ NĂM - CÓ ĐÁ...
Nguyen Thanh Tu Collection
 
Nutri-QUIZ-Bee-Elementary.pptx...................
ferdinandsanbuenaven
 
digestive system for Pharm d I year HAP
rekhapositivity
 
Health Planning in india - Unit 03 - CHN 2 - GNM 3RD YEAR.ppsx
Priyanshu Anand
 
Federal dollars withheld by district, charter, grant recipient
Mebane Rash
 
Zoology (Animal Physiology) practical Manual
raviralanaresh2
 
How to Define Translation to Custom Module And Add a new language in Odoo 18
Celine George
 
THE HUMAN INTEGUMENTARY SYSTEM#MLT#BCRAPC.pptx
Subham Panja
 
SAMPLING: DEFINITION,PROCESS,TYPES,SAMPLE SIZE, SAMPLING ERROR.pptx
PRADEEP ABOTHU
 
Folding Off Hours in Gantt View in Odoo 18.2
Celine George
 
Ad

SUVIDHA CHAPLOT Business Statistics_ Data-Driven Decision Making.pptx

  • 2. CONTENTS 01 Introduction to Business Statistics 02 Descriptive Statistics: Summarizing Data 03 Data Presentation & Visualization 04 Sampling Techniques 05 Statistical Inference 06 Correlation and Regression
  • 4. Why Statistics Matter in Business 01 03 02 Key Statistical Concepts Descriptive statistics, sampling, statistical inference, correlation, and regression are fundamental for business operations and decision-making. Informed Decisions Statistics provides tools for data analysis and interpretation, leading to informed decisions; essential for navigating complex business environments. Unit Overview We will explore essential statistical methods, equipping businesses with the ability to apply them effectively.
  • 5. The Power of Data Analysis Data-Driven Insights Statistics enables businesses to extract meaningful insights from data; this helps to identify trends, patterns, and relationships. Improving Business Outcomes Analyzing data leads to optimized strategies, improved operations, and enhanced decision-making for better business outcomes. Staying Competitive In today's data-rich environment, statistical analysis is crucial for staying competitive and adapting to market changes.
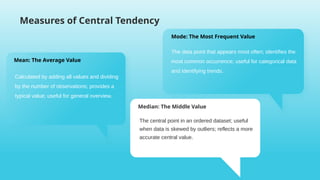
  • 7. Measures of Central Tendency Mode: The Most Frequent Value The data point that appears most often; identifies the most common occurrence; useful for categorical data and identifying trends. Mean: The Average Value Calculated by adding all values and dividing by the number of observations; provides a typical value; useful for general overview. Median: The Middle Value The central point in an ordered dataset; useful when data is skewed by outliers; reflects a more accurate central value.
  • 8. Measures of Dispersion The difference between the highest and lowest values; offers a simple view of data spread; sensitive to extreme values. Range: Quick Spread Assessment Average of squared differences from the mean; indicates data variability; more complex but comprehensive measure of spread. Variance: Measuring Data Deviation Square root of variance; expresses variability in original data units; easier to interpret in the context of the data. Standard Deviation: Interpretable Dispersion
  • 9. Presenting Data Visually Importance of Visualization Visual aids enhance understanding and make complex data more accessible and easier to interpret for decision-makers. Enhancing Data Clarity Well-designed visuals can reveal patterns and insights that might be missed in raw data; improving communication effectiveness. Accessibility and Engagement Visual presentations can engage a wider audience and simplify complex information, leading to better understanding and decision-making.
  • 10. Types of Data Quantitative Data: Measurable Metrics Numeric data that can be measured and quantified; includes sales figures, revenue, and employee performance metrics. Qualitative Data: Categorical Insights Non-numeric data categorized into groups; examples include customer preferences, product types, and geographical regions.
  • 12. 有赞云发展历程 Pie Charts: Proportions of a Whole Circular charts divided into slices; represents proportions of a whole; best for showing relative percentages of categories. Histograms: Distribution of Quantitative Data Displays data distribution across intervals or bins; helps identify skewness and outliers; essential for understanding data patterns. Bar Charts: Representing Categories Rectangular bars representing categorical data; bar length corresponds to the category's frequency or value for quick comparisons. Frequency Distributions: Tabular Representation Tabular data showing outcomes' frequency; visualized as histograms; provides a clear count of how often each value occurs. Cumulative Frequency Curves Curves showing accumulated frequencies as data increases; determines observations below a value; great for complex analysis. Graphical Methods
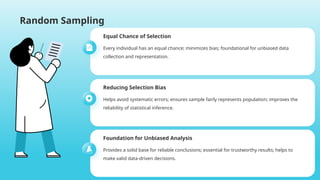
  • 14. Random Sampling Equal Chance of Selection Every individual has an equal chance; minimizes bias; foundational for unbiased data collection and representation. Reducing Selection Bias Helps avoid systematic errors; ensures sample fairly represents population; improves the reliability of statistical inference. Foundation for Unbiased Analysis Provides a solid base for reliable conclusions; essential for trustworthy results; helps to make valid data-driven decisions.
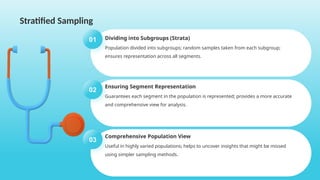
  • 15. Stratified Sampling 01 Dividing into Subgroups (Strata) Population divided into subgroups; random samples taken from each subgroup; ensures representation across all segments. 02 Ensuring Segment Representation Guarantees each segment in the population is represented; provides a more accurate and comprehensive view for analysis. 03 Comprehensive Population View Useful in highly varied populations; helps to uncover insights that might be missed using simpler sampling methods.
  • 16. Systematic Sampling Selecting Every Nth Item Selecting every nth item from a list after a random start; simple method; potential bias if there's order in the data. Simplicity and Efficiency Efficient sampling; quick to implement; suited to situations where a list is readily available and manageable. Potential for Bias If data has recurring patterns, sampling can lead to inaccurate results; critical to be aware of potential bias.
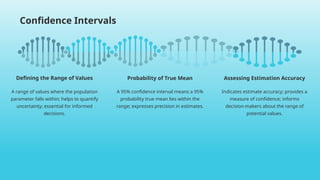
  • 18. Confidence Intervals A range of values where the population parameter falls within; helps to quantify uncertainty; essential for informed decisions. Defining the Range of Values A 95% confidence interval means a 95% probability true mean lies within the range; expresses precision in estimates. Probability of True Mean Indicates estimate accuracy; provides a measure of confidence; informs decision-makers about the range of potential values. Assessing Estimation Accuracy
  • 19. Hypothesis Testing Involves formulating null (no effect) and alternative (effect tested) hypotheses; guides statistical testing & interpretations. Null & Alternative Hypotheses Used to test assumptions about a population; a structured method to validate claims; provides data-driven validation. Testing Assumptions Used to determine whether evidence supports rejecting or accepting the null hypothesis; fundamental for informed decision-making. Data-Driven Decisions
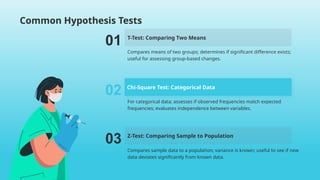
  • 20. Common Hypothesis Tests 01 T-Test: Comparing Two Means Compares means of two groups; determines if significant difference exists; useful for assessing group-based changes. 02 Chi-Square Test: Categorical Data For categorical data; assesses if observed frequencies match expected frequencies; evaluates independence between variables. 03 Z-Test: Comparing Sample to Population Compares sample data to a population; variance is known; useful to see if new data deviates significantly from known data.
  • 22. Correlation 03 02 01 1 Measuring Variable relationships Measures strength and direction between two variables; use to understand the nature of associations; essential for insight. 2 Pearson Correlation Coefficient Ranges from -1 to +1; quantifies relationship; 0 indicates no relationship; the most practical form measure for correlation. 3 Identifying Key Relationships Relationship understanding lets businesses pinpoint key factors; improve strategies; use information to enhance outcomes.
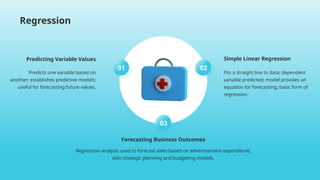
  • 23. Predicting Variable Values Predicts one variable based on another; establishes predictive models; useful for forecasting future values. Forecasting Business Outcomes Regression analysis used to forecast sales based on advertisement expenditure; aids strategic planning and budgeting models. Fits a straight line to data; dependent variable predicted; model provides an equation for forecasting; basic form of regression. Simple Linear Regression Regression 02 03 01
  • 24. 07 Case Studies and Applications
  • 25. Real-World Examples 01 Applying Statistical Methods Showcasing business statistic applications; demonstrates practical relevance; increases understanding of methods' potential. 03 Data-Driven Success Stories Presents successes from data-backed strategies; reinforces data role; promotes adoption of statistics to gain business results. 02 Solving Business Problems Discuss how statistical techniques resolve issues; highlight real-world impact; emphasizes usefulness for decision-making.
  • 26. Optimizing Business Strategies Aligning Strategy with Insights Discuss aligning strategies with data-driven insights; showcases transformation; strengthens data's influence on corporate strategy. 01 Case Demonstrations Case studies on how companies leverage statistics; emphasize application; helps to translate data driven strategies for real-world uses. 02 Making Data-Based Decisions Discuss using analytics to make decisions; showcase effectiveness; ensures insights are both accurate and useful. 03
  • 28. Strategic Use of Statistics 03 02 01 1 Recap and Summary Restate business statistics importance; highlight analysis and decisions; underscore role to success. 2 Embracing Data-Driven Culture Encourage data as an integral aspect; foster insights-led culture; promotes statistics for all decision purposes. 3 Future Business Statistics Data growth trends; discuss advanced analytics; underline data importance for future tasks and future operations.