SlideShare a Scribd company logo
Unit I
Review of Basic Statistics &
Introduction to Scientific Method
Statistical Terms
Statistics
The word statistics is derived from the
Latin word status meaning “state”. The
word statistics has two basic meanings:
• we use this word when referring to
actual numbers derived from data
• We use statistics as a method of
analysis
• Statistics - a collection of quantitative
data such as statistics of crimes,
statistics on enrolment, statistics on
unemployment, etc.
• Statistics - a science which deals with the
collection, presentation, analysis and
interpretation of quantitave
data/information.
Uses of Statistics
Statistics involves much more than the
simple collection, tabulation and
summarizing of data. It is also a tool that
helps us develop meaningful conclusions
that go beyond the original data.
Uses of Statistics – some examples
• Forecasting
weather - analyzing weather data
election outcomes – survey
condition of the economy in the next
period – observation on the various
indices of economy
• Predicting product preferences (consumers
are taken as samples to provide information)
• Reporting enrolment, fish/crop production
among others
Uses of Statistics – some examples ... Cont’d
• Product quality - sampling
• Interpret research results
• Evaluate statistics used everyday
• Presentation of data to audiences
• Formulate and test hypothesis
• Evaluation of technologies (e.g.
fishing gears, varieties, anti-pollution
controls, teaching techniques)
• Analysis of students’ performance
and behaviors
Uses of Statistics… summary
• Provides tools that you need in order to
react intelligently to information you
hear or read.
• Thus, statistics is one of the most
important subject matter that you ever
study.
Basic Statistical Terms . . . Cont’d
1. Population
Types:
• Finite population – can be counted with
relative ease and the number obtained is
finite.
• Infinite population – can not be counted
easily because of the large number involved.
Basic Statistical Terms . . . Cont’d
2. Sample
Is it always possible to gather data from
the entire population?
Actually it is not always possible and it is
even impractical to gather data from a
large population. Researchers resort to
studying a part of a population called
sample.
Basic Statistical Terms . . . Cont’d
2. Sample ... Cont’d
Sample – part/representative of the
population or a sub-collection of
elements drawn from a population.
To make it representative of a population,
samples are usually drawn using the
process of randomization, i.e., all the
members are given an equal chance of
being drawn as a sample.
Basic Statistical Terms . . . Cont’d
3. Parameter and Statistic
Parameter – a numerical measurement
describing some characteristic of a
population (data obtained from a
population). Designated by:
µ (mu) – population mean
σ (sigma) – standard deviation
Basic Statistical Terms . . . Cont’d
3. Parameter and Statistic
Statistic – a numerical measurement
describing some characteristic of a
sample . Designated by:
– sample mean
SD– standard deviation
Basic Statistical Terms . . . Cont’d
4. Variable
Variable – a characteristic of interest
measurable on each and every individual
in the universe denoted by any capital
letter in the English alphabet.
Types: Qualitative and Quantitative
Basic Statistical Terms . . . Cont’d
4. Variable ... Cont’d
Qualitative variable – consists of
categories or attributes, which have non-
numerical characteristics
Examples: classification, year level, sex,
subjects enrolled, emotional condition
(happy or sad), position towards the
instructor (like or dislike), gender (male
or female)
Basic Statistical Terms . . . Cont’d
4. Variable ... Cont’d
Quantitative variable – consists of
numbers representing counts or
measurements (e.g. age, height, weight,
scores, number of books, family size)
Types:
•Discrete
•Continuous
Basic Statistical Terms . . . Cont’d
4. Variable ... Cont’d
Discrete quantitative variable – data
obtained through counting; can not be
subdivided. These are expressed as
whole number and are always exact.
Basic Statistical Terms . . . Cont’d
4. Variable ... Cont’d
Examples: number of students,
number of books, number of patients,
number of children in a party, number
of equipment, number of trainings
attended
Measures of Central Tendency
• Mean (arithmetic) – the sum of the
individual observed value divided by
the total number of observations.
 point within the range about which the
rest of the data is considered balanced
(balance point or fulcrum in a
distribution of observations) – affected
by the value of each observation
Example: What is the mean age of 5 students?
Given: 16, 19.5, 18, 17, 18.5
Sol’n: Mean = 16 + 19.5 + 18 + 17 + 18.5
5
= 89 = 17.8 years
5
• Median – is the midpoint of the
distribution.
Example: Find the median of the following
observations?
Given:8, 4, 1, 3, 5 and 7
To find the median, first array the set of
observations - 1, 3, 4, 7, 8
The median is the middlemost item: Me = 4
• Mode – the value that appears with the
highest (greatest) frequency. That is, the
value that appears most often
Example: Find the mode of the following
distributions?
Given: 5, 8, 10, 5, 3, 5, 2, 5, 7
To find the mode, first array the distribution: 2,
3, 5, 5, 5, 5, 7, 8, 10
The mode is 5
Which average should you use?
With a bit experience, you can readily determine
which measure of central tendency is appropriate
to a given situation
• Arithmetic mean or simply mean is the most
commonly used method – it considers, for
example, the average amount of product
consumed by a user, it is indispensable in business
and commerce.
• Knowing the mean of a distribution also permits
one to compare different frequency distributions
Which average should you use? … cont’d
Median – If you want to know a typical
observation in a distribution, particularly if it is
skewed, the median proves to be a better
measure than the mean.
• Income is the most common example of a
distribution that is typically skewed.
• For income, arithmetic mean is nearly always
inflated.
• Thus median is a good choice because it is not
affected by extreme values.
Which average should you use?... cont’d
• Example 1 – annual salary of employees: 30,000;
45,000; 45,000; and 200,000.
 Median - 45,000
Mode - 45,000
Mean - 73,000 (does not match any of the
salaries)
• Example 2 – Suppose a stock clerk who handles
different sizes of crutches wants to know which is
the most popular size (mode) so that he can order
enough to meet the demand
Which average should you use? … cont’d
General rule:
Mode – nominal scores (numbers which do
not represent an amount or quantity; names
or identifiers of a category or attribute) e.g. zip
code, size of shoes, license number
Median – ordinal scores, are numbers which
represent an ordered series of relationships
e.g. 1st, 2nd, 3rd, etc. Indicates position in an
ordered series by does not say anything about
the magnitude of difference between any two
consecutive entries
Which average should you use?
General rule:
Mean – interval scale and ratio scale
Interval scale has equal units but an arbitrary
zero point, may be added or subtracted but
may not be multiplied or divided, e.g.,
temperature.
Ratio scale, e.g., height or weight, can be
compared meaningfully with one another (e.g.
50 kg is twice 25 kg)
Measures of Variation
• Knowing a distribution’s central tendency is
helpful, but it is not enough.
• Also important to know whether the
observations tend to be very similar
(homogeneous) or they vary considerably
(heterogeneous).
• Common measures of variation – range, mean
deviation, standard deviation and coefficient of
variation
Measures of Variation … cont’d
• Range = Xmax – Xmin (difference between the
highest and lowest value or observation
• Can be computed quickly but is not very useful
because it considers only the extremes and
does not take into consideration the bulk of the
observation
Measures of Variation . . . Cont’d
• Mean Deviation – a bit more sophisticated than
the range
• Defined as the average deviation of all
observations from the mean
Measures of Variation… cont’d
• Standard deviation – represented by the
symbol s. It is the square root of the variance of
the observations
• Variance is computed by squaring each
deviation from the mean, adding them up and
dividing their sum by n-1, where n is the
sample size
Measures of Variation … cont’d
• Coefficient of variation – one application of the
mean and the standard deviation
• Defined as the ratio of the standard deviation
to the absolute of the mean expressed as a
percentage
• Depicts the size of the standard deviation
relative to its mean.
• Both standard deviation and the mean
represent the same units hence CV is free of
the measurement units of the original data.
Therefore, it is possible to compare the relative
variation of even unrelated quantities.
Concluding Statements
• In describing data by using summary measure,
it is important to select the measure of central
tendency that most accurately represents the
data
• A better way of summarizing data is to use two
summary measures – one to indicate the
central tendency and one to indicate the
variation
• The most commonly used pair is arithmetic
mean and the standard deviation
Ad

More Related Content

What's hot (20)

Inferential statistics
Inferential statisticsInferential statistics
Inferential statistics
Dalia El-Shafei
 
Confidence Interval Estimation
Confidence Interval EstimationConfidence Interval Estimation
Confidence Interval Estimation
Yesica Adicondro
 
Descriptive statistics
Descriptive statisticsDescriptive statistics
Descriptive statistics
Hiba Armouche
 
6. point and interval estimation
6. point and interval estimation6. point and interval estimation
6. point and interval estimation
ONE Virtual Services
 
Estimation in statistics
Estimation in statisticsEstimation in statistics
Estimation in statistics
Rabea Jamal
 
Basic Concepts of Statistics - Lecture Notes
Basic Concepts of Statistics - Lecture NotesBasic Concepts of Statistics - Lecture Notes
Basic Concepts of Statistics - Lecture Notes
Dr. Nirav Vyas
 
Descriptive statistics
Descriptive statisticsDescriptive statistics
Descriptive statistics
Abdelrahman Alkilani
 
Hypothesis tests for one population mean.pdf
Hypothesis tests for one population mean.pdfHypothesis tests for one population mean.pdf
Hypothesis tests for one population mean.pdf
RAHULSUTHAR46
 
Introduction To Statistics
Introduction To StatisticsIntroduction To Statistics
Introduction To Statistics
albertlaporte
 
Sampling and sampling distribution tttt
Sampling and sampling distribution ttttSampling and sampling distribution tttt
Sampling and sampling distribution tttt
pardeepkaur60
 
Moses test (1)
Moses test (1)Moses test (1)
Moses test (1)
University of Sargodha
 
Chisquare
ChisquareChisquare
Chisquare
keerthi samuel
 
Introduction to Statistics (Part -I)
Introduction to Statistics (Part -I)Introduction to Statistics (Part -I)
Introduction to Statistics (Part -I)
YesAnalytics
 
Descriptive statistics and graphs
Descriptive statistics and graphsDescriptive statistics and graphs
Descriptive statistics and graphs
Avjinder (Avi) Kaler
 
T test, independant sample, paired sample and anova
T test, independant sample, paired sample and anovaT test, independant sample, paired sample and anova
T test, independant sample, paired sample and anova
Qasim Raza
 
Confidence Intervals
Confidence IntervalsConfidence Intervals
Confidence Intervals
mandalina landy
 
Two Means, Independent Samples
Two Means, Independent SamplesTwo Means, Independent Samples
Two Means, Independent Samples
Long Beach City College
 
Simple Linear Regression: Step-By-Step
Simple Linear Regression: Step-By-StepSimple Linear Regression: Step-By-Step
Simple Linear Regression: Step-By-Step
Dan Wellisch
 
Binomial distribution
Binomial distributionBinomial distribution
Binomial distribution
yatin bhardwaj
 
Confidence intervals
Confidence intervalsConfidence intervals
Confidence intervals
Tanay Tandon
 
Confidence Interval Estimation
Confidence Interval EstimationConfidence Interval Estimation
Confidence Interval Estimation
Yesica Adicondro
 
Descriptive statistics
Descriptive statisticsDescriptive statistics
Descriptive statistics
Hiba Armouche
 
Estimation in statistics
Estimation in statisticsEstimation in statistics
Estimation in statistics
Rabea Jamal
 
Basic Concepts of Statistics - Lecture Notes
Basic Concepts of Statistics - Lecture NotesBasic Concepts of Statistics - Lecture Notes
Basic Concepts of Statistics - Lecture Notes
Dr. Nirav Vyas
 
Hypothesis tests for one population mean.pdf
Hypothesis tests for one population mean.pdfHypothesis tests for one population mean.pdf
Hypothesis tests for one population mean.pdf
RAHULSUTHAR46
 
Introduction To Statistics
Introduction To StatisticsIntroduction To Statistics
Introduction To Statistics
albertlaporte
 
Sampling and sampling distribution tttt
Sampling and sampling distribution ttttSampling and sampling distribution tttt
Sampling and sampling distribution tttt
pardeepkaur60
 
Introduction to Statistics (Part -I)
Introduction to Statistics (Part -I)Introduction to Statistics (Part -I)
Introduction to Statistics (Part -I)
YesAnalytics
 
T test, independant sample, paired sample and anova
T test, independant sample, paired sample and anovaT test, independant sample, paired sample and anova
T test, independant sample, paired sample and anova
Qasim Raza
 
Simple Linear Regression: Step-By-Step
Simple Linear Regression: Step-By-StepSimple Linear Regression: Step-By-Step
Simple Linear Regression: Step-By-Step
Dan Wellisch
 
Confidence intervals
Confidence intervalsConfidence intervals
Confidence intervals
Tanay Tandon
 

Similar to Topic-1-Review-of-Basic-Statistics.pptx (20)

Topic-1-Review-of-Basic-Statistics.pptx
Topic-1-Review-of-Basic-Statistics.pptxTopic-1-Review-of-Basic-Statistics.pptx
Topic-1-Review-of-Basic-Statistics.pptx
PreciousAntonetteOrp
 
RM chapter-4 (3).ppt measurements and descriptive
RM chapter-4 (3).ppt measurements and descriptiveRM chapter-4 (3).ppt measurements and descriptive
RM chapter-4 (3).ppt measurements and descriptive
jamsibro140
 
STATISTICS.pptx
STATISTICS.pptxSTATISTICS.pptx
STATISTICS.pptx
theadarshagarwal
 
Machine learning pre requisite
Machine learning pre requisiteMachine learning pre requisite
Machine learning pre requisite
Ram Singh
 
Topic 2 Measures of Central Tendency.pptx
Topic 2   Measures of Central Tendency.pptxTopic 2   Measures of Central Tendency.pptx
Topic 2 Measures of Central Tendency.pptx
CallplanetsDeveloper
 
presentaion ni owel iwiw.pptx
presentaion ni owel iwiw.pptxpresentaion ni owel iwiw.pptx
presentaion ni owel iwiw.pptx
JocundBrewDelaCernaA
 
STATISTICAL PROCEDURES (Discriptive Statistics).pptx
STATISTICAL PROCEDURES (Discriptive Statistics).pptxSTATISTICAL PROCEDURES (Discriptive Statistics).pptx
STATISTICAL PROCEDURES (Discriptive Statistics).pptx
MuhammadNafees42
 
Chapter-one.pptx
Chapter-one.pptxChapter-one.pptx
Chapter-one.pptx
AbebeNega
 
presentaion-ni-owel.pptx
presentaion-ni-owel.pptxpresentaion-ni-owel.pptx
presentaion-ni-owel.pptx
JareezRobios
 
Statistics for Data Analytics
Statistics for Data AnalyticsStatistics for Data Analytics
Statistics for Data Analytics
SSaudia
 
Introduction to statistics.pptx
Introduction to statistics.pptxIntroduction to statistics.pptx
Introduction to statistics.pptx
Unfold1
 
01 Introduction (1).pptx
01 Introduction (1).pptx01 Introduction (1).pptx
01 Introduction (1).pptx
BAVAHRNIAPSUBRAMANIA
 
IDS-Unit-II. bachelor of computer applicatio notes
IDS-Unit-II. bachelor of computer applicatio notesIDS-Unit-II. bachelor of computer applicatio notes
IDS-Unit-II. bachelor of computer applicatio notes
AnkurTiwari813070
 
CHAPONE edited Stat.pptx
CHAPONE edited Stat.pptxCHAPONE edited Stat.pptx
CHAPONE edited Stat.pptx
BereketDesalegn5
 
A basic Introduction To Statistics with examples
A basic Introduction To Statistics with examplesA basic Introduction To Statistics with examples
A basic Introduction To Statistics with examples
ShibsekharRoy1
 
Understanding statistics in research
Understanding statistics in researchUnderstanding statistics in research
Understanding statistics in research
Dr. Senthilvel Vasudevan
 
BUSINESS STATISTICS AND PROBABILITY Chapter 1 By Arbaminich University
BUSINESS STATISTICS AND PROBABILITY Chapter 1 By Arbaminich UniversityBUSINESS STATISTICS AND PROBABILITY Chapter 1 By Arbaminich University
BUSINESS STATISTICS AND PROBABILITY Chapter 1 By Arbaminich University
kedirh150
 
MMW (Data Management)-Part 1 for ULO 2 (1).pptx
MMW (Data Management)-Part 1 for ULO 2 (1).pptxMMW (Data Management)-Part 1 for ULO 2 (1).pptx
MMW (Data Management)-Part 1 for ULO 2 (1).pptx
PETTIROSETALISIC
 
Section 6 - Chapter 1 - Introduction to Statistics Part I
Section 6 - Chapter 1 - Introduction to Statistics Part ISection 6 - Chapter 1 - Introduction to Statistics Part I
Section 6 - Chapter 1 - Introduction to Statistics Part I
Professional Training Academy
 
3. Statistical Analysis.pptx
3. Statistical Analysis.pptx3. Statistical Analysis.pptx
3. Statistical Analysis.pptx
jeyanthisivakumar
 
Topic-1-Review-of-Basic-Statistics.pptx
Topic-1-Review-of-Basic-Statistics.pptxTopic-1-Review-of-Basic-Statistics.pptx
Topic-1-Review-of-Basic-Statistics.pptx
PreciousAntonetteOrp
 
RM chapter-4 (3).ppt measurements and descriptive
RM chapter-4 (3).ppt measurements and descriptiveRM chapter-4 (3).ppt measurements and descriptive
RM chapter-4 (3).ppt measurements and descriptive
jamsibro140
 
Machine learning pre requisite
Machine learning pre requisiteMachine learning pre requisite
Machine learning pre requisite
Ram Singh
 
Topic 2 Measures of Central Tendency.pptx
Topic 2   Measures of Central Tendency.pptxTopic 2   Measures of Central Tendency.pptx
Topic 2 Measures of Central Tendency.pptx
CallplanetsDeveloper
 
STATISTICAL PROCEDURES (Discriptive Statistics).pptx
STATISTICAL PROCEDURES (Discriptive Statistics).pptxSTATISTICAL PROCEDURES (Discriptive Statistics).pptx
STATISTICAL PROCEDURES (Discriptive Statistics).pptx
MuhammadNafees42
 
Chapter-one.pptx
Chapter-one.pptxChapter-one.pptx
Chapter-one.pptx
AbebeNega
 
presentaion-ni-owel.pptx
presentaion-ni-owel.pptxpresentaion-ni-owel.pptx
presentaion-ni-owel.pptx
JareezRobios
 
Statistics for Data Analytics
Statistics for Data AnalyticsStatistics for Data Analytics
Statistics for Data Analytics
SSaudia
 
Introduction to statistics.pptx
Introduction to statistics.pptxIntroduction to statistics.pptx
Introduction to statistics.pptx
Unfold1
 
IDS-Unit-II. bachelor of computer applicatio notes
IDS-Unit-II. bachelor of computer applicatio notesIDS-Unit-II. bachelor of computer applicatio notes
IDS-Unit-II. bachelor of computer applicatio notes
AnkurTiwari813070
 
A basic Introduction To Statistics with examples
A basic Introduction To Statistics with examplesA basic Introduction To Statistics with examples
A basic Introduction To Statistics with examples
ShibsekharRoy1
 
BUSINESS STATISTICS AND PROBABILITY Chapter 1 By Arbaminich University
BUSINESS STATISTICS AND PROBABILITY Chapter 1 By Arbaminich UniversityBUSINESS STATISTICS AND PROBABILITY Chapter 1 By Arbaminich University
BUSINESS STATISTICS AND PROBABILITY Chapter 1 By Arbaminich University
kedirh150
 
MMW (Data Management)-Part 1 for ULO 2 (1).pptx
MMW (Data Management)-Part 1 for ULO 2 (1).pptxMMW (Data Management)-Part 1 for ULO 2 (1).pptx
MMW (Data Management)-Part 1 for ULO 2 (1).pptx
PETTIROSETALISIC
 
Section 6 - Chapter 1 - Introduction to Statistics Part I
Section 6 - Chapter 1 - Introduction to Statistics Part ISection 6 - Chapter 1 - Introduction to Statistics Part I
Section 6 - Chapter 1 - Introduction to Statistics Part I
Professional Training Academy
 
3. Statistical Analysis.pptx
3. Statistical Analysis.pptx3. Statistical Analysis.pptx
3. Statistical Analysis.pptx
jeyanthisivakumar
 
Ad

Recently uploaded (20)

Myopathies (muscle disorders) for undergraduate
Myopathies (muscle disorders) for undergraduateMyopathies (muscle disorders) for undergraduate
Myopathies (muscle disorders) for undergraduate
Mohamed Rizk Khodair
 
Grade 2 - Mathematics - Printable Worksheet
Grade 2 - Mathematics - Printable WorksheetGrade 2 - Mathematics - Printable Worksheet
Grade 2 - Mathematics - Printable Worksheet
Sritoma Majumder
 
YSPH VMOC Special Report - Measles Outbreak Southwest US 5-3-2025.pptx
YSPH VMOC Special Report - Measles Outbreak  Southwest US 5-3-2025.pptxYSPH VMOC Special Report - Measles Outbreak  Southwest US 5-3-2025.pptx
YSPH VMOC Special Report - Measles Outbreak Southwest US 5-3-2025.pptx
Yale School of Public Health - The Virtual Medical Operations Center (VMOC)
 
All About the 990 Unlocking Its Mysteries and Its Power.pdf
All About the 990 Unlocking Its Mysteries and Its Power.pdfAll About the 990 Unlocking Its Mysteries and Its Power.pdf
All About the 990 Unlocking Its Mysteries and Its Power.pdf
TechSoup
 
Rococo versus Neoclassicism. The artistic styles of the 18th century
Rococo versus Neoclassicism. The artistic styles of the 18th centuryRococo versus Neoclassicism. The artistic styles of the 18th century
Rococo versus Neoclassicism. The artistic styles of the 18th century
Gema
 
Redesigning Education as a Cognitive Ecosystem: Practical Insights into Emerg...
Redesigning Education as a Cognitive Ecosystem: Practical Insights into Emerg...Redesigning Education as a Cognitive Ecosystem: Practical Insights into Emerg...
Redesigning Education as a Cognitive Ecosystem: Practical Insights into Emerg...
Leonel Morgado
 
How to Create A Todo List In Todo of Odoo 18
How to Create A Todo List In Todo of Odoo 18How to Create A Todo List In Todo of Odoo 18
How to Create A Todo List In Todo of Odoo 18
Celine George
 
Drive Supporter Growth from Awareness to Advocacy with TechSoup Marketing Ser...
Drive Supporter Growth from Awareness to Advocacy with TechSoup Marketing Ser...Drive Supporter Growth from Awareness to Advocacy with TechSoup Marketing Ser...
Drive Supporter Growth from Awareness to Advocacy with TechSoup Marketing Ser...
TechSoup
 
What is the Philosophy of Statistics? (and how I was drawn to it)
What is the Philosophy of Statistics? (and how I was drawn to it)What is the Philosophy of Statistics? (and how I was drawn to it)
What is the Philosophy of Statistics? (and how I was drawn to it)
jemille6
 
dynastic art of the Pallava dynasty south India
dynastic art of the Pallava dynasty south Indiadynastic art of the Pallava dynasty south India
dynastic art of the Pallava dynasty south India
PrachiSontakke5
 
APGAR SCORE BY sweety Tamanna Mahapatra MSc Pediatric
APGAR SCORE  BY sweety Tamanna Mahapatra MSc PediatricAPGAR SCORE  BY sweety Tamanna Mahapatra MSc Pediatric
APGAR SCORE BY sweety Tamanna Mahapatra MSc Pediatric
SweetytamannaMohapat
 
LDMMIA Reiki Yoga S5 Daily Living Workshop
LDMMIA Reiki Yoga S5 Daily Living WorkshopLDMMIA Reiki Yoga S5 Daily Living Workshop
LDMMIA Reiki Yoga S5 Daily Living Workshop
LDM Mia eStudios
 
Biophysics Chapter 3 Methods of Studying Macromolecules.pdf
Biophysics Chapter 3 Methods of Studying Macromolecules.pdfBiophysics Chapter 3 Methods of Studying Macromolecules.pdf
Biophysics Chapter 3 Methods of Studying Macromolecules.pdf
PKLI-Institute of Nursing and Allied Health Sciences Lahore , Pakistan.
 
Exercise Physiology MCQS By DR. NASIR MUSTAFA
Exercise Physiology MCQS By DR. NASIR MUSTAFAExercise Physiology MCQS By DR. NASIR MUSTAFA
Exercise Physiology MCQS By DR. NASIR MUSTAFA
Dr. Nasir Mustafa
 
CNS infections (encephalitis, meningitis & Brain abscess
CNS infections (encephalitis, meningitis & Brain abscessCNS infections (encephalitis, meningitis & Brain abscess
CNS infections (encephalitis, meningitis & Brain abscess
Mohamed Rizk Khodair
 
How to Manage Upselling in Odoo 18 Sales
How to Manage Upselling in Odoo 18 SalesHow to Manage Upselling in Odoo 18 Sales
How to Manage Upselling in Odoo 18 Sales
Celine George
 
Ajanta Paintings: Study as a Source of History
Ajanta Paintings: Study as a Source of HistoryAjanta Paintings: Study as a Source of History
Ajanta Paintings: Study as a Source of History
Virag Sontakke
 
How to Configure Public Holidays & Mandatory Days in Odoo 18
How to Configure Public Holidays & Mandatory Days in Odoo 18How to Configure Public Holidays & Mandatory Days in Odoo 18
How to Configure Public Holidays & Mandatory Days in Odoo 18
Celine George
 
Cultivation Practice of Onion in Nepal.pptx
Cultivation Practice of Onion in Nepal.pptxCultivation Practice of Onion in Nepal.pptx
Cultivation Practice of Onion in Nepal.pptx
UmeshTimilsina1
 
Cultivation Practice of Garlic in Nepal.pptx
Cultivation Practice of Garlic in Nepal.pptxCultivation Practice of Garlic in Nepal.pptx
Cultivation Practice of Garlic in Nepal.pptx
UmeshTimilsina1
 
Myopathies (muscle disorders) for undergraduate
Myopathies (muscle disorders) for undergraduateMyopathies (muscle disorders) for undergraduate
Myopathies (muscle disorders) for undergraduate
Mohamed Rizk Khodair
 
Grade 2 - Mathematics - Printable Worksheet
Grade 2 - Mathematics - Printable WorksheetGrade 2 - Mathematics - Printable Worksheet
Grade 2 - Mathematics - Printable Worksheet
Sritoma Majumder
 
All About the 990 Unlocking Its Mysteries and Its Power.pdf
All About the 990 Unlocking Its Mysteries and Its Power.pdfAll About the 990 Unlocking Its Mysteries and Its Power.pdf
All About the 990 Unlocking Its Mysteries and Its Power.pdf
TechSoup
 
Rococo versus Neoclassicism. The artistic styles of the 18th century
Rococo versus Neoclassicism. The artistic styles of the 18th centuryRococo versus Neoclassicism. The artistic styles of the 18th century
Rococo versus Neoclassicism. The artistic styles of the 18th century
Gema
 
Redesigning Education as a Cognitive Ecosystem: Practical Insights into Emerg...
Redesigning Education as a Cognitive Ecosystem: Practical Insights into Emerg...Redesigning Education as a Cognitive Ecosystem: Practical Insights into Emerg...
Redesigning Education as a Cognitive Ecosystem: Practical Insights into Emerg...
Leonel Morgado
 
How to Create A Todo List In Todo of Odoo 18
How to Create A Todo List In Todo of Odoo 18How to Create A Todo List In Todo of Odoo 18
How to Create A Todo List In Todo of Odoo 18
Celine George
 
Drive Supporter Growth from Awareness to Advocacy with TechSoup Marketing Ser...
Drive Supporter Growth from Awareness to Advocacy with TechSoup Marketing Ser...Drive Supporter Growth from Awareness to Advocacy with TechSoup Marketing Ser...
Drive Supporter Growth from Awareness to Advocacy with TechSoup Marketing Ser...
TechSoup
 
What is the Philosophy of Statistics? (and how I was drawn to it)
What is the Philosophy of Statistics? (and how I was drawn to it)What is the Philosophy of Statistics? (and how I was drawn to it)
What is the Philosophy of Statistics? (and how I was drawn to it)
jemille6
 
dynastic art of the Pallava dynasty south India
dynastic art of the Pallava dynasty south Indiadynastic art of the Pallava dynasty south India
dynastic art of the Pallava dynasty south India
PrachiSontakke5
 
APGAR SCORE BY sweety Tamanna Mahapatra MSc Pediatric
APGAR SCORE  BY sweety Tamanna Mahapatra MSc PediatricAPGAR SCORE  BY sweety Tamanna Mahapatra MSc Pediatric
APGAR SCORE BY sweety Tamanna Mahapatra MSc Pediatric
SweetytamannaMohapat
 
LDMMIA Reiki Yoga S5 Daily Living Workshop
LDMMIA Reiki Yoga S5 Daily Living WorkshopLDMMIA Reiki Yoga S5 Daily Living Workshop
LDMMIA Reiki Yoga S5 Daily Living Workshop
LDM Mia eStudios
 
Exercise Physiology MCQS By DR. NASIR MUSTAFA
Exercise Physiology MCQS By DR. NASIR MUSTAFAExercise Physiology MCQS By DR. NASIR MUSTAFA
Exercise Physiology MCQS By DR. NASIR MUSTAFA
Dr. Nasir Mustafa
 
CNS infections (encephalitis, meningitis & Brain abscess
CNS infections (encephalitis, meningitis & Brain abscessCNS infections (encephalitis, meningitis & Brain abscess
CNS infections (encephalitis, meningitis & Brain abscess
Mohamed Rizk Khodair
 
How to Manage Upselling in Odoo 18 Sales
How to Manage Upselling in Odoo 18 SalesHow to Manage Upselling in Odoo 18 Sales
How to Manage Upselling in Odoo 18 Sales
Celine George
 
Ajanta Paintings: Study as a Source of History
Ajanta Paintings: Study as a Source of HistoryAjanta Paintings: Study as a Source of History
Ajanta Paintings: Study as a Source of History
Virag Sontakke
 
How to Configure Public Holidays & Mandatory Days in Odoo 18
How to Configure Public Holidays & Mandatory Days in Odoo 18How to Configure Public Holidays & Mandatory Days in Odoo 18
How to Configure Public Holidays & Mandatory Days in Odoo 18
Celine George
 
Cultivation Practice of Onion in Nepal.pptx
Cultivation Practice of Onion in Nepal.pptxCultivation Practice of Onion in Nepal.pptx
Cultivation Practice of Onion in Nepal.pptx
UmeshTimilsina1
 
Cultivation Practice of Garlic in Nepal.pptx
Cultivation Practice of Garlic in Nepal.pptxCultivation Practice of Garlic in Nepal.pptx
Cultivation Practice of Garlic in Nepal.pptx
UmeshTimilsina1
 
Ad

Topic-1-Review-of-Basic-Statistics.pptx

  • 1. Unit I Review of Basic Statistics & Introduction to Scientific Method
  • 2. Statistical Terms Statistics The word statistics is derived from the Latin word status meaning “state”. The word statistics has two basic meanings: • we use this word when referring to actual numbers derived from data • We use statistics as a method of analysis
  • 3. • Statistics - a collection of quantitative data such as statistics of crimes, statistics on enrolment, statistics on unemployment, etc. • Statistics - a science which deals with the collection, presentation, analysis and interpretation of quantitave data/information.
  • 4. Uses of Statistics Statistics involves much more than the simple collection, tabulation and summarizing of data. It is also a tool that helps us develop meaningful conclusions that go beyond the original data.
  • 5. Uses of Statistics – some examples • Forecasting weather - analyzing weather data election outcomes – survey condition of the economy in the next period – observation on the various indices of economy • Predicting product preferences (consumers are taken as samples to provide information) • Reporting enrolment, fish/crop production among others
  • 6. Uses of Statistics – some examples ... Cont’d • Product quality - sampling • Interpret research results • Evaluate statistics used everyday • Presentation of data to audiences • Formulate and test hypothesis • Evaluation of technologies (e.g. fishing gears, varieties, anti-pollution controls, teaching techniques) • Analysis of students’ performance and behaviors
  • 7. Uses of Statistics… summary • Provides tools that you need in order to react intelligently to information you hear or read. • Thus, statistics is one of the most important subject matter that you ever study.
  • 8. Basic Statistical Terms . . . Cont’d 1. Population Types: • Finite population – can be counted with relative ease and the number obtained is finite. • Infinite population – can not be counted easily because of the large number involved.
  • 9. Basic Statistical Terms . . . Cont’d 2. Sample Is it always possible to gather data from the entire population? Actually it is not always possible and it is even impractical to gather data from a large population. Researchers resort to studying a part of a population called sample.
  • 10. Basic Statistical Terms . . . Cont’d 2. Sample ... Cont’d Sample – part/representative of the population or a sub-collection of elements drawn from a population. To make it representative of a population, samples are usually drawn using the process of randomization, i.e., all the members are given an equal chance of being drawn as a sample.
  • 11. Basic Statistical Terms . . . Cont’d 3. Parameter and Statistic Parameter – a numerical measurement describing some characteristic of a population (data obtained from a population). Designated by: µ (mu) – population mean σ (sigma) – standard deviation
  • 12. Basic Statistical Terms . . . Cont’d 3. Parameter and Statistic Statistic – a numerical measurement describing some characteristic of a sample . Designated by: – sample mean SD– standard deviation
  • 13. Basic Statistical Terms . . . Cont’d 4. Variable Variable – a characteristic of interest measurable on each and every individual in the universe denoted by any capital letter in the English alphabet. Types: Qualitative and Quantitative
  • 14. Basic Statistical Terms . . . Cont’d 4. Variable ... Cont’d Qualitative variable – consists of categories or attributes, which have non- numerical characteristics Examples: classification, year level, sex, subjects enrolled, emotional condition (happy or sad), position towards the instructor (like or dislike), gender (male or female)
  • 15. Basic Statistical Terms . . . Cont’d 4. Variable ... Cont’d Quantitative variable – consists of numbers representing counts or measurements (e.g. age, height, weight, scores, number of books, family size) Types: •Discrete •Continuous
  • 16. Basic Statistical Terms . . . Cont’d 4. Variable ... Cont’d Discrete quantitative variable – data obtained through counting; can not be subdivided. These are expressed as whole number and are always exact.
  • 17. Basic Statistical Terms . . . Cont’d 4. Variable ... Cont’d Examples: number of students, number of books, number of patients, number of children in a party, number of equipment, number of trainings attended
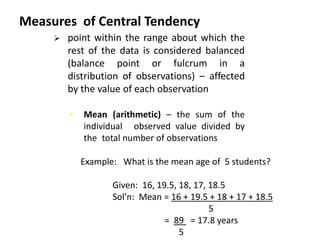
  • 18. Measures of Central Tendency • Mean (arithmetic) – the sum of the individual observed value divided by the total number of observations.  point within the range about which the rest of the data is considered balanced (balance point or fulcrum in a distribution of observations) – affected by the value of each observation Example: What is the mean age of 5 students? Given: 16, 19.5, 18, 17, 18.5 Sol’n: Mean = 16 + 19.5 + 18 + 17 + 18.5 5 = 89 = 17.8 years 5
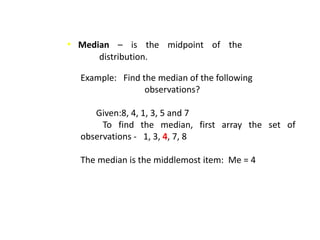
  • 19. • Median – is the midpoint of the distribution. Example: Find the median of the following observations? Given:8, 4, 1, 3, 5 and 7 To find the median, first array the set of observations - 1, 3, 4, 7, 8 The median is the middlemost item: Me = 4
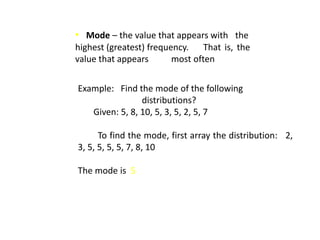
  • 20. • Mode – the value that appears with the highest (greatest) frequency. That is, the value that appears most often Example: Find the mode of the following distributions? Given: 5, 8, 10, 5, 3, 5, 2, 5, 7 To find the mode, first array the distribution: 2, 3, 5, 5, 5, 5, 7, 8, 10 The mode is 5
  • 21. Which average should you use? With a bit experience, you can readily determine which measure of central tendency is appropriate to a given situation • Arithmetic mean or simply mean is the most commonly used method – it considers, for example, the average amount of product consumed by a user, it is indispensable in business and commerce. • Knowing the mean of a distribution also permits one to compare different frequency distributions
  • 22. Which average should you use? … cont’d Median – If you want to know a typical observation in a distribution, particularly if it is skewed, the median proves to be a better measure than the mean. • Income is the most common example of a distribution that is typically skewed. • For income, arithmetic mean is nearly always inflated. • Thus median is a good choice because it is not affected by extreme values.
  • 23. Which average should you use?... cont’d • Example 1 – annual salary of employees: 30,000; 45,000; 45,000; and 200,000.  Median - 45,000 Mode - 45,000 Mean - 73,000 (does not match any of the salaries) • Example 2 – Suppose a stock clerk who handles different sizes of crutches wants to know which is the most popular size (mode) so that he can order enough to meet the demand
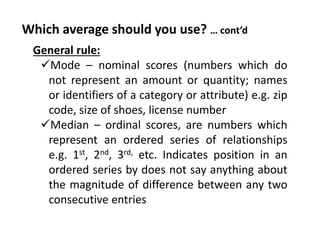
  • 24. Which average should you use? … cont’d General rule: Mode – nominal scores (numbers which do not represent an amount or quantity; names or identifiers of a category or attribute) e.g. zip code, size of shoes, license number Median – ordinal scores, are numbers which represent an ordered series of relationships e.g. 1st, 2nd, 3rd, etc. Indicates position in an ordered series by does not say anything about the magnitude of difference between any two consecutive entries
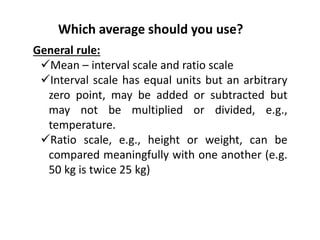
  • 25. Which average should you use? General rule: Mean – interval scale and ratio scale Interval scale has equal units but an arbitrary zero point, may be added or subtracted but may not be multiplied or divided, e.g., temperature. Ratio scale, e.g., height or weight, can be compared meaningfully with one another (e.g. 50 kg is twice 25 kg)
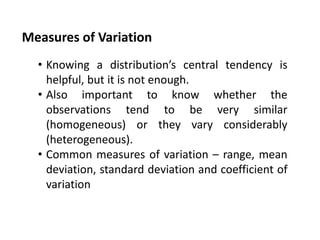
  • 26. Measures of Variation • Knowing a distribution’s central tendency is helpful, but it is not enough. • Also important to know whether the observations tend to be very similar (homogeneous) or they vary considerably (heterogeneous). • Common measures of variation – range, mean deviation, standard deviation and coefficient of variation
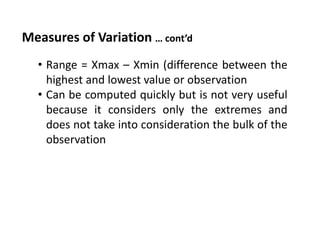
  • 27. Measures of Variation … cont’d • Range = Xmax – Xmin (difference between the highest and lowest value or observation • Can be computed quickly but is not very useful because it considers only the extremes and does not take into consideration the bulk of the observation
  • 28. Measures of Variation . . . Cont’d • Mean Deviation – a bit more sophisticated than the range • Defined as the average deviation of all observations from the mean
  • 29. Measures of Variation… cont’d • Standard deviation – represented by the symbol s. It is the square root of the variance of the observations • Variance is computed by squaring each deviation from the mean, adding them up and dividing their sum by n-1, where n is the sample size
  • 30. Measures of Variation … cont’d • Coefficient of variation – one application of the mean and the standard deviation • Defined as the ratio of the standard deviation to the absolute of the mean expressed as a percentage • Depicts the size of the standard deviation relative to its mean. • Both standard deviation and the mean represent the same units hence CV is free of the measurement units of the original data. Therefore, it is possible to compare the relative variation of even unrelated quantities.
  • 31. Concluding Statements • In describing data by using summary measure, it is important to select the measure of central tendency that most accurately represents the data • A better way of summarizing data is to use two summary measures – one to indicate the central tendency and one to indicate the variation • The most commonly used pair is arithmetic mean and the standard deviation