SlideShare a Scribd company logo
Transforming population and migration statistics
Case Study: International student employment activity
Centre for International Migration
Published: 30th January 2019
Coverage: England and Wales, academic year 2015/16, tax years 2015/16 and 2016/17
Disclaimer: These Research Outputs refer to international
undergraduate student employment from HESA student data
linked to HMRC PAYE annual records and are not Official
Statistics. These research outputs must not be interpreted as an
indicator of the numbers of international students employed whilst
studying.
Key messages
What can linking HESA and HMRC data tell us about employment and economic activity of
international students at Higher Education Institutions (HEIs) in England and Wales?
Our cohort analysis showed that EU students were more likely to be working
than not, with the opposite found of Non-EU students.
0
10
20
30
40
50
60
70
EU Non-EU
In
employment
Not in
employment
Difference in employment rates between
nationalities may reflect both immigration rules
and the economic background of students.
Non-EU students pay higher fees and are
more likely to be sponsored in their studies,
therefore their focus could be studying rather
than working.
This analysis strengthens our rationale behind
changing the approach to building the
Statistical Population Dataset – using an
approach based on hierarchy of belief rules
rather than a two data source rule inclusion.
Source: Office for National Statistics analysis of Higher Education Statistics Agency (HESA) student
records linked to HM Revenue and Customs (HMRC) Pay As You Earn (PAYE) annual income data
%
Can international students work whilst in the UK?
A Tier 41 visa allows non-EU students to work part-time during term time for up to 20 hours a week and full-time during the
holiday periods for those studying a full-time undergraduate or postgraduate degree. There are no working restrictions for
students from the EU.
In order to get the Tier 4 visa required to live and study in the UK, individuals need to prove they have enough money to cover
living expenses while in the UK.
This case study aims to build on research into international student
migration, specifically to understand the activity and impact they have
during their stay.
Data sources 1. Higher Education Statistics Agency (HESA) student records
2. HM Revenue & Customs (HMRC) Pay As You Earn (PAYE) annual records
Time period Academic year 2015/16
Tax years 2015/16 and 2016/17
Population coverage Undergraduate students registered at Government funded Higher Education
Institutions in England and Wales
Methodology Our methodology (slide 3), Differences in time periods (slide 10)
Things you need to
know
Previous research (slide 9), Disclaimers (slide 11), Other things you need to know
(slide 12 and 13)
How much do undergraduate students pay in fees?
Student fees vary by HE provider, course and level of study2.
Currently, EU undergraduate students, can pay up to £9,250 per year to study at universities in England and £9,000 in Wales.
International undergraduate students (those outside of EU and European Economic Area (EEA)) currently pay near-full-cost
tuition fees at UK universities, which generally vary between £10,000 and £40,000 per year.
Background
1 https://www.gov.uk/tier-4-general-visa/ 2 https://www.thecompleteuniversityguide.co.uk/university-tuition-fees/reddin-survey-of-university-tuition-fees/
Data linkage was carried out
using the Statistical Population
Dataset 2016 (SPD V2.0). For
further information on the
linkage methodology, see slide
12
There were 21,000 (5%) HESA
student records in our cohort
which did not link to the SPD. Of
which, the distribution by
nationality group were:
HESA Student data
2015/16 academic year
Undergraduate degree
At England and Wales
Higher Education Institution
Aged 16+
•Not in first or last year of
study
•Not studying abroad or
industrial placement
HMRC Annual
Earnings
Tax years 2015/16
and 2016/17
Income > £0 in tax
year
Only income paid
through PAYE system
(exc. self-employed)
Not in employment
If a student was not found in either
PAYE tax year, with an income
amount greater than £0, we assumed
that they were not in employment.
In employment
If a student was present within the
PAYE data at some point in the tax
years, with an income amount greater
than £0, we assumed that they were
in employment.
Not in employment - Number and
nationality in our cohort (n=99,000)
EU,
16,000 Non-EU,
14,000
UK,
245,000
EU,
11,000
Non-EU,
20,000
UK,
68,000
Likely reasons for residuals are
due to the SPD linkage inclusion
rules, i.e. that they do not have
a health record and/or National
Insurance Number (NINo).
Source: ONS analysis of HESA student records linked to
HMRC PAYE annual income data
Linked Residuals
EU 86% 14%
Non-EU 74% 26%
UK 99% 1%
Our linkage methodology
In employment - Number and nationality
in our cohort (n=276,000)
More UK students are working alongside studying compared with Non-UK nationals, as expected
UK students by employment status in tax years 2015/16 and 2016/17
Source: ONS analysis of HESA student records linked to HMRC PAYE annual income data
Nearly 80% of UK students were in employment at some point over the two tax years and over half of students in employment
in both years. There are no working restrictions for UK students and therefore we would expect a high proportion of UK
students to be working outside of their University time and during holiday periods.
Please note: someone who is a UK national could be domiciled overseas (or vice versa). This may result in potential
undercount or overcount of UK and international students in our analysis. See slide 13 for further explanation.
n=314,000
0
10
20
30
40
50
60
70
EU Non-EU Non-UK
%
In employment Not in employment
n=27,000 n=34,000
n=61,000
A greater proportion of EU students were in employment compared to Non-EU students
Difference in employment rates
between nationalities may reflect both
immigration rules and the economic
background of students. Non-EU
students pay higher fees and are
more likely to be sponsored in their
studies, therefore their focus could be
studying rather than working.
Source: ONS analysis of HESA student records linked to HMRC PAYE annual income data
Non-UK students by overall employment status
0% 10% 20% 30% 40% 50% 60% 70% 80% 90% 100%
UK
Earning in one tax year only Earning in both tax years Not earning
0 10 20 30 40 50 60 70 80 90 100
EU2
EU15
EU8
EU Other
Earning in one tax year only Earning in both tax years Not earning
Source: ONS analysis of HESA student records linked to HMRC PAYE annual income data
%
n= 2,000 n= 3,000 n= 1,000 n= 2,000 n= <500
n=2,000
n=7,000
n=16,000
n=3,000
EU8 nationals were the most likely to be in employment whilst studying in England and Wales
Source: ONS analysis of HESA student records linked to HMRC PAYE annual income data
Top 5 EU nationalities in employment whilst studying in the UK (% in employment, n=total cohort size)
EU other nationals (Cyprus (Ex, Southern) and Malta) were the least likely to be earning. In contrast, EU8 nationals had a
greater percentage (~75%) of working at some point during the two tax years compared to the other EU groupings.
Around 60% of both EU15 and EU2 nationals interacted with the PAYE system during the two tax years.
The top nationalities, based on the proportion in employment, were Lithuania, Poland and Republic of Ireland.
Please note: someone who is a non-UK national could be domiciled in the UK (or vice versa). This may result in potential
undercount or overcount of UK and international students in our analysis. See slide 13 for further explanation.
EU students by employment status in tax years 2015/16 and 2016/17
0 10 20 30 40 50 60 70 80 90 100
South Asia
Sub Saharan Africa
Central South America
North America
Oceania
Other Europe
North Africa
South East Asia
Middle East and Central Asia
East Asia
Earning in one tax year only Earning in both years Not earning
%
Non-EU students by employment status in tax years 2015/16 and 2016/17
n = <500 n= <500 n= 1,000 n= 2,000 n= 1,000
Source: ONS analysis of HESA student records linked to HMRC PAYE annual income data
Asian nationals were the least likely to work during study, except for South Asian nationals
n=7,000
n=3,000
n=5,000
n=1000
n=3,000
n=<500
n=2,000
n=1,000
n=8,000
n=5,000
Source: ONS analysis of HESA student records linked to HMRC PAYE annual income data
Asian nationalities had the least proportion working during the 2 tax years. South American and sub Saharan African nationals
were more likely to work than not.
Please note: someone who is a non-UK national could be domiciled in the UK (or vice versa). This may result in potential
undercount or overcount of UK and international students in our analysis. See slide 13 for further explanation.
Top 5 Non-EU nationalities in employment whilst studying in the UK (% in employment, n=total cohort size)
Putting administrative data at the core of our evidence on international migration (UK)
and on population (England and Wales) in 2020
It provides evidence for:
• Development of a Statistical Population Dataset from linked
administrative data
Linking HESA and PAYE data provides evidence of a potential
undercount within the Statistical Population Dataset (SPD) for
male international students, as these appeared over-represented
in our HESA residuals from data linkage. This supports the move
away from the two out of four source inclusion rule for SPDs.
• Understanding impact on different sectors within society and
the economy
In this case study we have been able to start looking at the
interactions of EU and non-EU undergraduate students within the
labour market. This research has also provided further clarity on
what these linked data can tell us, and what further work we need
to do to provide better evidence to inform policymakers.
ONS will receive HMRC PAYE Real Time Information (RTI) which
will enable us to undertake more timely analysis on the economic
interactions of international migration as well as its impact on the
economy.
The findings from this case study provide important insights that
will be key to the successful development of a population and
migration statistics system based on administrative data sources.
Next steps
To continue our research to understand
the employment activity of international
students both during and after studies in
the UK.
Covered in this research?
Yes No
Geographical coverage Government funded HEIs in
England and Wales
Other Government funded HEIs in the UK
Student characteristics Undergraduates (not first or last
course year)
Undergraduates (all years),
Postgraduates,
Distinguish between part and full time study
Employment sector Employment processed through
PAYE
Self-employed processed through the self
assessment forms
Completing the picture
1. Extending this research to complete the picture, including the other groups (as described above) and
information on travel patterns and tuition fees paid by international students. Following this, we plan to
explore further the reasons why international students do not work during their UK studies.
2. Utilising more granular data from HMRC PAYE Real Time Information (RTI), we will look to extend our
investigation by considering income amounts and more detailed patterns of employment and signs of
activity. This would allow for a better understanding of the when international migrants work within their
studies and the impact that this has on the economy.
3. Bring together this analysis with previous research on employment after UK study. From this we plan to
explore the association between degree course subject and employment sector during and after study.
Next steps
2014 to 2015 2015 to 2016 2016 to 2017
Year 1 - 2014 to 2015 Year 2 - 2015 to 2016 Year 3 - 2016 to 2017
2017 to 2018Tax year
Academic year
Students in their first year
may have been working
before starting study
Students in their last year
may have been working
after starting study
3-year undergraduate degree course
April August
For further information on the methodology, see section 5 of this research output.
• As HESA and PAYE data covered different time periods (i.e. the academic year begins in August and the tax year
begins in April), we removed certain records to make sure the data were consistent.
• If a student was present in the PAYE data for the tax year that overlaps with the beginning of their course, they
may have only been in employment prior to starting their studies. Similarly, if a student was present in the PAYE
data for the tax year that overlaps with the end of their course, they may have only been in employment after
finishing their studies. Therefore, students in their first or last year of study were removed prior to analysis.
However, if a student dropped out of their course before the expected last year, they will have been included.
• Students on an industrial placement year or studying abroad were also excluded in the analysis.
• It is important to note that the subset of undergraduate students included in this analysis will not be
representative of the England and Wales international student population.
Differences in time periods between the two data sources
Employment activity during studies
Last year, ONS published a Research Output investigating the economic activity of undergraduate students using administrative
data. Our research is based on similar methodology, extending this to consider economic activity of international students.
The Migration Advisory Committee (MAC) recently published a report on the impacts of international students in the UK. This
extensive review brought together various statistics and impact analysis to provide recommendations on UK policy toward
international students. Similarly, in January 2018, the Higher Education Policy Institute (HEPI) and Kaplan International Pathways
(KIP) published a report on the costs and benefits of international students by parliamentary constituency. Both of these did not
include the benefit from tax and national insurance paid by international students during their studies. Our exploratory research
will start to provide insight into this space.
The 2017 CPC-ONS-UUK (Centre for Population Change-ONS-Universities UK) Survey of Graduating International Students
(SoGIS) analysed patterns of working for international students approaching course completion, mainly focused on those studying
postgraduate degrees. In 2017, the first technical report described that, using the first wave of SoGIS data, 72% of international
finalist students were not working while they were studying; of the 28% who were working, the majority had either a part-time job
or casual work (n= 3,271). A policy paper and technical report were published by CPC using the second wave of SoGIS data.
Additionally, HESA publish data and analysis on each academic year.
Employment activity after studies
We have previously researched the immigration and emigration for non-EU international students using Home Office
administrative data: Report on international migration data sources: July 2018, International student migration research update:
August 2017. This exploratory research demonstrated that many people do not simply immigrate for study and leave afterwards;
their lives are more complex. Specifically, 26% of those on a study visa due to expire in April 2015 to April 2016 had applied for
and been granted leave to extend their stay in the UK (whether to work, study or other reasons).
In June 2018, the Department for Education (DfE) published international graduate and postgraduate outcomes 2005/06 to
2015/16 using the Longitudinal Educational Outcomes (LEO) data. DfE found that the post-study earnings of EU and non-EU
students are generally similar. However, trends of employment outcomes after study differed much more between the two domicile
groups with rising employment rates of EU domiciles compared with a sustained employment level of non-EU students.
The MAC report on impacts of international students in the UK also summarised information on those who stayed in the UK to
work post study using both LEO data and Home Office administrative data.
What other research is already published on activity of international students?
• Disclaimer: These Research Outputs on international undergraduate student employment are not
Official Statistics.
• Rather, they are published as outputs from exploratory research to show users of international migration
statistics where we are on our transformation journey to put administrative data at the core of our evidence
on international migration (UK) and on population (England and Wales) in 2020.
• These research outputs must not be interpreted as an indicator of the numbers of international
students employed whilst studying.
• These research outputs are based on experimental analysis of linked Higher Education Statistics Agency
student records linked to HM Revenue and Customs Pay-As-You-Earn annual income data. We are still
developing methods, therefore the numbers or proportions reported here may change in future reporting on
our journey to put administrative data at the core of population and migration statistics.
• It is important that the information and research presented here be read alongside the population and
migration statistics transformation update report to aid interpretation and avoid misunderstanding.
• These research outputs must not be reproduced without this disclaimer and warning note.
Things you need to know
Further details about our linkage methodology:
• For this research, we have linked Higher Education Statistics Agency (HESA) data for the academic year 2015/16
to Statistical Population Dataset (SPD) V2.0 for 2016 via a unique identifier.
• An SPD is a single, coherent dataset that forms the basis for estimating the population. It is produced by linking
records across multiple administrative data sources and applying a set of inclusion and distribution rules. Students
were only included in the analysis if they were present on SPD V2.0 2016.
• For more information on students not included in SPD V2.0, see the Methodology of Statistical Population Dataset
V2.0 report and the Research Output on estimating the size of the population in England and Wales.
The sample was selected carefully, based on the data available:
• This analysis was restricted to international undergraduate students aged 16 and over who were not in their first
or last year of study at a Higher Education Institution in England and Wales during the academic year 2015/16
and who were not studying abroad or on an industrial placement; this subset of students will not be
representative of the whole student population.
• Self-employed students were not categorised as employed in this analysis; therefore, the term “employment” used
throughout this publication refers to employment processed through the Pay As You Earn (PAYE) system only (see
section below).
• Students classified as employed in this analysis were in employment at some time during the tax years 2015/16
and 2016/17; therefore, it’s not possible to determine which academic year or how long they were in employment.
Income data are taken from HMRC’s Pay As You Earn (PAYE) system.
• Here, we used the annualised income amount to determine if an individual earnt at any point in the tax year.
• It’s not possible within the PAYE data that we’ve been supplied to distinguish between individuals in employment
and individuals in receipt of occupational or personal pensions. Due to the demographic of the student
population, we believe this would not impact on our research.
• PAYE does not include income data from: some small businesses where all employees earned less than £113 p/w
and individuals who are required to fill out a Self Assessment form (e.g. those who are self-employed).
Things you need to know
Nationality definition
• Nationality, as collected by HESA, is reported as national identity by the student on registration at their Higher
Education Institution (HEI). HESA also records domicile country which based on the postcode of the student's
permanent or home address prior to entry to the course.
• Both Nationality and domicile country are indicators of being an international student. However, for the purposes of
this analysis, we used nationality to identify international students. This was so we can align with research using
nationality on other data sources, such as the Migrant Worker Scan. Of course, using nationality may mean that
someone is a UK national, but may be domiciled overseas, and likewise a non-UK national may be domiciled in
the UK. This may result in potential undercount or overcount of international students, depending on which variable
is used.
• Neither nationality or domicile on HESA can provide the full picture for international students, and this may be
limiting for some countries more so than others. For example, someone may declare their nationality as Irish,
but this may include Northern Irish who identify as “Irish”, whereas in other sources their nationality may be
recorded as from the “United Kingdom”.
• For purposes of statistics, this may create uncertainty when grouping students in HESA in to EU/non-EU/UK
nationalities.
Nationality classification
• Nationality is classified using the International Passenger Survey country groupings found in the International
Migration - Table of Contents (citizenship/nationality groupings tab). This classification also includes world group
area, for example, EU2 includes Bulgaria and Romania.
• Nationality is grouped into EU and non-EU instead of EEA and non-EEA (which is generally more related to
immigration control) to be consistent with previous research. For this reason the following EEA countries will appear
in the non-EU nationality group: Iceland, Norway & Liechtenstein.
• Additionally, Swiss nationals are included in the non-EU nationality group. Switzerland is neither part of the EU or
the EEA but is part of the single market so Swiss nationals have the same rights to live and work in the UK as other
EEA nationals.
• The EU nationality group excludes British nationals.
Things you need to know
Contact Us
We would welcome your feedback on the exploratory research
presented here. Please get in touch at:
Email: pop.info@ons.gov.uk
Tel: 01329 444661
Further Links
Go back to: An update on our population and migration statistics transformation journey: A research
engagement report
Explore our other case studies on SlideShare
Transforming population and migration statistics: Administrative data-based population stocks and
flows
Transforming population and migration statistics: Emigration patterns of non-EU students
Transforming population and migration statistics: Benefits and income activity patterns
Transforming population and migration statistics: NINo and NHS registration lags
Transforming population and migration statistics: Patterns of circular movement into the UK
Ad

More Related Content

Similar to Transforming population and migration statistics: International student employment activity (20)

#FIRMday Leeds 27th November 2019 - Prospects: Graduate Labour Market Trends
#FIRMday Leeds 27th November 2019 - Prospects: Graduate Labour Market Trends  #FIRMday Leeds 27th November 2019 - Prospects: Graduate Labour Market Trends
#FIRMday Leeds 27th November 2019 - Prospects: Graduate Labour Market Trends
Emma Mirrington
 
International Student – Information for Employers
International Student – Information for EmployersInternational Student – Information for Employers
International Student – Information for Employers
Career Development Service, University of Leicester
 
Events and trends in UK Higher Education, February 2016
Events and trends in UK Higher Education, February 2016Events and trends in UK Higher Education, February 2016
Events and trends in UK Higher Education, February 2016
Emma Kennedy
 
Working in the UK after your studies
Working in the UK after your studies Working in the UK after your studies
Working in the UK after your studies
University of Sussex, Careers & Employability Centre
 
Impact Stories - ISI Webinar: Creating competitive advantage in the market fo...
Impact Stories - ISI Webinar: Creating competitive advantage in the market fo...Impact Stories - ISI Webinar: Creating competitive advantage in the market fo...
Impact Stories - ISI Webinar: Creating competitive advantage in the market fo...
Impact Stories
 
UK post study internships for Chinese students report 2014-15
UK post study internships for Chinese students report 2014-15UK post study internships for Chinese students report 2014-15
UK post study internships for Chinese students report 2014-15
Colin Chen
 
5 Riveting Facts for a UK Student.pdf
5 Riveting Facts for a UK Student.pdf5 Riveting Facts for a UK Student.pdf
5 Riveting Facts for a UK Student.pdf
AHZ Associates Lahore ( Study Abroad Consultants - Study in UK)
 
5 riveting facts for a uk student
5 riveting facts for a uk student5 riveting facts for a uk student
5 riveting facts for a uk student
AHZ Associates
 
5 Surprising Facts about UK Universities
5 Surprising Facts about UK Universities5 Surprising Facts about UK Universities
5 Surprising Facts about UK Universities
AHZ Associates
 
Economics of education 04.11.11(3)
Economics of education 04.11.11(3)Economics of education 04.11.11(3)
Economics of education 04.11.11(3)
Dan Curtis
 
Working in the UK after your Studies - Visas and Employment
Working in the UK after your Studies - Visas and EmploymentWorking in the UK after your Studies - Visas and Employment
Working in the UK after your Studies - Visas and Employment
University of Sussex, Careers & Employability Centre
 
2015 01 09_briefing - non-european labour migration_mig_observatory
2015 01 09_briefing - non-european labour migration_mig_observatory2015 01 09_briefing - non-european labour migration_mig_observatory
2015 01 09_briefing - non-european labour migration_mig_observatory
Miqui Mel
 
Bill Rammell Plenary
Bill Rammell PlenaryBill Rammell Plenary
Bill Rammell Plenary
Association of University Administrators
 
Unit 10: Work and Education
Unit 10: Work and EducationUnit 10: Work and Education
Unit 10: Work and Education
British Studies
 
UK_Student_Accommodation_Report_Dec_15
UK_Student_Accommodation_Report_Dec_15UK_Student_Accommodation_Report_Dec_15
UK_Student_Accommodation_Report_Dec_15
Sam Gadar
 
Post Study Work Opportunities in UK, USA, Australia, New Zealand, Canada, Ger...
Post Study Work Opportunities in UK, USA, Australia, New Zealand, Canada, Ger...Post Study Work Opportunities in UK, USA, Australia, New Zealand, Canada, Ger...
Post Study Work Opportunities in UK, USA, Australia, New Zealand, Canada, Ger...
MeetUniversity
 
CHILDCARE GRANT AND OTHER SUPPORT FOR FULL-TIME STUDENT PARENTS IN ...
CHILDCARE GRANT AND OTHER SUPPORT FOR FULL-TIME STUDENT PARENTS IN ...CHILDCARE GRANT AND OTHER SUPPORT FOR FULL-TIME STUDENT PARENTS IN ...
CHILDCARE GRANT AND OTHER SUPPORT FOR FULL-TIME STUDENT PARENTS IN ...
pleasure16
 
Transforming education through data
Transforming education through dataTransforming education through data
Transforming education through data
Structuralpolicyanalysis
 
UK Post-Study Work Permit & Graduate Visa MAC Report Insights.docx
UK Post-Study Work Permit & Graduate Visa MAC Report Insights.docxUK Post-Study Work Permit & Graduate Visa MAC Report Insights.docx
UK Post-Study Work Permit & Graduate Visa MAC Report Insights.docx
Zunaisha1
 
Post Study Work Visa
Post Study Work VisaPost Study Work Visa
Post Study Work Visa
University of Sussex, Careers & Employability Centre
 
#FIRMday Leeds 27th November 2019 - Prospects: Graduate Labour Market Trends
#FIRMday Leeds 27th November 2019 - Prospects: Graduate Labour Market Trends  #FIRMday Leeds 27th November 2019 - Prospects: Graduate Labour Market Trends
#FIRMday Leeds 27th November 2019 - Prospects: Graduate Labour Market Trends
Emma Mirrington
 
Events and trends in UK Higher Education, February 2016
Events and trends in UK Higher Education, February 2016Events and trends in UK Higher Education, February 2016
Events and trends in UK Higher Education, February 2016
Emma Kennedy
 
Impact Stories - ISI Webinar: Creating competitive advantage in the market fo...
Impact Stories - ISI Webinar: Creating competitive advantage in the market fo...Impact Stories - ISI Webinar: Creating competitive advantage in the market fo...
Impact Stories - ISI Webinar: Creating competitive advantage in the market fo...
Impact Stories
 
UK post study internships for Chinese students report 2014-15
UK post study internships for Chinese students report 2014-15UK post study internships for Chinese students report 2014-15
UK post study internships for Chinese students report 2014-15
Colin Chen
 
5 riveting facts for a uk student
5 riveting facts for a uk student5 riveting facts for a uk student
5 riveting facts for a uk student
AHZ Associates
 
5 Surprising Facts about UK Universities
5 Surprising Facts about UK Universities5 Surprising Facts about UK Universities
5 Surprising Facts about UK Universities
AHZ Associates
 
Economics of education 04.11.11(3)
Economics of education 04.11.11(3)Economics of education 04.11.11(3)
Economics of education 04.11.11(3)
Dan Curtis
 
2015 01 09_briefing - non-european labour migration_mig_observatory
2015 01 09_briefing - non-european labour migration_mig_observatory2015 01 09_briefing - non-european labour migration_mig_observatory
2015 01 09_briefing - non-european labour migration_mig_observatory
Miqui Mel
 
Unit 10: Work and Education
Unit 10: Work and EducationUnit 10: Work and Education
Unit 10: Work and Education
British Studies
 
UK_Student_Accommodation_Report_Dec_15
UK_Student_Accommodation_Report_Dec_15UK_Student_Accommodation_Report_Dec_15
UK_Student_Accommodation_Report_Dec_15
Sam Gadar
 
Post Study Work Opportunities in UK, USA, Australia, New Zealand, Canada, Ger...
Post Study Work Opportunities in UK, USA, Australia, New Zealand, Canada, Ger...Post Study Work Opportunities in UK, USA, Australia, New Zealand, Canada, Ger...
Post Study Work Opportunities in UK, USA, Australia, New Zealand, Canada, Ger...
MeetUniversity
 
CHILDCARE GRANT AND OTHER SUPPORT FOR FULL-TIME STUDENT PARENTS IN ...
CHILDCARE GRANT AND OTHER SUPPORT FOR FULL-TIME STUDENT PARENTS IN ...CHILDCARE GRANT AND OTHER SUPPORT FOR FULL-TIME STUDENT PARENTS IN ...
CHILDCARE GRANT AND OTHER SUPPORT FOR FULL-TIME STUDENT PARENTS IN ...
pleasure16
 
UK Post-Study Work Permit & Graduate Visa MAC Report Insights.docx
UK Post-Study Work Permit & Graduate Visa MAC Report Insights.docxUK Post-Study Work Permit & Graduate Visa MAC Report Insights.docx
UK Post-Study Work Permit & Graduate Visa MAC Report Insights.docx
Zunaisha1
 

More from Office for National Statistics (20)

Earnings Symposium Slidepack - 29 April 2025
Earnings Symposium Slidepack - 29 April 2025Earnings Symposium Slidepack - 29 April 2025
Earnings Symposium Slidepack - 29 April 2025
Office for National Statistics
 
Bringing data to life - Crime webinar Accessible.pptx
Bringing data to life - Crime webinar Accessible.pptxBringing data to life - Crime webinar Accessible.pptx
Bringing data to life - Crime webinar Accessible.pptx
Office for National Statistics
 
ONS Economic Forum Slidepack – 19 May 2025.pptx
ONS Economic Forum Slidepack – 19 May 2025.pptxONS Economic Forum Slidepack – 19 May 2025.pptx
ONS Economic Forum Slidepack – 19 May 2025.pptx
Office for National Statistics
 
Measuring what matters most: understanding national well-being
Measuring what matters most: understanding national well-beingMeasuring what matters most: understanding national well-being
Measuring what matters most: understanding national well-being
Office for National Statistics
 
ONS Economic Forum Slidepack - 24 March 2025 (slideshare).pptx
ONS Economic Forum Slidepack - 24 March 2025 (slideshare).pptxONS Economic Forum Slidepack - 24 March 2025 (slideshare).pptx
ONS Economic Forum Slidepack - 24 March 2025 (slideshare).pptx
Office for National Statistics
 
Bringing data to life: Artificial Intelligence and innovation - keeping human...
Bringing data to life: Artificial Intelligence and innovation - keeping human...Bringing data to life: Artificial Intelligence and innovation - keeping human...
Bringing data to life: Artificial Intelligence and innovation - keeping human...
Office for National Statistics
 
SlideShare ONS Economic Forum Slidepack - 27 January 2025
SlideShare ONS Economic Forum Slidepack - 27 January 2025SlideShare ONS Economic Forum Slidepack - 27 January 2025
SlideShare ONS Economic Forum Slidepack - 27 January 2025
Office for National Statistics
 
A Quick Introduction to the Reference Data Management Framework
A Quick Introduction to the Reference Data Management FrameworkA Quick Introduction to the Reference Data Management Framework
A Quick Introduction to the Reference Data Management Framework
Office for National Statistics
 
Reference Data Management Framework Overview Digital Booklet
Reference Data Management Framework Overview Digital BookletReference Data Management Framework Overview Digital Booklet
Reference Data Management Framework Overview Digital Booklet
Office for National Statistics
 
Bringing data to life: How are your vitals? Exploring health by numbers
Bringing data to life: How are your vitals? Exploring health by numbersBringing data to life: How are your vitals? Exploring health by numbers
Bringing data to life: How are your vitals? Exploring health by numbers
Office for National Statistics
 
SlideShare Annual crime and justice statistics forum - 7 November 2024
SlideShare Annual crime and justice statistics forum - 7 November 2024SlideShare Annual crime and justice statistics forum - 7 November 2024
SlideShare Annual crime and justice statistics forum - 7 November 2024
Office for National Statistics
 
SlideShare ONS Economic Forum Slidepack - 25 November 2024
SlideShare ONS Economic Forum Slidepack - 25 November 2024SlideShare ONS Economic Forum Slidepack - 25 November 2024
SlideShare ONS Economic Forum Slidepack - 25 November 2024
Office for National Statistics
 
Air fryers and vinyl records: how we measure the cost of living
Air fryers and vinyl records: how we measure the cost of livingAir fryers and vinyl records: how we measure the cost of living
Air fryers and vinyl records: how we measure the cost of living
Office for National Statistics
 
Bringing data to life - environment static.pptx
Bringing data to life - environment static.pptxBringing data to life - environment static.pptx
Bringing data to life - environment static.pptx
Office for National Statistics
 
Bringing data to life an introduction to statistics
Bringing data to life an introduction to statisticsBringing data to life an introduction to statistics
Bringing data to life an introduction to statistics
Office for National Statistics
 
SlideShare – ONS Economic Forum Slidepack 21 October 2024
SlideShare – ONS Economic Forum Slidepack  21 October 2024SlideShare – ONS Economic Forum Slidepack  21 October 2024
SlideShare – ONS Economic Forum Slidepack 21 October 2024
Office for National Statistics
 
Navigating numbers: Business, industry and trade (PowerPoint)
Navigating numbers: Business, industry and trade (PowerPoint)Navigating numbers: Business, industry and trade (PowerPoint)
Navigating numbers: Business, industry and trade (PowerPoint)
Office for National Statistics
 
Navigating numbers: Inflation (PowerPoint)
Navigating numbers: Inflation (PowerPoint)Navigating numbers: Inflation (PowerPoint)
Navigating numbers: Inflation (PowerPoint)
Office for National Statistics
 
SlideShare ONS Economic Forum Slidepack - 23 September 2024
SlideShare ONS Economic Forum Slidepack - 23 September 2024SlideShare ONS Economic Forum Slidepack - 23 September 2024
SlideShare ONS Economic Forum Slidepack - 23 September 2024
Office for National Statistics
 
Defnyddio rhifau: Busnes, diwydiant a masnach
Defnyddio rhifau: Busnes, diwydiant a masnachDefnyddio rhifau: Busnes, diwydiant a masnach
Defnyddio rhifau: Busnes, diwydiant a masnach
Office for National Statistics
 
Measuring what matters most: understanding national well-being
Measuring what matters most: understanding national well-beingMeasuring what matters most: understanding national well-being
Measuring what matters most: understanding national well-being
Office for National Statistics
 
ONS Economic Forum Slidepack - 24 March 2025 (slideshare).pptx
ONS Economic Forum Slidepack - 24 March 2025 (slideshare).pptxONS Economic Forum Slidepack - 24 March 2025 (slideshare).pptx
ONS Economic Forum Slidepack - 24 March 2025 (slideshare).pptx
Office for National Statistics
 
Bringing data to life: Artificial Intelligence and innovation - keeping human...
Bringing data to life: Artificial Intelligence and innovation - keeping human...Bringing data to life: Artificial Intelligence and innovation - keeping human...
Bringing data to life: Artificial Intelligence and innovation - keeping human...
Office for National Statistics
 
SlideShare ONS Economic Forum Slidepack - 27 January 2025
SlideShare ONS Economic Forum Slidepack - 27 January 2025SlideShare ONS Economic Forum Slidepack - 27 January 2025
SlideShare ONS Economic Forum Slidepack - 27 January 2025
Office for National Statistics
 
A Quick Introduction to the Reference Data Management Framework
A Quick Introduction to the Reference Data Management FrameworkA Quick Introduction to the Reference Data Management Framework
A Quick Introduction to the Reference Data Management Framework
Office for National Statistics
 
Reference Data Management Framework Overview Digital Booklet
Reference Data Management Framework Overview Digital BookletReference Data Management Framework Overview Digital Booklet
Reference Data Management Framework Overview Digital Booklet
Office for National Statistics
 
Bringing data to life: How are your vitals? Exploring health by numbers
Bringing data to life: How are your vitals? Exploring health by numbersBringing data to life: How are your vitals? Exploring health by numbers
Bringing data to life: How are your vitals? Exploring health by numbers
Office for National Statistics
 
SlideShare Annual crime and justice statistics forum - 7 November 2024
SlideShare Annual crime and justice statistics forum - 7 November 2024SlideShare Annual crime and justice statistics forum - 7 November 2024
SlideShare Annual crime and justice statistics forum - 7 November 2024
Office for National Statistics
 
SlideShare ONS Economic Forum Slidepack - 25 November 2024
SlideShare ONS Economic Forum Slidepack - 25 November 2024SlideShare ONS Economic Forum Slidepack - 25 November 2024
SlideShare ONS Economic Forum Slidepack - 25 November 2024
Office for National Statistics
 
Air fryers and vinyl records: how we measure the cost of living
Air fryers and vinyl records: how we measure the cost of livingAir fryers and vinyl records: how we measure the cost of living
Air fryers and vinyl records: how we measure the cost of living
Office for National Statistics
 
SlideShare – ONS Economic Forum Slidepack 21 October 2024
SlideShare – ONS Economic Forum Slidepack  21 October 2024SlideShare – ONS Economic Forum Slidepack  21 October 2024
SlideShare – ONS Economic Forum Slidepack 21 October 2024
Office for National Statistics
 
Navigating numbers: Business, industry and trade (PowerPoint)
Navigating numbers: Business, industry and trade (PowerPoint)Navigating numbers: Business, industry and trade (PowerPoint)
Navigating numbers: Business, industry and trade (PowerPoint)
Office for National Statistics
 
SlideShare ONS Economic Forum Slidepack - 23 September 2024
SlideShare ONS Economic Forum Slidepack - 23 September 2024SlideShare ONS Economic Forum Slidepack - 23 September 2024
SlideShare ONS Economic Forum Slidepack - 23 September 2024
Office for National Statistics
 
Ad

Recently uploaded (20)

Concrete_Presenbmlkvvbvvvfvbbbfcfftation.pptx
Concrete_Presenbmlkvvbvvvfvbbbfcfftation.pptxConcrete_Presenbmlkvvbvvvfvbbbfcfftation.pptx
Concrete_Presenbmlkvvbvvvfvbbbfcfftation.pptx
ssuserd1f4a3
 
Digital Disruption Use Case_Music Industry_for students.pdf
Digital Disruption Use Case_Music Industry_for students.pdfDigital Disruption Use Case_Music Industry_for students.pdf
Digital Disruption Use Case_Music Industry_for students.pdf
ProsenjitMitra9
 
Snowflake training | Snowflake online course
Snowflake training | Snowflake online courseSnowflake training | Snowflake online course
Snowflake training | Snowflake online course
Accentfuture
 
lecture_13 tree in mmmmmmmm mmmmmfftro.pptx
lecture_13 tree in mmmmmmmm     mmmmmfftro.pptxlecture_13 tree in mmmmmmmm     mmmmmfftro.pptx
lecture_13 tree in mmmmmmmm mmmmmfftro.pptx
sarajafffri058
 
DATA ANALYST and Techniques in Kochi Explore cutting-edge analytical skills ...
DATA ANALYST  and Techniques in Kochi Explore cutting-edge analytical skills ...DATA ANALYST  and Techniques in Kochi Explore cutting-edge analytical skills ...
DATA ANALYST and Techniques in Kochi Explore cutting-edge analytical skills ...
aacj102006
 
Important JavaScript Concepts Every Developer Must Know
Important JavaScript Concepts Every Developer Must KnowImportant JavaScript Concepts Every Developer Must Know
Important JavaScript Concepts Every Developer Must Know
yashikanigam1
 
Introduction to systems thinking tools_Eng.pdf
Introduction to systems thinking tools_Eng.pdfIntroduction to systems thinking tools_Eng.pdf
Introduction to systems thinking tools_Eng.pdf
AbdurahmanAbd
 
Hootsuite Social Trends 2025 Report_en.pdf
Hootsuite Social Trends 2025 Report_en.pdfHootsuite Social Trends 2025 Report_en.pdf
Hootsuite Social Trends 2025 Report_en.pdf
lionardoadityabagask
 
Urban models for professional practice 03
Urban models for professional practice 03Urban models for professional practice 03
Urban models for professional practice 03
DanisseLoiDapdap
 
Lesson 6-Interviewing in SHRM_updated.pdf
Lesson 6-Interviewing in SHRM_updated.pdfLesson 6-Interviewing in SHRM_updated.pdf
Lesson 6-Interviewing in SHRM_updated.pdf
hemelali11
 
Time series analysis & forecasting day 2.pptx
Time series analysis & forecasting day 2.pptxTime series analysis & forecasting day 2.pptx
Time series analysis & forecasting day 2.pptx
AsmaaMahmoud89
 
Introduction to Python_for_machine_learning.pdf
Introduction to Python_for_machine_learning.pdfIntroduction to Python_for_machine_learning.pdf
Introduction to Python_for_machine_learning.pdf
goldenflower34
 
Kilowatt's Impact Report _ 2024 x
Kilowatt's Impact Report _ 2024                xKilowatt's Impact Report _ 2024                x
Kilowatt's Impact Report _ 2024 x
Kilowatt
 
report (maam dona subject).pptxhsgwiswhs
report (maam dona subject).pptxhsgwiswhsreport (maam dona subject).pptxhsgwiswhs
report (maam dona subject).pptxhsgwiswhs
AngelPinedaTaguinod
 
Introduction to MedDRA hgjuyh mnhvnj mbv hvj jhgjgjgjg
Introduction to MedDRA hgjuyh mnhvnj mbv hvj jhgjgjgjgIntroduction to MedDRA hgjuyh mnhvnj mbv hvj jhgjgjgjg
Introduction to MedDRA hgjuyh mnhvnj mbv hvj jhgjgjgjg
MichaelTuffourAmirik
 
How to Set Up Process Mining in a Decentralized Organization?
How to Set Up Process Mining in a Decentralized Organization?How to Set Up Process Mining in a Decentralized Organization?
How to Set Up Process Mining in a Decentralized Organization?
Process mining Evangelist
 
2-Cholera-Outbreaks-and-Waterborne-Pathogens-Typhoid-fever (1).pdf
2-Cholera-Outbreaks-and-Waterborne-Pathogens-Typhoid-fever (1).pdf2-Cholera-Outbreaks-and-Waterborne-Pathogens-Typhoid-fever (1).pdf
2-Cholera-Outbreaks-and-Waterborne-Pathogens-Typhoid-fever (1).pdf
AngelitaVergara1
 
Dynamics 365 Business Rules Dynamics Dynamics
Dynamics 365 Business Rules Dynamics DynamicsDynamics 365 Business Rules Dynamics Dynamics
Dynamics 365 Business Rules Dynamics Dynamics
heyoubro69
 
presentacion.slideshare.informáticaJuridica..pptx
presentacion.slideshare.informáticaJuridica..pptxpresentacion.slideshare.informáticaJuridica..pptx
presentacion.slideshare.informáticaJuridica..pptx
GersonVillatoro4
 
Unit 2 - Unified Modeling Language (UML).pdf
Unit 2 - Unified Modeling Language (UML).pdfUnit 2 - Unified Modeling Language (UML).pdf
Unit 2 - Unified Modeling Language (UML).pdf
sixokak391
 
Concrete_Presenbmlkvvbvvvfvbbbfcfftation.pptx
Concrete_Presenbmlkvvbvvvfvbbbfcfftation.pptxConcrete_Presenbmlkvvbvvvfvbbbfcfftation.pptx
Concrete_Presenbmlkvvbvvvfvbbbfcfftation.pptx
ssuserd1f4a3
 
Digital Disruption Use Case_Music Industry_for students.pdf
Digital Disruption Use Case_Music Industry_for students.pdfDigital Disruption Use Case_Music Industry_for students.pdf
Digital Disruption Use Case_Music Industry_for students.pdf
ProsenjitMitra9
 
Snowflake training | Snowflake online course
Snowflake training | Snowflake online courseSnowflake training | Snowflake online course
Snowflake training | Snowflake online course
Accentfuture
 
lecture_13 tree in mmmmmmmm mmmmmfftro.pptx
lecture_13 tree in mmmmmmmm     mmmmmfftro.pptxlecture_13 tree in mmmmmmmm     mmmmmfftro.pptx
lecture_13 tree in mmmmmmmm mmmmmfftro.pptx
sarajafffri058
 
DATA ANALYST and Techniques in Kochi Explore cutting-edge analytical skills ...
DATA ANALYST  and Techniques in Kochi Explore cutting-edge analytical skills ...DATA ANALYST  and Techniques in Kochi Explore cutting-edge analytical skills ...
DATA ANALYST and Techniques in Kochi Explore cutting-edge analytical skills ...
aacj102006
 
Important JavaScript Concepts Every Developer Must Know
Important JavaScript Concepts Every Developer Must KnowImportant JavaScript Concepts Every Developer Must Know
Important JavaScript Concepts Every Developer Must Know
yashikanigam1
 
Introduction to systems thinking tools_Eng.pdf
Introduction to systems thinking tools_Eng.pdfIntroduction to systems thinking tools_Eng.pdf
Introduction to systems thinking tools_Eng.pdf
AbdurahmanAbd
 
Hootsuite Social Trends 2025 Report_en.pdf
Hootsuite Social Trends 2025 Report_en.pdfHootsuite Social Trends 2025 Report_en.pdf
Hootsuite Social Trends 2025 Report_en.pdf
lionardoadityabagask
 
Urban models for professional practice 03
Urban models for professional practice 03Urban models for professional practice 03
Urban models for professional practice 03
DanisseLoiDapdap
 
Lesson 6-Interviewing in SHRM_updated.pdf
Lesson 6-Interviewing in SHRM_updated.pdfLesson 6-Interviewing in SHRM_updated.pdf
Lesson 6-Interviewing in SHRM_updated.pdf
hemelali11
 
Time series analysis & forecasting day 2.pptx
Time series analysis & forecasting day 2.pptxTime series analysis & forecasting day 2.pptx
Time series analysis & forecasting day 2.pptx
AsmaaMahmoud89
 
Introduction to Python_for_machine_learning.pdf
Introduction to Python_for_machine_learning.pdfIntroduction to Python_for_machine_learning.pdf
Introduction to Python_for_machine_learning.pdf
goldenflower34
 
Kilowatt's Impact Report _ 2024 x
Kilowatt's Impact Report _ 2024                xKilowatt's Impact Report _ 2024                x
Kilowatt's Impact Report _ 2024 x
Kilowatt
 
report (maam dona subject).pptxhsgwiswhs
report (maam dona subject).pptxhsgwiswhsreport (maam dona subject).pptxhsgwiswhs
report (maam dona subject).pptxhsgwiswhs
AngelPinedaTaguinod
 
Introduction to MedDRA hgjuyh mnhvnj mbv hvj jhgjgjgjg
Introduction to MedDRA hgjuyh mnhvnj mbv hvj jhgjgjgjgIntroduction to MedDRA hgjuyh mnhvnj mbv hvj jhgjgjgjg
Introduction to MedDRA hgjuyh mnhvnj mbv hvj jhgjgjgjg
MichaelTuffourAmirik
 
How to Set Up Process Mining in a Decentralized Organization?
How to Set Up Process Mining in a Decentralized Organization?How to Set Up Process Mining in a Decentralized Organization?
How to Set Up Process Mining in a Decentralized Organization?
Process mining Evangelist
 
2-Cholera-Outbreaks-and-Waterborne-Pathogens-Typhoid-fever (1).pdf
2-Cholera-Outbreaks-and-Waterborne-Pathogens-Typhoid-fever (1).pdf2-Cholera-Outbreaks-and-Waterborne-Pathogens-Typhoid-fever (1).pdf
2-Cholera-Outbreaks-and-Waterborne-Pathogens-Typhoid-fever (1).pdf
AngelitaVergara1
 
Dynamics 365 Business Rules Dynamics Dynamics
Dynamics 365 Business Rules Dynamics DynamicsDynamics 365 Business Rules Dynamics Dynamics
Dynamics 365 Business Rules Dynamics Dynamics
heyoubro69
 
presentacion.slideshare.informáticaJuridica..pptx
presentacion.slideshare.informáticaJuridica..pptxpresentacion.slideshare.informáticaJuridica..pptx
presentacion.slideshare.informáticaJuridica..pptx
GersonVillatoro4
 
Unit 2 - Unified Modeling Language (UML).pdf
Unit 2 - Unified Modeling Language (UML).pdfUnit 2 - Unified Modeling Language (UML).pdf
Unit 2 - Unified Modeling Language (UML).pdf
sixokak391
 
Ad

Transforming population and migration statistics: International student employment activity

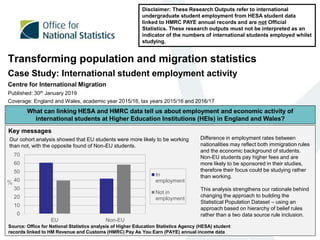
  • 1. Transforming population and migration statistics Case Study: International student employment activity Centre for International Migration Published: 30th January 2019 Coverage: England and Wales, academic year 2015/16, tax years 2015/16 and 2016/17 Disclaimer: These Research Outputs refer to international undergraduate student employment from HESA student data linked to HMRC PAYE annual records and are not Official Statistics. These research outputs must not be interpreted as an indicator of the numbers of international students employed whilst studying. Key messages What can linking HESA and HMRC data tell us about employment and economic activity of international students at Higher Education Institutions (HEIs) in England and Wales? Our cohort analysis showed that EU students were more likely to be working than not, with the opposite found of Non-EU students. 0 10 20 30 40 50 60 70 EU Non-EU In employment Not in employment Difference in employment rates between nationalities may reflect both immigration rules and the economic background of students. Non-EU students pay higher fees and are more likely to be sponsored in their studies, therefore their focus could be studying rather than working. This analysis strengthens our rationale behind changing the approach to building the Statistical Population Dataset – using an approach based on hierarchy of belief rules rather than a two data source rule inclusion. Source: Office for National Statistics analysis of Higher Education Statistics Agency (HESA) student records linked to HM Revenue and Customs (HMRC) Pay As You Earn (PAYE) annual income data %
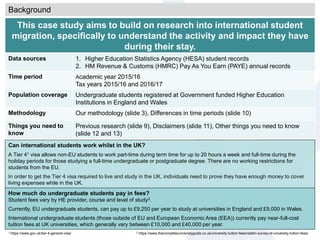
  • 2. Can international students work whilst in the UK? A Tier 41 visa allows non-EU students to work part-time during term time for up to 20 hours a week and full-time during the holiday periods for those studying a full-time undergraduate or postgraduate degree. There are no working restrictions for students from the EU. In order to get the Tier 4 visa required to live and study in the UK, individuals need to prove they have enough money to cover living expenses while in the UK. This case study aims to build on research into international student migration, specifically to understand the activity and impact they have during their stay. Data sources 1. Higher Education Statistics Agency (HESA) student records 2. HM Revenue & Customs (HMRC) Pay As You Earn (PAYE) annual records Time period Academic year 2015/16 Tax years 2015/16 and 2016/17 Population coverage Undergraduate students registered at Government funded Higher Education Institutions in England and Wales Methodology Our methodology (slide 3), Differences in time periods (slide 10) Things you need to know Previous research (slide 9), Disclaimers (slide 11), Other things you need to know (slide 12 and 13) How much do undergraduate students pay in fees? Student fees vary by HE provider, course and level of study2. Currently, EU undergraduate students, can pay up to £9,250 per year to study at universities in England and £9,000 in Wales. International undergraduate students (those outside of EU and European Economic Area (EEA)) currently pay near-full-cost tuition fees at UK universities, which generally vary between £10,000 and £40,000 per year. Background 1 https://www.gov.uk/tier-4-general-visa/ 2 https://www.thecompleteuniversityguide.co.uk/university-tuition-fees/reddin-survey-of-university-tuition-fees/
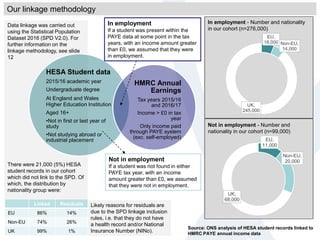
  • 3. Data linkage was carried out using the Statistical Population Dataset 2016 (SPD V2.0). For further information on the linkage methodology, see slide 12 There were 21,000 (5%) HESA student records in our cohort which did not link to the SPD. Of which, the distribution by nationality group were: HESA Student data 2015/16 academic year Undergraduate degree At England and Wales Higher Education Institution Aged 16+ •Not in first or last year of study •Not studying abroad or industrial placement HMRC Annual Earnings Tax years 2015/16 and 2016/17 Income > £0 in tax year Only income paid through PAYE system (exc. self-employed) Not in employment If a student was not found in either PAYE tax year, with an income amount greater than £0, we assumed that they were not in employment. In employment If a student was present within the PAYE data at some point in the tax years, with an income amount greater than £0, we assumed that they were in employment. Not in employment - Number and nationality in our cohort (n=99,000) EU, 16,000 Non-EU, 14,000 UK, 245,000 EU, 11,000 Non-EU, 20,000 UK, 68,000 Likely reasons for residuals are due to the SPD linkage inclusion rules, i.e. that they do not have a health record and/or National Insurance Number (NINo). Source: ONS analysis of HESA student records linked to HMRC PAYE annual income data Linked Residuals EU 86% 14% Non-EU 74% 26% UK 99% 1% Our linkage methodology In employment - Number and nationality in our cohort (n=276,000)
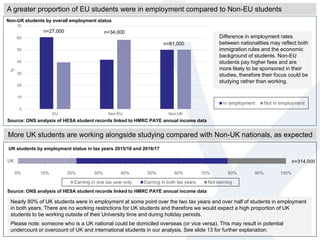
  • 4. More UK students are working alongside studying compared with Non-UK nationals, as expected UK students by employment status in tax years 2015/16 and 2016/17 Source: ONS analysis of HESA student records linked to HMRC PAYE annual income data Nearly 80% of UK students were in employment at some point over the two tax years and over half of students in employment in both years. There are no working restrictions for UK students and therefore we would expect a high proportion of UK students to be working outside of their University time and during holiday periods. Please note: someone who is a UK national could be domiciled overseas (or vice versa). This may result in potential undercount or overcount of UK and international students in our analysis. See slide 13 for further explanation. n=314,000 0 10 20 30 40 50 60 70 EU Non-EU Non-UK % In employment Not in employment n=27,000 n=34,000 n=61,000 A greater proportion of EU students were in employment compared to Non-EU students Difference in employment rates between nationalities may reflect both immigration rules and the economic background of students. Non-EU students pay higher fees and are more likely to be sponsored in their studies, therefore their focus could be studying rather than working. Source: ONS analysis of HESA student records linked to HMRC PAYE annual income data Non-UK students by overall employment status 0% 10% 20% 30% 40% 50% 60% 70% 80% 90% 100% UK Earning in one tax year only Earning in both tax years Not earning
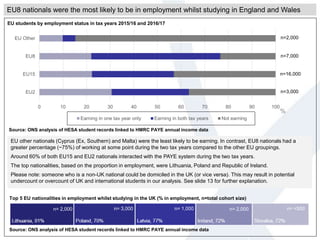
  • 5. 0 10 20 30 40 50 60 70 80 90 100 EU2 EU15 EU8 EU Other Earning in one tax year only Earning in both tax years Not earning Source: ONS analysis of HESA student records linked to HMRC PAYE annual income data % n= 2,000 n= 3,000 n= 1,000 n= 2,000 n= <500 n=2,000 n=7,000 n=16,000 n=3,000 EU8 nationals were the most likely to be in employment whilst studying in England and Wales Source: ONS analysis of HESA student records linked to HMRC PAYE annual income data Top 5 EU nationalities in employment whilst studying in the UK (% in employment, n=total cohort size) EU other nationals (Cyprus (Ex, Southern) and Malta) were the least likely to be earning. In contrast, EU8 nationals had a greater percentage (~75%) of working at some point during the two tax years compared to the other EU groupings. Around 60% of both EU15 and EU2 nationals interacted with the PAYE system during the two tax years. The top nationalities, based on the proportion in employment, were Lithuania, Poland and Republic of Ireland. Please note: someone who is a non-UK national could be domiciled in the UK (or vice versa). This may result in potential undercount or overcount of UK and international students in our analysis. See slide 13 for further explanation. EU students by employment status in tax years 2015/16 and 2016/17
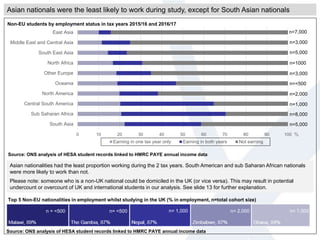
  • 6. 0 10 20 30 40 50 60 70 80 90 100 South Asia Sub Saharan Africa Central South America North America Oceania Other Europe North Africa South East Asia Middle East and Central Asia East Asia Earning in one tax year only Earning in both years Not earning % Non-EU students by employment status in tax years 2015/16 and 2016/17 n = <500 n= <500 n= 1,000 n= 2,000 n= 1,000 Source: ONS analysis of HESA student records linked to HMRC PAYE annual income data Asian nationals were the least likely to work during study, except for South Asian nationals n=7,000 n=3,000 n=5,000 n=1000 n=3,000 n=<500 n=2,000 n=1,000 n=8,000 n=5,000 Source: ONS analysis of HESA student records linked to HMRC PAYE annual income data Asian nationalities had the least proportion working during the 2 tax years. South American and sub Saharan African nationals were more likely to work than not. Please note: someone who is a non-UK national could be domiciled in the UK (or vice versa). This may result in potential undercount or overcount of UK and international students in our analysis. See slide 13 for further explanation. Top 5 Non-EU nationalities in employment whilst studying in the UK (% in employment, n=total cohort size)
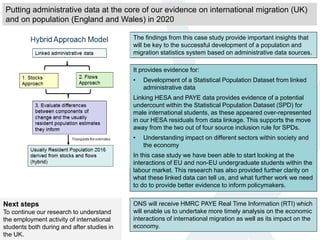
  • 7. Putting administrative data at the core of our evidence on international migration (UK) and on population (England and Wales) in 2020 It provides evidence for: • Development of a Statistical Population Dataset from linked administrative data Linking HESA and PAYE data provides evidence of a potential undercount within the Statistical Population Dataset (SPD) for male international students, as these appeared over-represented in our HESA residuals from data linkage. This supports the move away from the two out of four source inclusion rule for SPDs. • Understanding impact on different sectors within society and the economy In this case study we have been able to start looking at the interactions of EU and non-EU undergraduate students within the labour market. This research has also provided further clarity on what these linked data can tell us, and what further work we need to do to provide better evidence to inform policymakers. ONS will receive HMRC PAYE Real Time Information (RTI) which will enable us to undertake more timely analysis on the economic interactions of international migration as well as its impact on the economy. The findings from this case study provide important insights that will be key to the successful development of a population and migration statistics system based on administrative data sources. Next steps To continue our research to understand the employment activity of international students both during and after studies in the UK.
  • 8. Covered in this research? Yes No Geographical coverage Government funded HEIs in England and Wales Other Government funded HEIs in the UK Student characteristics Undergraduates (not first or last course year) Undergraduates (all years), Postgraduates, Distinguish between part and full time study Employment sector Employment processed through PAYE Self-employed processed through the self assessment forms Completing the picture 1. Extending this research to complete the picture, including the other groups (as described above) and information on travel patterns and tuition fees paid by international students. Following this, we plan to explore further the reasons why international students do not work during their UK studies. 2. Utilising more granular data from HMRC PAYE Real Time Information (RTI), we will look to extend our investigation by considering income amounts and more detailed patterns of employment and signs of activity. This would allow for a better understanding of the when international migrants work within their studies and the impact that this has on the economy. 3. Bring together this analysis with previous research on employment after UK study. From this we plan to explore the association between degree course subject and employment sector during and after study. Next steps
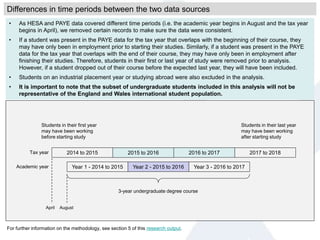
  • 9. 2014 to 2015 2015 to 2016 2016 to 2017 Year 1 - 2014 to 2015 Year 2 - 2015 to 2016 Year 3 - 2016 to 2017 2017 to 2018Tax year Academic year Students in their first year may have been working before starting study Students in their last year may have been working after starting study 3-year undergraduate degree course April August For further information on the methodology, see section 5 of this research output. • As HESA and PAYE data covered different time periods (i.e. the academic year begins in August and the tax year begins in April), we removed certain records to make sure the data were consistent. • If a student was present in the PAYE data for the tax year that overlaps with the beginning of their course, they may have only been in employment prior to starting their studies. Similarly, if a student was present in the PAYE data for the tax year that overlaps with the end of their course, they may have only been in employment after finishing their studies. Therefore, students in their first or last year of study were removed prior to analysis. However, if a student dropped out of their course before the expected last year, they will have been included. • Students on an industrial placement year or studying abroad were also excluded in the analysis. • It is important to note that the subset of undergraduate students included in this analysis will not be representative of the England and Wales international student population. Differences in time periods between the two data sources
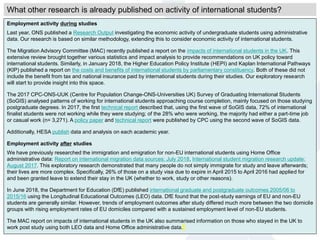
  • 10. Employment activity during studies Last year, ONS published a Research Output investigating the economic activity of undergraduate students using administrative data. Our research is based on similar methodology, extending this to consider economic activity of international students. The Migration Advisory Committee (MAC) recently published a report on the impacts of international students in the UK. This extensive review brought together various statistics and impact analysis to provide recommendations on UK policy toward international students. Similarly, in January 2018, the Higher Education Policy Institute (HEPI) and Kaplan International Pathways (KIP) published a report on the costs and benefits of international students by parliamentary constituency. Both of these did not include the benefit from tax and national insurance paid by international students during their studies. Our exploratory research will start to provide insight into this space. The 2017 CPC-ONS-UUK (Centre for Population Change-ONS-Universities UK) Survey of Graduating International Students (SoGIS) analysed patterns of working for international students approaching course completion, mainly focused on those studying postgraduate degrees. In 2017, the first technical report described that, using the first wave of SoGIS data, 72% of international finalist students were not working while they were studying; of the 28% who were working, the majority had either a part-time job or casual work (n= 3,271). A policy paper and technical report were published by CPC using the second wave of SoGIS data. Additionally, HESA publish data and analysis on each academic year. Employment activity after studies We have previously researched the immigration and emigration for non-EU international students using Home Office administrative data: Report on international migration data sources: July 2018, International student migration research update: August 2017. This exploratory research demonstrated that many people do not simply immigrate for study and leave afterwards; their lives are more complex. Specifically, 26% of those on a study visa due to expire in April 2015 to April 2016 had applied for and been granted leave to extend their stay in the UK (whether to work, study or other reasons). In June 2018, the Department for Education (DfE) published international graduate and postgraduate outcomes 2005/06 to 2015/16 using the Longitudinal Educational Outcomes (LEO) data. DfE found that the post-study earnings of EU and non-EU students are generally similar. However, trends of employment outcomes after study differed much more between the two domicile groups with rising employment rates of EU domiciles compared with a sustained employment level of non-EU students. The MAC report on impacts of international students in the UK also summarised information on those who stayed in the UK to work post study using both LEO data and Home Office administrative data. What other research is already published on activity of international students?
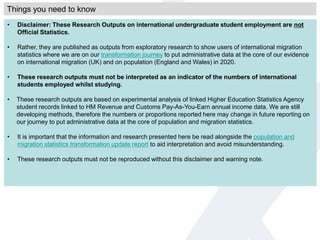
  • 11. • Disclaimer: These Research Outputs on international undergraduate student employment are not Official Statistics. • Rather, they are published as outputs from exploratory research to show users of international migration statistics where we are on our transformation journey to put administrative data at the core of our evidence on international migration (UK) and on population (England and Wales) in 2020. • These research outputs must not be interpreted as an indicator of the numbers of international students employed whilst studying. • These research outputs are based on experimental analysis of linked Higher Education Statistics Agency student records linked to HM Revenue and Customs Pay-As-You-Earn annual income data. We are still developing methods, therefore the numbers or proportions reported here may change in future reporting on our journey to put administrative data at the core of population and migration statistics. • It is important that the information and research presented here be read alongside the population and migration statistics transformation update report to aid interpretation and avoid misunderstanding. • These research outputs must not be reproduced without this disclaimer and warning note. Things you need to know
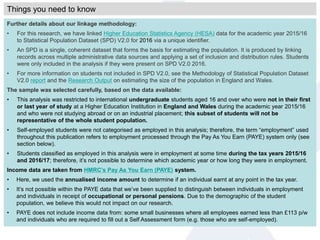
  • 12. Further details about our linkage methodology: • For this research, we have linked Higher Education Statistics Agency (HESA) data for the academic year 2015/16 to Statistical Population Dataset (SPD) V2.0 for 2016 via a unique identifier. • An SPD is a single, coherent dataset that forms the basis for estimating the population. It is produced by linking records across multiple administrative data sources and applying a set of inclusion and distribution rules. Students were only included in the analysis if they were present on SPD V2.0 2016. • For more information on students not included in SPD V2.0, see the Methodology of Statistical Population Dataset V2.0 report and the Research Output on estimating the size of the population in England and Wales. The sample was selected carefully, based on the data available: • This analysis was restricted to international undergraduate students aged 16 and over who were not in their first or last year of study at a Higher Education Institution in England and Wales during the academic year 2015/16 and who were not studying abroad or on an industrial placement; this subset of students will not be representative of the whole student population. • Self-employed students were not categorised as employed in this analysis; therefore, the term “employment” used throughout this publication refers to employment processed through the Pay As You Earn (PAYE) system only (see section below). • Students classified as employed in this analysis were in employment at some time during the tax years 2015/16 and 2016/17; therefore, it’s not possible to determine which academic year or how long they were in employment. Income data are taken from HMRC’s Pay As You Earn (PAYE) system. • Here, we used the annualised income amount to determine if an individual earnt at any point in the tax year. • It’s not possible within the PAYE data that we’ve been supplied to distinguish between individuals in employment and individuals in receipt of occupational or personal pensions. Due to the demographic of the student population, we believe this would not impact on our research. • PAYE does not include income data from: some small businesses where all employees earned less than £113 p/w and individuals who are required to fill out a Self Assessment form (e.g. those who are self-employed). Things you need to know
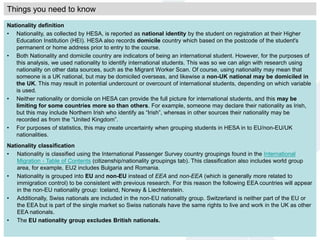
  • 13. Nationality definition • Nationality, as collected by HESA, is reported as national identity by the student on registration at their Higher Education Institution (HEI). HESA also records domicile country which based on the postcode of the student's permanent or home address prior to entry to the course. • Both Nationality and domicile country are indicators of being an international student. However, for the purposes of this analysis, we used nationality to identify international students. This was so we can align with research using nationality on other data sources, such as the Migrant Worker Scan. Of course, using nationality may mean that someone is a UK national, but may be domiciled overseas, and likewise a non-UK national may be domiciled in the UK. This may result in potential undercount or overcount of international students, depending on which variable is used. • Neither nationality or domicile on HESA can provide the full picture for international students, and this may be limiting for some countries more so than others. For example, someone may declare their nationality as Irish, but this may include Northern Irish who identify as “Irish”, whereas in other sources their nationality may be recorded as from the “United Kingdom”. • For purposes of statistics, this may create uncertainty when grouping students in HESA in to EU/non-EU/UK nationalities. Nationality classification • Nationality is classified using the International Passenger Survey country groupings found in the International Migration - Table of Contents (citizenship/nationality groupings tab). This classification also includes world group area, for example, EU2 includes Bulgaria and Romania. • Nationality is grouped into EU and non-EU instead of EEA and non-EEA (which is generally more related to immigration control) to be consistent with previous research. For this reason the following EEA countries will appear in the non-EU nationality group: Iceland, Norway & Liechtenstein. • Additionally, Swiss nationals are included in the non-EU nationality group. Switzerland is neither part of the EU or the EEA but is part of the single market so Swiss nationals have the same rights to live and work in the UK as other EEA nationals. • The EU nationality group excludes British nationals. Things you need to know
  • 14. Contact Us We would welcome your feedback on the exploratory research presented here. Please get in touch at: Email: pop.info@ons.gov.uk Tel: 01329 444661
  • 15. Further Links Go back to: An update on our population and migration statistics transformation journey: A research engagement report Explore our other case studies on SlideShare Transforming population and migration statistics: Administrative data-based population stocks and flows Transforming population and migration statistics: Emigration patterns of non-EU students Transforming population and migration statistics: Benefits and income activity patterns Transforming population and migration statistics: NINo and NHS registration lags Transforming population and migration statistics: Patterns of circular movement into the UK