SlideShare a Scribd company logo
Biostatistics (Part I)
Contents:
• Introduction
• Basic terminology
• Scales of measurement
• Data
• Presentation of data
• Measures of Dispersion
• References
What do STATISTICS mean?
› Statistics or Datum means a
measured or counted fact or piece of
information stated as a figure.
› Statistics is an absolutely
indispensable tool ,providing the
techniques that allow researchers to
draw objective scientific conclusions
Why do we need statistics?
“When you can measure what you are speaking about
and express it in numbers ,you know something about
it. But when you cannot measure and cannot express it
in numbers, your knowledge is of meagre and
unsatisfactory kind”
-LORD KELVIN
Biostatistics
› It is an art and science of collection, compilation, presentation, analysis and logical
interpretation of biological data affected by multiplicity of factors.
› It is the term used when the tools of statistics that emphasizes the statistical
applications in the biomedical and health sciences
› John Graunt-Father of health statistics
› Biostatistics can also be called:-
 Quantitative medicine
 Science of variations
For such studies we need mathematical techniques called as
statistical method
• To read the literature critically, assessing the adequacy
of the research and interpreting the results and conclusions
correctly so that they may properly implement the new
discoveries in diagnosis and treatment – understanding
statistics sufficiently is required.
Intelligent use of current literature
Opens up new path of experimental
procedures
Enables a researcher to collect,
analyse and present data in a
meaningful manner
Basic Terminology
• In most cases, the biomedical and health sciences data consists of observations
of certain characteristics of individual subjects, experimental animals,
chemicals, microbiological, or physical phenomena in laboratories, or
observations of patients, responses to treatment.
• Whenever an experiment or a clinical trial is conducted, measurements are taken
and observations are made.
• Some data are numeric, such as height (5’6”), systolic
B.P. (112mm Hg), and some are non-numeric, such as sex
(female, male) and the patient’s level of pain (no pain,
moderate pain, severe pain).
• To adequately discuss and describe that data, few terms
that will be used repeatedly are defined.
Population
• The collection of all elements of interest having one or more common
characteristics is called a population.
• The elements can be individual subjects, objects, or events.
• The population that contains an infinite number of elements is called an infinite
populations.
• The population that contains an finite number of elements is called an
finite populations.
Variable
• A variable is any characteristic of an object that can be measured or categorized.
• Denoted by an upper case of the alphabet, X, Y, or Z.
E.g.
Age
Sex
Waiting time in clinic
Diabetic levels
Types of variables
Quantitative/
Numerical
Discrete
Continuous
Qualitative /
Categorical
Qualitative Variable:
It is a characteristic of people or objects that cannot be naturally expressed
in a numeric value.
E.g.:
Sex – male, female
Facial type – Brachyfacial, Dolichofacial, Mesiofacial
Level of oral hygiene – poor, fair, good
Quantitative Variable:
It is a characteristic of people or objects that can be naturally expressed
in a numeric value.
E.g.
Age
Height
Bond strength
Discrete Variable:
It is a random variable that can take on a finite number of values or a
countable infinite number (as many as there are whole numbers) of values.
E.g.:
• The size of a family
• The number of DMFT teeth. T can be any one of the 33 numbers,
0,1,2,3,…32.
Continuous Variable:
It is a random variable that can take on a range of values on a continuum, i.e.,
its range is uncountably infinite.
E.g.:
Treatment time
Temperature
Torque value on tightening an implant abutment
Confounding Variable:
The statistical results are said to be confounded when the results can have
more than one explanation.
E.g.: In a study, smoking is the most important etiological factor in the
development of oral squamous cell carcinoma. It has been suggested that
alcohol is one of the major causes of squamous cell carcinoma, and alcohol
consumption is also known to be closely related to smoking. Therefore, in this
study, alcohol is confounding variable.
• Introduction ✔
• Basic terminology✔
• Scales of measurement
• Data
• Presentation of data
• Measures of Dispersion
• References
Nominal Measurement Scale:
It is the simplest type of data, in which the values are in
unordered categories.
E.g.:
• Sex (F, M)
• Blood type (A, B, AB and O)
The categories in a nominal measurement scale have no
quantitative relationship to each other.
Scales Of Measurement:
Ordinal Measurement Scale:
The categories can be ordered or ranked.
The amount of the difference between any two categories, though they
can be ordered, is not quantified.
E.g.:
Pain after separator placement
0 - no pain
1 - mild pain
2 - moderate pain
3 - severe pain
4 - extremely severe pain
Only for statistic convenience
Interval Measurement Scale:
Observations can be ordered, and precise differences between units of
measure exist. However, there is no meaningful absolute zero.
E.g.:
• IQ score representing the level of intelligence.
IQ score 0 is not indicative of no intelligence.
• Statistics knowledge represented by a statistics test score.
The test score zero does not necessarily mean that the
individual has zero knowledge in statistics.
Ratio Measurement Scale:
It is as same as interval scale in every aspect except that measurement
begins at a true or absolute zero.
E.g.:
• Weight in pounds.
• Height in meters.
There cannot be negative measurements.
Observations
• The description of observations:
It includes collecting, summarizing and presenting.
It is also known as Descriptive statistics.
• The inference of observations:
It includes analyzing and interpreting.
It is known as Inferential statistics.
Data
› Whenever an observation is made, it will be recorded and a collective
recording of these observations, either numerical or otherwise is
called DATA
Data
Types of Data
Primary Data
Secondary
data
Qualitative
data
Quantitative
data
Data are a set of values of one or more variables recorded on
one or more individuals.
Primary data:
It is the data obtained directly from an individual.
Advantages
I. Precise information
2. Reliable
Disadvantages
I. Time consuming
Secondary data:
It is obtained from outside sources,
e.g. hospital records, school register.
Quantitative data:
Measure something with a number.
E.g: the amount of crowding, overjet, incisor
inclination, and maxillomandibular skeletal discrepancy.
Qualitative data:
Data is collected on the basis of attribute or qualities.
E.g: The sex of the patient, severity of mandibular plane
angle (high, normal, low), likelihood of compliance with
headgear or elastics (yes/no).
Uses Of Data:
In designing a health care programme.
In evaluating the effectiveness of an
on going program.
In determining the needs of a specific
population. .
In evaluating the scientific accuracy of
a journal article.
Method of collection of
data
Questionnaires Surveys Records Interviews
Need for organising the DATA
› The goal is to summarise and present data in useful ways to
support prompt and effective decisions
Presentation of Data:
Methods of presentation of data
Tabulation Diagrams/graphs
Tabulation
Types of Tables
Simple table Master table
Frequency
distribution table
Guidelines for Tabular Presentation
1. Table must be numbered
2. Title- Brief and self explanatory title should be given
3. The heading of columns and rows must be clear, sufficient, concise and
fully defined
4. The data must be presented according to size of importance
5. Full details of deliberate exclusions in collected series must be given
5. Table should not be too larges
6. Figures needing comparison should be placed as close as possible
7. Arrangement should be vertical
8. Foot notes should be given whenever necessary.
Graphs And Diagrams
Impact on
imagination
Better retained in
memory
Easy
comparisons
Bar Charts
A diagram of columns or bars, the height of the bars determine the value of
the particular data in question.
Simple bar graph
Multiple bar graph
Component bar graph
Pie Charts:
58%
23%
10%
9%
Distribution of Malocclusions in school children
class 1 class 2A class 2B class 3
These are so called because the entire graph looks like a pie
and its components represent slices cut from a pie.
Line Graph:
When the quantity is a continuous variable i.e., time or temperature,
data is plotted as a continuous line.
0
1
2
3
4
5
6
Category 1 Category 2 Category 3 Category 4
Histograms:
• A histogram is a special sort of bar chart.
• The successive groups of data are linked in a definite numerical
order
Haemoglobin levels of Students in a class
Frequency Polygons:
• A frequency distribution may also be represented diagrammatically by the
frequency polygon.
• It is obtained by joining the mid points of the histogram blocks.
Pictograms:
Pictorial or diagrammatical data represented by a pictorial symbol.
USA 50
SINGAPORE 1100
INDIA 3700
BANGLADESH 9700
Population per Physician
• Introduction ✔
• Basic terminology✔
• Scales of measurement ✔
• Data ✔
• Presentation of data ✔
• Measures of Dispersion
• References
Central Tendency / Statistical Averages:
• Central tendency refers to the center of the distribution of data points.
• Statistics/parameters as the
Mean (the arithmetic average)
Median (the middle datum)
Mode (the most frequent score).
Objectives
•To condense the entire mass of data.
•To facilitate comparison.
Mean
• This measure implies the arithmetic average or arithmetic
mean.
• It is obtained by summing up all the observations and
dividing the total by number of observations.
E.g. The following gives you the fasting blood glucose levels of a sample
of 10 children.
1 2 3 4 5 6 7 8 9 10
56 62 63 65 65 65 65 68 70 71
Total Mean = 650 / 10 = 65
Mean is denoted by the sign X (X bar)
Advantages:
Easy to calculate
Easily understood
Utilizes entire data
Affords good comparison
Disadvantages:
Mean is affected by extreme values, In such cases it leads
to bad interpretation.
Median
• In median the data are arranged in an ascending or descending order of magnitude
and the value of middle observation is located.
Arrange them in ascending or descending order.
71,75,75,77,79,81,83,84,90,95.
Median = 79 + 81 / 2 = 80
If there are only 9 observations then median = 79.
Advantages:
1. It is more representative than mean.
2. It does not depend on every observations.
3. It is not affected by extreme values.
Mode
Mode is that value which occurs with the greatest frequency.
A distribution may have more than one mode.
E.g. Diastolic blood pressure of 10 individuals.
85,75,81,79,71,80,75,78,72,73
Here mode = 75 i.e. the distribution is uni-modal
85,75,81,79,80,71,80,78,75,73
Here mode =75 and 80 i.e. the distribution is bi-modal.
Advantages :
1. It eliminates extreme variation.
2. Easy to understand
Disadvantages :
1. In small number of cases there may be no mode at all because
no values may be repeated; therefore it is not used in medical
or biological statistics.
Dispersion
Dispersion is the degree of spread or variation of the variable about a central
value. The measures of dispersion helps us to study the spread of the values
about the central value.
Purpose of Measures of Dispersion
1. To study the variability of data.
2. To determine the reliability of an average.
3. Compare two or more series in relation to their variability.
Methods of
dispersion
The range Mean deviation
Standard
deviation
The Range:
The range is defined as the difference between the highest
and lowest figures in a given sample.
• It is by far the simplest measure of dispersion.
Advantage:
• Easy to calculate
Disadvantages:
• Unstable
• It is affected by one extremely high or low score.
The Mean Deviation:
• It is the average of deviations from the arithmetic mean.
• It is given by,
M.D. =  (X – Xi)
n
Standard Deviation
• The standard deviation is the most frequently used measure of deviation.
• In simple terms it is defined as Root Mean Square deviation because it is
the square root of the variance (average of the squared difference from the
mean)
• It is denoted by the Greek letter  or by the initials
S.D.  = (X – Xi)2
 n
• Greater the S.D. greater will be the magnitude of
dispersion from mean.
• A small S.D. means a higher degree of uniformity of
observations.
The Normal Curve / Normal
Distribution/ Gaussian Distribution
When a data is collected from a very large number of people and a
frequency distribution is made with narrow class intervals , the
resulting curve is smooth and symmetrical and it is called normal
curve.
Standard Normal Curve
• It is bell shaped .
• The curve is perfectly symmetrical based on an infinitely large number of
observations.
• The total area of curve is one, its mean is zero and standard deviation is
one.
• All the three measures of central tendency , the mean,
median and mode coincide
Probability
• Probability is defined as possible or probable chances of occurrence of an event
or happening. Probability is a proportion.
• In tossing a coin, the only possible outcome is a head or a tail. Probability of a
head is 0.5 and tail is 0.5 and the sum is 1.
If the probability is more than 0.05, the difference is called
insignificant and if it is less than (or) equal to 0.05 the difference is
called as significant. This value of P is obtained by calculating
various tests of significance.
P < 0.001 Very highly significant
P < 0.01 Highly significant
P < 0.05 Significant.
P > 0.05 not Significant.
• Introduction ✔
• Basic terminology✔
• Scales of measurement ✔
• Data ✔
• Presentation of data ✔
• Measures of Dispersion ✔
• References
REFERENCES:
•Biostatistics for oral healthcare – Jay S. Kim, Ronald J. Dailey
•Essentials of public health dentistry- Soben Peter
•Park text book of Community Medicine
•Orthodontics: Current principles and techniques. Graber, Vanarsdall,
Vig
59
Biostatistics
Ad

More Related Content

What's hot (20)

Chi – square test
Chi – square testChi – square test
Chi – square test
Dr.M.Prasad Naidu
 
Biostatistics
BiostatisticsBiostatistics
Biostatistics
Dr. Senthilvel Vasudevan
 
Biostatistics (Basic Definitions & Concepts) | SurgicoMed.com
Biostatistics (Basic Definitions & Concepts) | SurgicoMed.comBiostatistics (Basic Definitions & Concepts) | SurgicoMed.com
Biostatistics (Basic Definitions & Concepts) | SurgicoMed.com
Mukhdoom BaharAli
 
biostatstics :Type and presentation of data
biostatstics :Type and presentation of databiostatstics :Type and presentation of data
biostatstics :Type and presentation of data
naresh gill
 
INTRODUCTION TO BIO STATISTICS
INTRODUCTION TO BIO STATISTICS INTRODUCTION TO BIO STATISTICS
INTRODUCTION TO BIO STATISTICS
Meklelle university
 
Regression and corelation (Biostatistics)
Regression and corelation (Biostatistics)Regression and corelation (Biostatistics)
Regression and corelation (Biostatistics)
Muhammadasif909
 
Application of Biostatistics
Application of BiostatisticsApplication of Biostatistics
Application of Biostatistics
Jippy Jack
 
Introduction to biostatistics
Introduction to biostatisticsIntroduction to biostatistics
Introduction to biostatistics
shivamdixit57
 
Correlation
CorrelationCorrelation
Correlation
keerthi samuel
 
statistical analysis
statistical analysisstatistical analysis
statistical analysis
Rakhi Kripa Prince
 
Biostatistics : Types of Variable
Biostatistics : Types of VariableBiostatistics : Types of Variable
Biostatistics : Types of Variable
Tarekk Alazabee
 
Biostatistics lec 1
Biostatistics lec 1Biostatistics lec 1
Biostatistics lec 1
Osmanmohamed38
 
Biostatistics and data analysis
Biostatistics and data analysisBiostatistics and data analysis
Biostatistics and data analysis
David Enoma
 
Statistical Methods in Research
Statistical Methods in ResearchStatistical Methods in Research
Statistical Methods in Research
Manoj Sharma
 
Parametric & non parametric
Parametric & non parametricParametric & non parametric
Parametric & non parametric
ANCYBS
 
Test of significance in Statistics
Test of significance in StatisticsTest of significance in Statistics
Test of significance in Statistics
Vikash Keshri
 
Student's T-Test
Student's T-TestStudent's T-Test
Student's T-Test
COSTARCH Analytical Consulting (P) Ltd.
 
BIOSTATISTICS + EXERCISES
BIOSTATISTICS + EXERCISESBIOSTATISTICS + EXERCISES
BIOSTATISTICS + EXERCISES
MINANI Theobald
 
Correlation Coefficient
Correlation CoefficientCorrelation Coefficient
Correlation Coefficient
SaadSaif6
 
2. Biostatistics types and methods of data collection
2. Biostatistics types and methods of data collection2. Biostatistics types and methods of data collection
2. Biostatistics types and methods of data collection
Sudhakar Khot
 
Biostatistics (Basic Definitions & Concepts) | SurgicoMed.com
Biostatistics (Basic Definitions & Concepts) | SurgicoMed.comBiostatistics (Basic Definitions & Concepts) | SurgicoMed.com
Biostatistics (Basic Definitions & Concepts) | SurgicoMed.com
Mukhdoom BaharAli
 
biostatstics :Type and presentation of data
biostatstics :Type and presentation of databiostatstics :Type and presentation of data
biostatstics :Type and presentation of data
naresh gill
 
Regression and corelation (Biostatistics)
Regression and corelation (Biostatistics)Regression and corelation (Biostatistics)
Regression and corelation (Biostatistics)
Muhammadasif909
 
Application of Biostatistics
Application of BiostatisticsApplication of Biostatistics
Application of Biostatistics
Jippy Jack
 
Introduction to biostatistics
Introduction to biostatisticsIntroduction to biostatistics
Introduction to biostatistics
shivamdixit57
 
Biostatistics : Types of Variable
Biostatistics : Types of VariableBiostatistics : Types of Variable
Biostatistics : Types of Variable
Tarekk Alazabee
 
Biostatistics and data analysis
Biostatistics and data analysisBiostatistics and data analysis
Biostatistics and data analysis
David Enoma
 
Statistical Methods in Research
Statistical Methods in ResearchStatistical Methods in Research
Statistical Methods in Research
Manoj Sharma
 
Parametric & non parametric
Parametric & non parametricParametric & non parametric
Parametric & non parametric
ANCYBS
 
Test of significance in Statistics
Test of significance in StatisticsTest of significance in Statistics
Test of significance in Statistics
Vikash Keshri
 
BIOSTATISTICS + EXERCISES
BIOSTATISTICS + EXERCISESBIOSTATISTICS + EXERCISES
BIOSTATISTICS + EXERCISES
MINANI Theobald
 
Correlation Coefficient
Correlation CoefficientCorrelation Coefficient
Correlation Coefficient
SaadSaif6
 
2. Biostatistics types and methods of data collection
2. Biostatistics types and methods of data collection2. Biostatistics types and methods of data collection
2. Biostatistics types and methods of data collection
Sudhakar Khot
 

Similar to Biostatistics (20)

Biostatistics ppt itroductionchapter 1.pptx
Biostatistics ppt itroductionchapter 1.pptxBiostatistics ppt itroductionchapter 1.pptx
Biostatistics ppt itroductionchapter 1.pptx
jkmrz2302
 
Lect 1_Biostat.pdf
Lect 1_Biostat.pdfLect 1_Biostat.pdf
Lect 1_Biostat.pdf
BirhanTesema
 
Data Display and Summary
Data Display and SummaryData Display and Summary
Data Display and Summary
DrZahid Khan
 
Biostatistics
BiostatisticsBiostatistics
Biostatistics
khushbu mishra
 
Biostatistics khushbu
Biostatistics khushbuBiostatistics khushbu
Biostatistics khushbu
khushbu mishra
 
Introduction to statistics.pptx
Introduction to statistics.pptxIntroduction to statistics.pptx
Introduction to statistics.pptx
MuddaAbdo1
 
1. Biost. Introduction(2).ppt
1.  Biost.             Introduction(2).ppt1.  Biost.             Introduction(2).ppt
1. Biost. Introduction(2).ppt
muktarkedir459
 
Medical Statistics.ppt
Medical Statistics.pptMedical Statistics.ppt
Medical Statistics.ppt
ssuserf0d95a
 
Basic Statistics, Biostatistics, and Frequency Distribution
Basic Statistics, Biostatistics, and Frequency DistributionBasic Statistics, Biostatistics, and Frequency Distribution
Basic Statistics, Biostatistics, and Frequency Distribution
Gaurav Patil
 
Biostatistics notes for Masters in Public Health
Biostatistics notes for Masters in Public HealthBiostatistics notes for Masters in Public Health
Biostatistics notes for Masters in Public Health
PituaIvaan1
 
Introduction to Statistics in Nursing.
Introduction to Statistics in Nursing.Introduction to Statistics in Nursing.
Introduction to Statistics in Nursing.
Johny Kutty Joseph
 
Final Lecture - 1.ppt
Final Lecture - 1.pptFinal Lecture - 1.ppt
Final Lecture - 1.ppt
ssuserbe1d97
 
Understanding statistics in research
Understanding statistics in researchUnderstanding statistics in research
Understanding statistics in research
Dr. Senthilvel Vasudevan
 
statistics introduction.ppt
statistics introduction.pptstatistics introduction.ppt
statistics introduction.ppt
CHANDAN PADHAN
 
Lecture lecture lecture lecture lecturen
Lecture lecture lecture lecture lecturenLecture lecture lecture lecture lecturen
Lecture lecture lecture lecture lecturen
zaeme05
 
Epidemiolgy and biostatistics notes
Epidemiolgy and biostatistics notesEpidemiolgy and biostatistics notes
Epidemiolgy and biostatistics notes
Charles Ntwale
 
Statistics.pdf.pdf for Research Physiotherapy and Occupational Therapy
Statistics.pdf.pdf for Research Physiotherapy and Occupational TherapyStatistics.pdf.pdf for Research Physiotherapy and Occupational Therapy
Statistics.pdf.pdf for Research Physiotherapy and Occupational Therapy
SakhileKhoza2
 
Basic of Biostatisticsin the field of healthcare research.pptx
Basic of Biostatisticsin the field of healthcare research.pptxBasic of Biostatisticsin the field of healthcare research.pptx
Basic of Biostatisticsin the field of healthcare research.pptx
ZainyKhan9
 
Biostatistics.pptxhgjfhgfthfujkolikhgjhcghd
Biostatistics.pptxhgjfhgfthfujkolikhgjhcghdBiostatistics.pptxhgjfhgfthfujkolikhgjhcghd
Biostatistics.pptxhgjfhgfthfujkolikhgjhcghd
madanshresthanepal
 
Introduction to basics of bio statistics.
Introduction to basics of bio statistics.Introduction to basics of bio statistics.
Introduction to basics of bio statistics.
AB Rajar
 
Biostatistics ppt itroductionchapter 1.pptx
Biostatistics ppt itroductionchapter 1.pptxBiostatistics ppt itroductionchapter 1.pptx
Biostatistics ppt itroductionchapter 1.pptx
jkmrz2302
 
Lect 1_Biostat.pdf
Lect 1_Biostat.pdfLect 1_Biostat.pdf
Lect 1_Biostat.pdf
BirhanTesema
 
Data Display and Summary
Data Display and SummaryData Display and Summary
Data Display and Summary
DrZahid Khan
 
Introduction to statistics.pptx
Introduction to statistics.pptxIntroduction to statistics.pptx
Introduction to statistics.pptx
MuddaAbdo1
 
1. Biost. Introduction(2).ppt
1.  Biost.             Introduction(2).ppt1.  Biost.             Introduction(2).ppt
1. Biost. Introduction(2).ppt
muktarkedir459
 
Medical Statistics.ppt
Medical Statistics.pptMedical Statistics.ppt
Medical Statistics.ppt
ssuserf0d95a
 
Basic Statistics, Biostatistics, and Frequency Distribution
Basic Statistics, Biostatistics, and Frequency DistributionBasic Statistics, Biostatistics, and Frequency Distribution
Basic Statistics, Biostatistics, and Frequency Distribution
Gaurav Patil
 
Biostatistics notes for Masters in Public Health
Biostatistics notes for Masters in Public HealthBiostatistics notes for Masters in Public Health
Biostatistics notes for Masters in Public Health
PituaIvaan1
 
Introduction to Statistics in Nursing.
Introduction to Statistics in Nursing.Introduction to Statistics in Nursing.
Introduction to Statistics in Nursing.
Johny Kutty Joseph
 
Final Lecture - 1.ppt
Final Lecture - 1.pptFinal Lecture - 1.ppt
Final Lecture - 1.ppt
ssuserbe1d97
 
statistics introduction.ppt
statistics introduction.pptstatistics introduction.ppt
statistics introduction.ppt
CHANDAN PADHAN
 
Lecture lecture lecture lecture lecturen
Lecture lecture lecture lecture lecturenLecture lecture lecture lecture lecturen
Lecture lecture lecture lecture lecturen
zaeme05
 
Epidemiolgy and biostatistics notes
Epidemiolgy and biostatistics notesEpidemiolgy and biostatistics notes
Epidemiolgy and biostatistics notes
Charles Ntwale
 
Statistics.pdf.pdf for Research Physiotherapy and Occupational Therapy
Statistics.pdf.pdf for Research Physiotherapy and Occupational TherapyStatistics.pdf.pdf for Research Physiotherapy and Occupational Therapy
Statistics.pdf.pdf for Research Physiotherapy and Occupational Therapy
SakhileKhoza2
 
Basic of Biostatisticsin the field of healthcare research.pptx
Basic of Biostatisticsin the field of healthcare research.pptxBasic of Biostatisticsin the field of healthcare research.pptx
Basic of Biostatisticsin the field of healthcare research.pptx
ZainyKhan9
 
Biostatistics.pptxhgjfhgfthfujkolikhgjhcghd
Biostatistics.pptxhgjfhgfthfujkolikhgjhcghdBiostatistics.pptxhgjfhgfthfujkolikhgjhcghd
Biostatistics.pptxhgjfhgfthfujkolikhgjhcghd
madanshresthanepal
 
Introduction to basics of bio statistics.
Introduction to basics of bio statistics.Introduction to basics of bio statistics.
Introduction to basics of bio statistics.
AB Rajar
 
Ad

Recently uploaded (20)

Rock Art As a Source of Ancient Indian History
Rock Art As a Source of Ancient Indian HistoryRock Art As a Source of Ancient Indian History
Rock Art As a Source of Ancient Indian History
Virag Sontakke
 
APGAR SCORE BY sweety Tamanna Mahapatra MSc Pediatric
APGAR SCORE  BY sweety Tamanna Mahapatra MSc PediatricAPGAR SCORE  BY sweety Tamanna Mahapatra MSc Pediatric
APGAR SCORE BY sweety Tamanna Mahapatra MSc Pediatric
SweetytamannaMohapat
 
How to Create A Todo List In Todo of Odoo 18
How to Create A Todo List In Todo of Odoo 18How to Create A Todo List In Todo of Odoo 18
How to Create A Todo List In Todo of Odoo 18
Celine George
 
Grade 3 - English - Printable Worksheet (PDF Format)
Grade 3 - English - Printable Worksheet  (PDF Format)Grade 3 - English - Printable Worksheet  (PDF Format)
Grade 3 - English - Printable Worksheet (PDF Format)
Sritoma Majumder
 
03#UNTAGGED. Generosity in architecture.
03#UNTAGGED. Generosity in architecture.03#UNTAGGED. Generosity in architecture.
03#UNTAGGED. Generosity in architecture.
MCH
 
Herbs Used in Cosmetic Formulations .pptx
Herbs Used in Cosmetic Formulations .pptxHerbs Used in Cosmetic Formulations .pptx
Herbs Used in Cosmetic Formulations .pptx
RAJU THENGE
 
SCI BIZ TECH QUIZ (OPEN) PRELIMS XTASY 2025.pptx
SCI BIZ TECH QUIZ (OPEN) PRELIMS XTASY 2025.pptxSCI BIZ TECH QUIZ (OPEN) PRELIMS XTASY 2025.pptx
SCI BIZ TECH QUIZ (OPEN) PRELIMS XTASY 2025.pptx
Ronisha Das
 
YSPH VMOC Special Report - Measles Outbreak Southwest US 5-3-2025.pptx
YSPH VMOC Special Report - Measles Outbreak  Southwest US 5-3-2025.pptxYSPH VMOC Special Report - Measles Outbreak  Southwest US 5-3-2025.pptx
YSPH VMOC Special Report - Measles Outbreak Southwest US 5-3-2025.pptx
Yale School of Public Health - The Virtual Medical Operations Center (VMOC)
 
Cultivation Practice of Garlic in Nepal.pptx
Cultivation Practice of Garlic in Nepal.pptxCultivation Practice of Garlic in Nepal.pptx
Cultivation Practice of Garlic in Nepal.pptx
UmeshTimilsina1
 
How to Add Customer Note in Odoo 18 POS - Odoo Slides
How to Add Customer Note in Odoo 18 POS - Odoo SlidesHow to Add Customer Note in Odoo 18 POS - Odoo Slides
How to Add Customer Note in Odoo 18 POS - Odoo Slides
Celine George
 
How to Manage Upselling in Odoo 18 Sales
How to Manage Upselling in Odoo 18 SalesHow to Manage Upselling in Odoo 18 Sales
How to Manage Upselling in Odoo 18 Sales
Celine George
 
Tax evasion, Tax planning & Tax avoidance.pptx
Tax evasion, Tax  planning &  Tax avoidance.pptxTax evasion, Tax  planning &  Tax avoidance.pptx
Tax evasion, Tax planning & Tax avoidance.pptx
manishbaidya2017
 
Lecture 2 CLASSIFICATION OF PHYLUM ARTHROPODA UPTO CLASSES & POSITION OF_1.pptx
Lecture 2 CLASSIFICATION OF PHYLUM ARTHROPODA UPTO CLASSES & POSITION OF_1.pptxLecture 2 CLASSIFICATION OF PHYLUM ARTHROPODA UPTO CLASSES & POSITION OF_1.pptx
Lecture 2 CLASSIFICATION OF PHYLUM ARTHROPODA UPTO CLASSES & POSITION OF_1.pptx
Arshad Shaikh
 
Kenan Fellows Participants, Projects 2025-26 Cohort
Kenan Fellows Participants, Projects 2025-26 CohortKenan Fellows Participants, Projects 2025-26 Cohort
Kenan Fellows Participants, Projects 2025-26 Cohort
EducationNC
 
spinal cord disorders (Myelopathies and radiculoapthies)
spinal cord disorders (Myelopathies and radiculoapthies)spinal cord disorders (Myelopathies and radiculoapthies)
spinal cord disorders (Myelopathies and radiculoapthies)
Mohamed Rizk Khodair
 
Ancient Stone Sculptures of India: As a Source of Indian History
Ancient Stone Sculptures of India: As a Source of Indian HistoryAncient Stone Sculptures of India: As a Source of Indian History
Ancient Stone Sculptures of India: As a Source of Indian History
Virag Sontakke
 
Grade 2 - Mathematics - Printable Worksheet
Grade 2 - Mathematics - Printable WorksheetGrade 2 - Mathematics - Printable Worksheet
Grade 2 - Mathematics - Printable Worksheet
Sritoma Majumder
 
Myopathies (muscle disorders) for undergraduate
Myopathies (muscle disorders) for undergraduateMyopathies (muscle disorders) for undergraduate
Myopathies (muscle disorders) for undergraduate
Mohamed Rizk Khodair
 
Biophysics Chapter 3 Methods of Studying Macromolecules.pdf
Biophysics Chapter 3 Methods of Studying Macromolecules.pdfBiophysics Chapter 3 Methods of Studying Macromolecules.pdf
Biophysics Chapter 3 Methods of Studying Macromolecules.pdf
PKLI-Institute of Nursing and Allied Health Sciences Lahore , Pakistan.
 
Form View Attributes in Odoo 18 - Odoo Slides
Form View Attributes in Odoo 18 - Odoo SlidesForm View Attributes in Odoo 18 - Odoo Slides
Form View Attributes in Odoo 18 - Odoo Slides
Celine George
 
Rock Art As a Source of Ancient Indian History
Rock Art As a Source of Ancient Indian HistoryRock Art As a Source of Ancient Indian History
Rock Art As a Source of Ancient Indian History
Virag Sontakke
 
APGAR SCORE BY sweety Tamanna Mahapatra MSc Pediatric
APGAR SCORE  BY sweety Tamanna Mahapatra MSc PediatricAPGAR SCORE  BY sweety Tamanna Mahapatra MSc Pediatric
APGAR SCORE BY sweety Tamanna Mahapatra MSc Pediatric
SweetytamannaMohapat
 
How to Create A Todo List In Todo of Odoo 18
How to Create A Todo List In Todo of Odoo 18How to Create A Todo List In Todo of Odoo 18
How to Create A Todo List In Todo of Odoo 18
Celine George
 
Grade 3 - English - Printable Worksheet (PDF Format)
Grade 3 - English - Printable Worksheet  (PDF Format)Grade 3 - English - Printable Worksheet  (PDF Format)
Grade 3 - English - Printable Worksheet (PDF Format)
Sritoma Majumder
 
03#UNTAGGED. Generosity in architecture.
03#UNTAGGED. Generosity in architecture.03#UNTAGGED. Generosity in architecture.
03#UNTAGGED. Generosity in architecture.
MCH
 
Herbs Used in Cosmetic Formulations .pptx
Herbs Used in Cosmetic Formulations .pptxHerbs Used in Cosmetic Formulations .pptx
Herbs Used in Cosmetic Formulations .pptx
RAJU THENGE
 
SCI BIZ TECH QUIZ (OPEN) PRELIMS XTASY 2025.pptx
SCI BIZ TECH QUIZ (OPEN) PRELIMS XTASY 2025.pptxSCI BIZ TECH QUIZ (OPEN) PRELIMS XTASY 2025.pptx
SCI BIZ TECH QUIZ (OPEN) PRELIMS XTASY 2025.pptx
Ronisha Das
 
Cultivation Practice of Garlic in Nepal.pptx
Cultivation Practice of Garlic in Nepal.pptxCultivation Practice of Garlic in Nepal.pptx
Cultivation Practice of Garlic in Nepal.pptx
UmeshTimilsina1
 
How to Add Customer Note in Odoo 18 POS - Odoo Slides
How to Add Customer Note in Odoo 18 POS - Odoo SlidesHow to Add Customer Note in Odoo 18 POS - Odoo Slides
How to Add Customer Note in Odoo 18 POS - Odoo Slides
Celine George
 
How to Manage Upselling in Odoo 18 Sales
How to Manage Upselling in Odoo 18 SalesHow to Manage Upselling in Odoo 18 Sales
How to Manage Upselling in Odoo 18 Sales
Celine George
 
Tax evasion, Tax planning & Tax avoidance.pptx
Tax evasion, Tax  planning &  Tax avoidance.pptxTax evasion, Tax  planning &  Tax avoidance.pptx
Tax evasion, Tax planning & Tax avoidance.pptx
manishbaidya2017
 
Lecture 2 CLASSIFICATION OF PHYLUM ARTHROPODA UPTO CLASSES & POSITION OF_1.pptx
Lecture 2 CLASSIFICATION OF PHYLUM ARTHROPODA UPTO CLASSES & POSITION OF_1.pptxLecture 2 CLASSIFICATION OF PHYLUM ARTHROPODA UPTO CLASSES & POSITION OF_1.pptx
Lecture 2 CLASSIFICATION OF PHYLUM ARTHROPODA UPTO CLASSES & POSITION OF_1.pptx
Arshad Shaikh
 
Kenan Fellows Participants, Projects 2025-26 Cohort
Kenan Fellows Participants, Projects 2025-26 CohortKenan Fellows Participants, Projects 2025-26 Cohort
Kenan Fellows Participants, Projects 2025-26 Cohort
EducationNC
 
spinal cord disorders (Myelopathies and radiculoapthies)
spinal cord disorders (Myelopathies and radiculoapthies)spinal cord disorders (Myelopathies and radiculoapthies)
spinal cord disorders (Myelopathies and radiculoapthies)
Mohamed Rizk Khodair
 
Ancient Stone Sculptures of India: As a Source of Indian History
Ancient Stone Sculptures of India: As a Source of Indian HistoryAncient Stone Sculptures of India: As a Source of Indian History
Ancient Stone Sculptures of India: As a Source of Indian History
Virag Sontakke
 
Grade 2 - Mathematics - Printable Worksheet
Grade 2 - Mathematics - Printable WorksheetGrade 2 - Mathematics - Printable Worksheet
Grade 2 - Mathematics - Printable Worksheet
Sritoma Majumder
 
Myopathies (muscle disorders) for undergraduate
Myopathies (muscle disorders) for undergraduateMyopathies (muscle disorders) for undergraduate
Myopathies (muscle disorders) for undergraduate
Mohamed Rizk Khodair
 
Form View Attributes in Odoo 18 - Odoo Slides
Form View Attributes in Odoo 18 - Odoo SlidesForm View Attributes in Odoo 18 - Odoo Slides
Form View Attributes in Odoo 18 - Odoo Slides
Celine George
 
Ad

Biostatistics

  • 2. Contents: • Introduction • Basic terminology • Scales of measurement • Data • Presentation of data • Measures of Dispersion • References
  • 3. What do STATISTICS mean? › Statistics or Datum means a measured or counted fact or piece of information stated as a figure. › Statistics is an absolutely indispensable tool ,providing the techniques that allow researchers to draw objective scientific conclusions
  • 4. Why do we need statistics? “When you can measure what you are speaking about and express it in numbers ,you know something about it. But when you cannot measure and cannot express it in numbers, your knowledge is of meagre and unsatisfactory kind” -LORD KELVIN
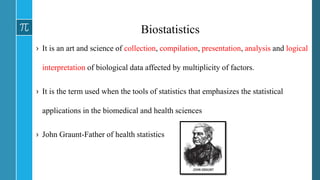
  • 5. Biostatistics › It is an art and science of collection, compilation, presentation, analysis and logical interpretation of biological data affected by multiplicity of factors. › It is the term used when the tools of statistics that emphasizes the statistical applications in the biomedical and health sciences › John Graunt-Father of health statistics
  • 6. › Biostatistics can also be called:-  Quantitative medicine  Science of variations For such studies we need mathematical techniques called as statistical method
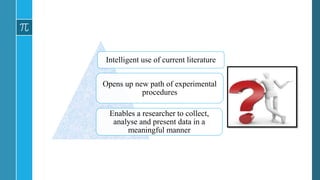
  • 7. • To read the literature critically, assessing the adequacy of the research and interpreting the results and conclusions correctly so that they may properly implement the new discoveries in diagnosis and treatment – understanding statistics sufficiently is required. Intelligent use of current literature Opens up new path of experimental procedures Enables a researcher to collect, analyse and present data in a meaningful manner
  • 8. Basic Terminology • In most cases, the biomedical and health sciences data consists of observations of certain characteristics of individual subjects, experimental animals, chemicals, microbiological, or physical phenomena in laboratories, or observations of patients, responses to treatment. • Whenever an experiment or a clinical trial is conducted, measurements are taken and observations are made.
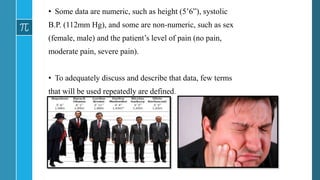
  • 9. • Some data are numeric, such as height (5’6”), systolic B.P. (112mm Hg), and some are non-numeric, such as sex (female, male) and the patient’s level of pain (no pain, moderate pain, severe pain). • To adequately discuss and describe that data, few terms that will be used repeatedly are defined.
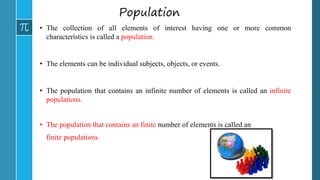
  • 10. Population • The collection of all elements of interest having one or more common characteristics is called a population. • The elements can be individual subjects, objects, or events. • The population that contains an infinite number of elements is called an infinite populations. • The population that contains an finite number of elements is called an finite populations.
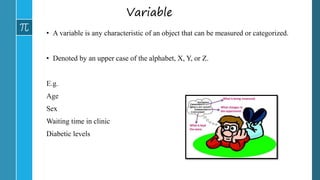
  • 11. Variable • A variable is any characteristic of an object that can be measured or categorized. • Denoted by an upper case of the alphabet, X, Y, or Z. E.g. Age Sex Waiting time in clinic Diabetic levels
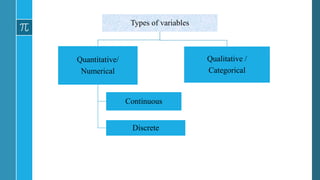
  • 13. Qualitative Variable: It is a characteristic of people or objects that cannot be naturally expressed in a numeric value. E.g.: Sex – male, female Facial type – Brachyfacial, Dolichofacial, Mesiofacial Level of oral hygiene – poor, fair, good
  • 14. Quantitative Variable: It is a characteristic of people or objects that can be naturally expressed in a numeric value. E.g. Age Height Bond strength
  • 15. Discrete Variable: It is a random variable that can take on a finite number of values or a countable infinite number (as many as there are whole numbers) of values. E.g.: • The size of a family • The number of DMFT teeth. T can be any one of the 33 numbers, 0,1,2,3,…32.
  • 16. Continuous Variable: It is a random variable that can take on a range of values on a continuum, i.e., its range is uncountably infinite. E.g.: Treatment time Temperature Torque value on tightening an implant abutment
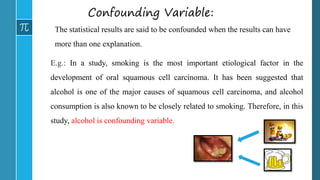
  • 17. Confounding Variable: The statistical results are said to be confounded when the results can have more than one explanation. E.g.: In a study, smoking is the most important etiological factor in the development of oral squamous cell carcinoma. It has been suggested that alcohol is one of the major causes of squamous cell carcinoma, and alcohol consumption is also known to be closely related to smoking. Therefore, in this study, alcohol is confounding variable.
  • 18. • Introduction ✔ • Basic terminology✔ • Scales of measurement • Data • Presentation of data • Measures of Dispersion • References
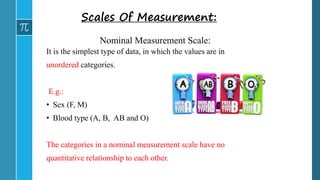
  • 19. Nominal Measurement Scale: It is the simplest type of data, in which the values are in unordered categories. E.g.: • Sex (F, M) • Blood type (A, B, AB and O) The categories in a nominal measurement scale have no quantitative relationship to each other. Scales Of Measurement:
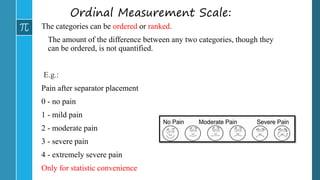
  • 20. Ordinal Measurement Scale: The categories can be ordered or ranked. The amount of the difference between any two categories, though they can be ordered, is not quantified. E.g.: Pain after separator placement 0 - no pain 1 - mild pain 2 - moderate pain 3 - severe pain 4 - extremely severe pain Only for statistic convenience
  • 21. Interval Measurement Scale: Observations can be ordered, and precise differences between units of measure exist. However, there is no meaningful absolute zero. E.g.: • IQ score representing the level of intelligence. IQ score 0 is not indicative of no intelligence. • Statistics knowledge represented by a statistics test score. The test score zero does not necessarily mean that the individual has zero knowledge in statistics.
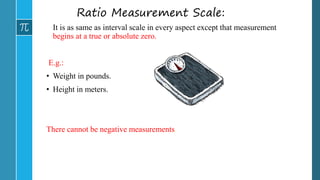
  • 22. Ratio Measurement Scale: It is as same as interval scale in every aspect except that measurement begins at a true or absolute zero. E.g.: • Weight in pounds. • Height in meters. There cannot be negative measurements.
  • 23. Observations • The description of observations: It includes collecting, summarizing and presenting. It is also known as Descriptive statistics. • The inference of observations: It includes analyzing and interpreting. It is known as Inferential statistics.
  • 24. Data › Whenever an observation is made, it will be recorded and a collective recording of these observations, either numerical or otherwise is called DATA
  • 25. Data Types of Data Primary Data Secondary data Qualitative data Quantitative data Data are a set of values of one or more variables recorded on one or more individuals.
  • 26. Primary data: It is the data obtained directly from an individual. Advantages I. Precise information 2. Reliable Disadvantages I. Time consuming Secondary data: It is obtained from outside sources, e.g. hospital records, school register.
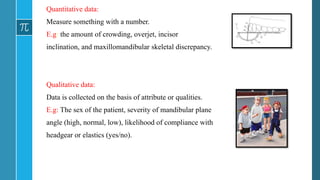
  • 27. Quantitative data: Measure something with a number. E.g: the amount of crowding, overjet, incisor inclination, and maxillomandibular skeletal discrepancy. Qualitative data: Data is collected on the basis of attribute or qualities. E.g: The sex of the patient, severity of mandibular plane angle (high, normal, low), likelihood of compliance with headgear or elastics (yes/no).
  • 28. Uses Of Data: In designing a health care programme. In evaluating the effectiveness of an on going program. In determining the needs of a specific population. . In evaluating the scientific accuracy of a journal article.
  • 29. Method of collection of data Questionnaires Surveys Records Interviews
  • 30. Need for organising the DATA › The goal is to summarise and present data in useful ways to support prompt and effective decisions
  • 31. Presentation of Data: Methods of presentation of data Tabulation Diagrams/graphs
  • 32. Tabulation Types of Tables Simple table Master table Frequency distribution table
  • 33. Guidelines for Tabular Presentation 1. Table must be numbered 2. Title- Brief and self explanatory title should be given 3. The heading of columns and rows must be clear, sufficient, concise and fully defined 4. The data must be presented according to size of importance 5. Full details of deliberate exclusions in collected series must be given
  • 34. 5. Table should not be too larges 6. Figures needing comparison should be placed as close as possible 7. Arrangement should be vertical 8. Foot notes should be given whenever necessary.
  • 35. Graphs And Diagrams Impact on imagination Better retained in memory Easy comparisons
  • 36. Bar Charts A diagram of columns or bars, the height of the bars determine the value of the particular data in question. Simple bar graph Multiple bar graph Component bar graph
  • 37. Pie Charts: 58% 23% 10% 9% Distribution of Malocclusions in school children class 1 class 2A class 2B class 3 These are so called because the entire graph looks like a pie and its components represent slices cut from a pie.
  • 38. Line Graph: When the quantity is a continuous variable i.e., time or temperature, data is plotted as a continuous line. 0 1 2 3 4 5 6 Category 1 Category 2 Category 3 Category 4
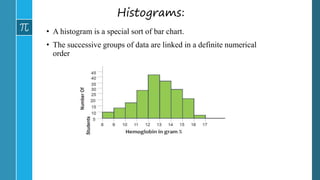
  • 39. Histograms: • A histogram is a special sort of bar chart. • The successive groups of data are linked in a definite numerical order Haemoglobin levels of Students in a class
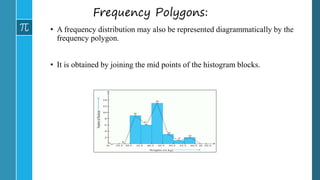
  • 40. Frequency Polygons: • A frequency distribution may also be represented diagrammatically by the frequency polygon. • It is obtained by joining the mid points of the histogram blocks.
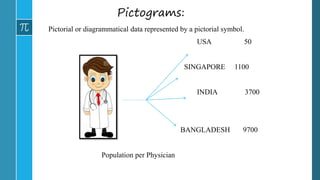
  • 41. Pictograms: Pictorial or diagrammatical data represented by a pictorial symbol. USA 50 SINGAPORE 1100 INDIA 3700 BANGLADESH 9700 Population per Physician
  • 42. • Introduction ✔ • Basic terminology✔ • Scales of measurement ✔ • Data ✔ • Presentation of data ✔ • Measures of Dispersion • References
  • 43. Central Tendency / Statistical Averages: • Central tendency refers to the center of the distribution of data points. • Statistics/parameters as the Mean (the arithmetic average) Median (the middle datum) Mode (the most frequent score). Objectives •To condense the entire mass of data. •To facilitate comparison.
  • 44. Mean • This measure implies the arithmetic average or arithmetic mean. • It is obtained by summing up all the observations and dividing the total by number of observations. E.g. The following gives you the fasting blood glucose levels of a sample of 10 children. 1 2 3 4 5 6 7 8 9 10 56 62 63 65 65 65 65 68 70 71 Total Mean = 650 / 10 = 65 Mean is denoted by the sign X (X bar)
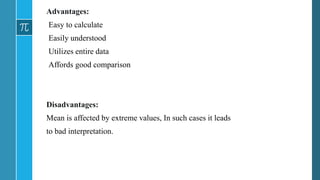
  • 45. Advantages: Easy to calculate Easily understood Utilizes entire data Affords good comparison Disadvantages: Mean is affected by extreme values, In such cases it leads to bad interpretation.
  • 46. Median • In median the data are arranged in an ascending or descending order of magnitude and the value of middle observation is located. Arrange them in ascending or descending order. 71,75,75,77,79,81,83,84,90,95. Median = 79 + 81 / 2 = 80 If there are only 9 observations then median = 79. Advantages: 1. It is more representative than mean. 2. It does not depend on every observations. 3. It is not affected by extreme values.
  • 47. Mode Mode is that value which occurs with the greatest frequency. A distribution may have more than one mode. E.g. Diastolic blood pressure of 10 individuals. 85,75,81,79,71,80,75,78,72,73 Here mode = 75 i.e. the distribution is uni-modal 85,75,81,79,80,71,80,78,75,73 Here mode =75 and 80 i.e. the distribution is bi-modal.
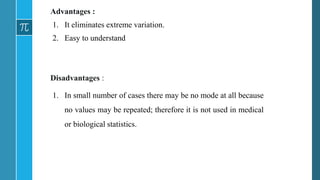
  • 48. Advantages : 1. It eliminates extreme variation. 2. Easy to understand Disadvantages : 1. In small number of cases there may be no mode at all because no values may be repeated; therefore it is not used in medical or biological statistics.
  • 49. Dispersion Dispersion is the degree of spread or variation of the variable about a central value. The measures of dispersion helps us to study the spread of the values about the central value. Purpose of Measures of Dispersion 1. To study the variability of data. 2. To determine the reliability of an average. 3. Compare two or more series in relation to their variability.
  • 50. Methods of dispersion The range Mean deviation Standard deviation
  • 51. The Range: The range is defined as the difference between the highest and lowest figures in a given sample. • It is by far the simplest measure of dispersion. Advantage: • Easy to calculate Disadvantages: • Unstable • It is affected by one extremely high or low score.
  • 52. The Mean Deviation: • It is the average of deviations from the arithmetic mean. • It is given by, M.D. =  (X – Xi) n
  • 53. Standard Deviation • The standard deviation is the most frequently used measure of deviation. • In simple terms it is defined as Root Mean Square deviation because it is the square root of the variance (average of the squared difference from the mean) • It is denoted by the Greek letter  or by the initials S.D.  = (X – Xi)2  n • Greater the S.D. greater will be the magnitude of dispersion from mean. • A small S.D. means a higher degree of uniformity of observations.
  • 54. The Normal Curve / Normal Distribution/ Gaussian Distribution When a data is collected from a very large number of people and a frequency distribution is made with narrow class intervals , the resulting curve is smooth and symmetrical and it is called normal curve.
  • 55. Standard Normal Curve • It is bell shaped . • The curve is perfectly symmetrical based on an infinitely large number of observations. • The total area of curve is one, its mean is zero and standard deviation is one. • All the three measures of central tendency , the mean, median and mode coincide
  • 56. Probability • Probability is defined as possible or probable chances of occurrence of an event or happening. Probability is a proportion. • In tossing a coin, the only possible outcome is a head or a tail. Probability of a head is 0.5 and tail is 0.5 and the sum is 1.
  • 57. If the probability is more than 0.05, the difference is called insignificant and if it is less than (or) equal to 0.05 the difference is called as significant. This value of P is obtained by calculating various tests of significance. P < 0.001 Very highly significant P < 0.01 Highly significant P < 0.05 Significant. P > 0.05 not Significant.
  • 58. • Introduction ✔ • Basic terminology✔ • Scales of measurement ✔ • Data ✔ • Presentation of data ✔ • Measures of Dispersion ✔ • References
  • 59. REFERENCES: •Biostatistics for oral healthcare – Jay S. Kim, Ronald J. Dailey •Essentials of public health dentistry- Soben Peter •Park text book of Community Medicine •Orthodontics: Current principles and techniques. Graber, Vanarsdall, Vig 59

Editor's Notes

  • #4: 1. Derived from the Italian word statista meaning statesman 2.Such a height of a person, birth of a baby, etc
  • #5: A famous mathematician and physicist William Thomson, 19th century
  • #6: John Graunt was the first demographer
  • #8: Now why is Biostatistics important
  • #9: Before proceeding further we need to know some basic terminologies
  • #11: Infinite population-
  • #15: First we saw statistics followed by biostatistics and its importance Population Variables and its types Quantitative Numerical and Qualitative Categorical Discreate and continuous Confounding variable
  • #19: First we saw statistics followed by biostatistics and its importance Population Variables and its types Quantitative Numerical and Qualitative Categorical Discreate and continuous Confounding variable
  • #25: Recording the sex of a person, height, etc
  • #34: Tables are most frequently used form of data presentation so these are certain guidelines to follow
  • #43: First we saw statistics followed by biostatistics and its importance Population Variables and its types Scales of measurements – Nominal, Ordinal, and ratio Observation and data- Types uses and presentation of data and guidelines for tabular presentation
  • #45: As we can see here , there are 10 observations ranging from 56 to 71
  • #48: 75 once 75 and 80 twice
  • #54: Sigma X mean of observations Xi - observations
  • #55: Named after Sir Fredrik Gauss, famous mathematician and scientist Also called as Bell curve It states that averages of samples of observations of random variables drawn independently converge to the normal and the become normal distributed when the sample is large
  • #57: Last
  • #59: First we saw statistics followed by biostatistics and its importance Population Variables and its types Scales of measurements – Nominal, Ordinal, and ratio Observation and data- Types uses and presentation of data and guidelines for tabular presentation