


More Related Content
Similar to Computing Descriptive Statistics © 2014 Argos.docx (20)
More from aryan532920 (20)


Recently uploaded (20)


Computing Descriptive Statistics © 2014 Argos.docx
- 1. Computing Descriptive Statistics © 2014 Argosy University Page 2 of 5 Research and Evaluation Design ©2014 Argosy University 2 Computing Descriptive Statistics Computing Descriptive Statistics: “Ever Wonder What Secrets They Hold?” The Mean, Mode, Median, Variability, and Standard Deviation Introduction Before gaining an appreciation for the value of descriptive statistics in behavioral science environments, one must first become familiar with the type of measurement data these statistical processes use. Knowing the types of measurement data will aid
- 2. the decision maker in making sure that the chosen statistical method will, indeed, produce the results needed and expected. Using the wrong type of measurement data with a selected statistic tool will result in erroneous results, errors, and ineffective decision making. Measurement, or numerical, data is divided into four types: nominal, ordinal, interval, and ratio. The businessperson, because of administering questionnaires, taking polls, conducting surveys, administering tests, and counting events, products, and a host of other numerical data instrumentations, garners all the numerical values associated with these four types. Nominal Data Nominal data is the simplest of all four forms of numerical data. The mathematical values are assigned to that which is being assessed simply by arbitrarily assigning numerical values to a characteristic, event, occasion, or phenomenon. For example, a human resources (HR) manager wishes to determine the differences in leadership styles between managers who are at different geographical regions. To compute the differences, the HR manager might assign the following values: 1 = West, 2 = Midwest, 3 = North, and so on. The numerical values are not descriptive of anything other than the location and are not indicative of quantity. Ordinal Data In terms of ordinal data, the variables contained within the
- 3. measurement instrument are ranked in order of importance. For example, a product-marketing specialist might be interested in how a consumer group would respond to a new product. To garner the information, the questionnaire administered to a group of consumers would include questions scaled as follows: 1 = Not Likely, 2 = Somewhat Likely, 3 = Likely, 4 = More Than Likely, and 5 = Most Likely. This creates a scale rank order from Not Likely to Most Likely with respect to acceptance of the new consumer product. Interval Data Oftentimes, in addition to being ordered, the differences (or intervals) between two adjacent measurement values on a measurement scale are identical. For example, the differences in age between managers 25 years of age and 30 years of age are the same as the differences in age between managers who are 40 years of age and 45 years of age. That is to say, when each interval represents the same increment of that which is being measured, the measure is referred to as an interval measurement or interval mathematical value. Page 3 of 5 Research and Evaluation Design ©2014 Argosy University
- 4. 3 Computing Descriptive Statistics Ratio Data Some measurements, in addition to having an equal interval value, also have an absolute zero value. In this instance, zero represents the absence of the variable being measured. With an absolute zero value, for example, either you have some money or you do not have any money. In the money scenario, adding the interval quality to ratio data would mean that you have no money, $1.00 to $5.00, $6.00 to $10.00, and so on. What is being stated here is that ratio data is quantitative as it tells us the amount of the variable being measured. Consider other examples of ration data such as the percentage of votes received by a candidate, the gross national product per capita, the current American crime rate, and the number of finished consumer products manufactured per day per person—all of these are examples of ratio data. Why Measurement Data Matters To the behavioral scientist, when conducting research, the level of measurement is important because the higher the level of measurement of a variable, the more powerful the statistical techniques that can be employed to analyze the data. Take, for example, the voters’ choice wherein the nominal variables in the 2004 presidential race were Bush, Kerry, Nader, etc. One can count the number of votes each candidate received as well as calculate the percentage each
- 5. candidate received. One can also calculate joint frequencies and percentages by region and by gender. One can also calculate the relationship between region and vote and whether the relationship occurred by chance. Unfortunately, using nominal measurement data does not permit one to use advanced methods of statistics. In the example presented above, even when we assign numbers to each candidate, we cannot very well determine that Bush plus Kerry equals Nader or that Nader divided by Kerry is half way between Bush and Kerry, and so on. In an attempt to calculate the situation, only the mentioned higher level statistical techniques are required. If one uses a technique that assumes a higher level of measurement than is appropriate for the data, there is a risk of getting meaningless results and answers. At the same time, if one uses a technique that fails to take advantage of a higher level of measurement, important things are often overlooked about the data collected. Computing and Using the Mean, Median, Mode, Frequency Distribution, and Standard Deviation Regardless of the type of measurement data garnered from a data collection set, the mean, mode, median, frequency distribution, and standard deviation can be calculated. However, simply because mathematical calculations can be made does not imply the legitimacy of their use. The remainder of this section will deal with how one computes and uses measures of central tendency
- 6. in business situations. Mean Mean is the arithmetic average of a group of measurement values. To be meaningful, the resulting mathematical value must be based on at least an ordinal set of data or above. Interval and ratio are also appropriate for calculating the mean. The resulting mean of a group of data will only describe the data in general descriptive terms. The mean alone cannot be used to draw conclusions and make inferences about a population being studied. Page 4 of 5 Research and Evaluation Design ©2014 Argosy University 4 Computing Descriptive Statistics Formula: N (n) = Number of participants in a study, or numeric values Σ = Sum of all numeric values X = Raw score, or individual measurement score
- 7. = The mean Page 5 of 5 Research and Evaluation Design ©2014 Argosy University 5 Computing Descriptive Statistics Example Consider a production manager who wants to determine whether the 11 employees of the second shift of line employees are producing more baby strollers than the 11 first-shift employees. The second-shift employees produce the following number of baby strollers: 5, 7, 8, 5, 7, 7, 9, 9, 5, 5, 5. The first-shift employees produce the following number of units: 7, 7, 7, 7, 6, 6, 9, 2, 4, 6, 8. Solution : Second shift total units (ΣΧ) = 72
- 8. Second shift total number of employees (n) = 11 Mean = 72/11 = 6.55 units produced First shift units (ΣΧ) = 69 First shift total number of employees (n) = 11 Mean = 69/11 = 6.27 units produced Conclusion What appears to be happening is that the second shift of line employees produces more baby strollers than the first shift of line employees. Caution: No other conclusions can be drawn from the mean. To determine whether production differences are significant, a higher level statistical process must be used. We can only “describe” what has happened here and cannot draw conclusions or make inferences as to why or how much.
- 9. Median Median is broadly defined as the middle value of a set of measurement values. Just like medians divide roads down the middle, so does the median in statistics in that the median is simply the middle number For highly skewed distributions, the median is a better measure of central tendency than the mean as extreme outliners or measurement values do not affect it. Formula: No statistical formula is needed. To calculate the median of a group of measurement scores, simply find the midpoint of the distribution by arranging the scores in ascending order—from low to high. Example Second-shift stroller production 5, 7, 8, 5, 7, 7, 9, 9, 5, 5, 5 Ordered Values –5, 5, 5, 5, 5, 7, 7, 7, 8, 9, 9
- 10. Median = 7 Page 6 of 5 Research and Evaluation Design ©2014 Argosy University 6 Computing Descriptive Statistics First-shift stroller production 7, 7, 7, 7, 6, 6, 9, 2, 4, 6, 8 Ordered values –2, 4, 6, 6, 6, 7, 7, 7, 7, 8, 9 Median = 7 Note: As the median values are equal, the mean is a better choice to describe the measurement data. Mode
- 11. Mode is defined as the most frequent value in a measurement data set and is of limited value. Example Second-shift stroller production: 5, 7, 8, 5, 7, 7, 9, 9, 5, 5, 5 Mode = 5 First-shift stroller production: 7, 7, 7, 7, 6, 6, 9, 2, 4, 6, 8 Mode = 7 Variability Furthermore, the central tendency is a summary measure of the overall quantity of a measurement data set. Variability (or dispersion) measures the amount of spread in a measurement data set. Variability is generally measured using three criteria: range, variance, and standard deviation. Example
- 12. Range The difference between the largest and the smallest value in the data set is calculated by subtracting the smallest value from the largest measurement value. Although the range is a crude measure of variability, it is easy to calculate and useful as an outline description of a data set. Page 7 of 5 Research and Evaluation Design ©2014 Argosy University 7 Computing Descriptive Statistics Example
- 13. Second-shift stroller production: 5, 7, 8, 5, 7, 7, 9, 9, 5, 5, 5 Range = 9 – 5 = 4 First-shift stroller production: 7, 7, 7, 7, 6, 6, 9, 2, 4, 6, 8 Range = 9 – 2 = 7 Variance Variance is a deviation. It is a measure of by how much each point frequency distribution lies above or below the mean for the entire data set: Note: If you add all the deviation scores for a measurement data set together, you will automatically get the mean for that data set. In order to define the amount of deviation of a data set from the mean, calculate the mean of all the deviation scores, i.e., the variance. Formula:
- 14. Standard Deviation In statistics, the standard deviation represents the measure of the spread of a set of measurement values from the mean of the data set. Putting it another way, the standard deviation can be defined as the average amount by which scores in a distribution differ from the mean while ignoring the sign of the difference, i.e., the plus or minus value. Further, standard deviations are only good when referring to single data or measurement values, i.e., finding out when a single score falls with reference to being above or below the mean. To find out the standard deviation of a data set, you must perform the following steps: 1. Calculate the mean of all the scores. 2. Find the deviation of each score from the mean. 3. Square each deviation. 4. Calculate the average of each deviation. 5. Calculate the square root of the average deviation.
- 15. Page 8 of 5 Research and Evaluation Design ©2014 Argosy University 8 Computing Descriptive Statistics Formula: Example Consider, for example, a real estate manager who wants to determine where his or her department employees are placed with respect to the average number of real estate closings they
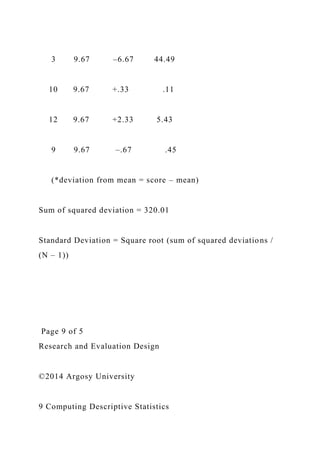
- 16. accomplish per month. The monthly closings are as follows: 8, 25, 7, 5, 8, 3, 10, 12, 9 1. First, calculate the mean and determine N. 2. Remember, the mean is the sum of scores divided by N, where N is the number of scores. 3. Therefore, the mean = (8+25+7+5+8+3+10+12+9) / 9 or 9.67 4. Then, calculate the standard deviation, n, as illustrated below. Squared Score Mean Deviation* Deviation 8 9.67 –1.67 2.79 25 9.67 +15.33 235.01 7 9.67 –2.67 7.13 5 9.67 –4.67 21.81 8 9.67 –1.67 2.79
- 17. 3 9.67 –6.67 44.49 10 9.67 +.33 .11 12 9.67 +2.33 5.43 9 9.67 –.67 .45 (*deviation from mean = score – mean) Sum of squared deviation = 320.01 Standard Deviation = Square root (sum of squared deviations / (N – 1)) Page 9 of 5 Research and Evaluation Design ©2014 Argosy University 9 Computing Descriptive Statistics
- 18. = Square root (320.01/ (9 – 1)) = Square root (40) = 6.32 Conclusion Real estate closings for the month vary ±6.32 closings above or below the mean of a 9.67 closing average. Caution must be exercised here as no conclusion can be drawn as to whether this is an acceptable range of real estate closing activity. In other words, you cannot draw a conclusion about whether the closings are profitable, not profitable, or represent an industry average. Further statistical data analysis would have to be conducted to draw any such conclusion. Page 10 of 5 Research and Evaluation Design
- 19. ©2014 Argosy University 10 Computing Descriptive Statistics The Color of Data: Visually Reported Data for Descriptive Statistical Presentations The Pros and Cons of Visually Reported Data For the behavioral scientist, whether in business, forensics, sociology, or anthropology, a host of other related facts such as profit reporting, result forecasting, time sequences, overtime hours, personality test scores, anxiety scores, and IQ are often reported visually. The reason for using visual presentations is not only because “a picture is worth a thousand words” but also because visually presented data is not generally bogged down with useless facts and figures. That is to say, visual presentations usually present the most salient or robust features of an event, occurrence, phenomenon, situation, problem, or condition. Visually presented information can
- 20. also be considered the road map to what has happened or lies ahead. Further, visually reported data are not only colorful but also easy to construct, and one does not have to be a statistician to create them. Unfortunately, visually reported data results in the behavioral science arena have two primary drawbacks, namely, the presenter and the lack of data sophistication. For the most part, visually presented data are based on percentages, raw numeric data scores, and frequencies. Rarely is visually presented material based on true value statistics based on inferential statistical findings. The reason is that the values for inferential statistics are not amenable to graphs and charts, and their values speak mathematically for themselves. That is to say, inferential statistical values are mathematical values that must be interpreted and are not subjected to graphic presentation. A Prelude to Statistical Data Analysis: Raw Data’s Wardrobe in the Form of Bar Graphs, Pie Charts, Line Graphs, Stem and Leaf Displays, and Box and Whisper Plots
- 21. Introduction Regardless of the type of chart or graph you use to illuminate or express a concept or idea, they all have one thing in common, namely, to communicate via picture what is being studied or what is happening. A behavioral scientist, or any other person who wants to show what is taking place, makes use of bar graphs, pie charts, line graphs, leaf displays, and box and whisper plots. Unfortunately, however, those who are not well-grounded and informed about statistical processes oftentimes rely on these pictorial presentations to draw conclusions or make inferences about what is being studied and evaluated. When this happens in the behavioral science arena, wrong decisions are often made about important matters. Nonetheless, graphs and charts are an important step in achieving what statistical processes will eventually resolve. Bar Graph Bar graphs allow and encourage a great deal of poetic license to those who design or make use
- 22. of them. The reason is that the one designing the bar graph determines what scale is to be used. This means that the information can be presented in a misleading way. For example, by using a smaller scale (for example, having each half inch of the height of a bar represent 10 widgets versus 50 widgets produced), one can exaggerate the truth, make production differences look more dramatic, or even exaggerate values. On the other hand, by using a larger scale (for example having each half inch of a bar represent 50 widgets versus 10 widgets produced), a person can downplay differences, make the end results look less dramatic than they actually are or even make small differences appear to be nonexistent. When evaluating a bar graph, one should do the following: Page 11 of 5 Research and Evaluation Design
- 23. ©2014 Argosy University 11 Computing Descriptive Statistics Make sure that the bars that divide up values are equal in width for an equitable comparison. Make sure that there is an appropriate representation of all information being presented. Knowing that the information being presented might not be a fair representation of all information, be prepared to dig deeper and use more advanced statistical processes. Example Suppose, for example, we want to pictorially present, via a bar graph, information on how much money is spent on transportation by individuals of different income levels. The first step is to gather the information from a representative sample (sampling will be discussed later in the
- 24. course) and determine how much money each participant spends on transportation in a year. The second step is to define income level. The third step is to determine the horizontal axis and the vertical axis. When you are seeking the “how” of something, always remember that it becomes the vertical axis and the “category” becomes the horizontal axis. For this particular example, the bar graph might possibly look like the following: To construct a bar graph, go to your Windows task bar, click on Insert, click on Chart, and enter your information when prompted. Pie Charts Similar to bar graphs, pie charts, or circle graphs, are a pictorial means using which the individual can present information in a simple, nonstatistical form. Further, like bar graphs, pie charts are usually employed to compare percentages of the same whole. Unlike bar graphs, pie charts do not use a set of axes to plot information or data points. Pie
- 25. charts are display percentages and are used to compare different parts of the same whole. With pie charts, it is important to remember how they are sometimes misrepresented in business situations, namely leaving out parts of the whole and not defining what the whole really is. When a part of the whole is omitted, then it increases the percentage values of the remaining parts that are displayed. When the whole Page 12 of 5 Research and Evaluation Design ©2014 Argosy University 12 Computing Descriptive Statistics is not well-defined, the reader is unclear about what the parts represent. Again, a pie is a graphical representation of how many individual parts contribute to the total.
- 26. Example Take, for example, a human resource manager who is interested in finding out how three different departments in a business situation waste time on the Internet on a given day when they should be engaged in company business. The human resource person would collect data through a time study process and determine the number of times each employee in each department logged on and off the Internet for personal business. The times would be collected and added together, and each department’s time would be converted to percentages. Going further, the human resource manager reported that, cumulatively, the employees of Department 1 spent a total of five hours a day on the Internet, those of Department 2 spent two hours a day, and those of Department 3 spent six hours. The pie chart would look like the following: