SlideShare a Scribd company logo
19
Most read
20
Most read
21
Most read
MEASURES OF CENTRAL
TENDENCY & MEASURES
OF DISPERSION
HOOR GULALAI KAKAKHEL
MS BIOCHEMISTRY & MOLECULAR BIOLOGY
CONTENTS
Measure of central tendency
 Mean
 Median
 Mode
Measure of dispersion
 Range
 Variance
 Standard deviation
MEASURE OF CENTRAL TENDENCY
In statistics, the central tendency is the descriptive summary of a data set. It is stated
as the statistical measure that represents the single value of the entire distribution or a
dataset. It aims to provide an accurate description of the entire data in the distribution.
A measure of central tendency (also referred to as measures of centre or central
location) is a summary measure that attempts to describe a whole set of data with a
single value that represents the middle or centre of its distribution.
There are three main measures of central tendency:
 Mean
 Median
 Mode
Each of these measures describes a different indication of the typical or central value in
the distribution.
UNIT 3-1.pptx of biostatistics nursing 6th sem
1. MEAN
The mean represents the average value of the dataset. It can be calculated as the sum
of all the values in the dataset divided by the number of values/ obervations. In general,
it is considered as the arithmetic mean/ average.
In statistics, mean is the most common and frequently used method to measure the
center of a data set. It’s a fundamental yet essential part of the statistical analysis of
data. If we calculate the average value of the population set, then it is called the
population mean. Sometimes, population data is vast, and we cannot perform analysis
on that data set. Hence, in that case, we take a sample out of it and take an average.
That sample represents the population set and the mean of this part of the data is called
a sample mean.
An important note is that the mean value is the average value, which will fall between
the maximum and minimum value in the data set. The mean value will not be the
number in the data set, but its values are sometimes equal to the data set’s value.
CONT..
Symbols
𝜇 (Mu) – for representing population mean
If observations are taken from every unit of population
x
̄ (x-bar) – for sample mean
Direct estimate of population mean
CONT..
The histogram given below shows that the mean value of symmetric continuous data and the skewed continuous
data.
In symmetric data distribution, the mean value is located accurately at the centre. But in the skewed continuous
data distribution, the extreme values in the extended tail pull the mean value away from the centre. So it is
recommended that the mean can be used for the symmetric distributions.
Advantage of the mean
The mean can be used for both continuous and discrete numeric data.
Limitations of the mean
The mean cannot be calculated for categorical data, as the values cannot be summed.
As the mean includes every value in the distribution the mean is influenced by outliers and skewed
distributions.
Another thing about the mean
The population mean is indicated by the Greek symbol µ (pronounced ‘mu’). When the mean is
calculated on a distribution from a sample it is indicated by the symbol (pronounced X-bar).
x
̅
Examples of Mean
Example 1
Maximum diameter of the cap of five specimens of an edible fungus
•8.5cm
•9.2cm
•7.3cm
•6.8cm
•10.1cm
Mean maximum diameter of the cap of edible fungus is ________.
Example 2
Number of spikelets in five floweheads of annual meadow grass
•28
•16
•24
•31
•27
Mean number of spikelets in flowerheads of annual meadow grass is ________.
Example 3
Number of wood ants captured in seven pitfall traps
25 4 12 9 15 8 202
Mean = ______ ants
Mean is greatly distorted by a single exceptional value
2. MEDIAN
Median is the middle value of the dataset in which the dataset is arranged in the ascending order or in
descending order. When the dataset contains an even number of values, then the median value of the
dataset can be found by taking the mean of the middle two values.
Consider the given dataset with the odd number of observations arranged in descending order – 23, 21, 18,
16, 15, 13, 12, 10, 9, 7, 6, 5, and 2
Here 12 is the middle or median number that has 6 values above
it and 6 values below it.
CONT..
Now, consider another example with an even number of observations that are arranged
in descending order – 40, 38, 35, 33, 32, 30, 29, 27, 26, 24, 23, 22, 19, and 17
When you look at the given dataset, the two middle values obtained are 27
and 29.
Now, find out the mean value for these two numbers.
i.e.,(27+29)/2 =28
Therefore, the median for the given data distribution is 28.
Advantage of the median
The median is less affected by outliers and skewed data than the mean and is usually
the preferred measure of central tendency when the distribution is not symmetrical.
Limitation of the median
The median cannot be identified for categorical nominal data, as it cannot be logically
ordered.
3. MODE
The mode represents the frequently occurring value in the dataset. Sometimes the
dataset may contain multiple modes and in some cases, it does not contain any mode at
all.
Consider the given dataset 5, 4, 2, 3, 2, 1, 5, 4, 5
Since the mode represents the most common value. Hence, the
most frequently repeated value in the given dataset is 5.
Advantage of the mode
The mode has an advantage over the median and the mean as it can be found for both numerical and categorical (non-
numerical) data.
Limitations of the mode
The are some limitations to using the mode. In some distributions, the mode may not reflect the centre of the distribution very
well. When the distribution of retirement age is ordered from lowest to highest value, it is easy to see that the centre of the
distribution is 57 years, but the mode is lower, at 54 years.
54, 54, 54, 55, 56, 57, 57, 58, 58, 60, 60
It is also possible for there to be more than one mode for the same distribution of data, (bi-modal, or multi-modal). The
presence of more than one mode can limit the ability of the mode in describing the centre or typical value of the distribution
because a single value to describe the centre cannot be identified.
In some cases, particularly where the data are continuous, the distribution may have no mode at all (i.e. if all values are
different).
In cases such as these, it may be better to consider using the median or mean or group the data into appropriate intervals and
find the modal class.
MEASURE OF CENTRAL TENDENCY
Based on the properties of the data, the measures of central tendency are selected.
If you have a symmetrical distribution of continuous data, all the three measures of
central tendency hold good. But most of the times, the analyst uses the mean because it
involves all the values in the distribution or dataset.
If you have skewed distribution, the best measure of finding the central tendency is the
median.
If you have the original data, then both the median and mode are the best choice of
measuring the central tendency.
If you have categorical data, the mode is the best choice to find the central tendency.
MEASURE OF DISPERSION/
VARIABILITY
Dispersion is the state of getting dispersed or spread. Statistical dispersion means the
extent to which numerical data is likely to vary about an average value. In other words,
dispersion helps to understand the distribution of the data.
Measures of Dispersion
In statistics, the measures of dispersion help to interpret the variability of data i.e. to
know how much homogenous or heterogeneous the data is. In simple terms, it shows
how squeezed or scattered the variable is.
Variability
If there were no variability within population
–There would be no need of statistics
A single item or sample unit or sampling unit
–Would give all required information about the population
Therefore – it is not enough simply to give the measure of central tendency
–Information about variability – also needed
Mathematically defined measures – used for the quantitative analysis of variability
Most basic – range, standard deviation and variance
RANGE
Simplest measure of variability
(largest score – smallest score)
Indicates the highest and lowest observations in a distribution
Shows – how wide the distribution is over which the measurements are
spread
Does not give an idea – about the pattern of distribution
–Are they evenly spread?
–Or are they clustered?
VARIANCE
σ2 = population variance
s2 = sample variance
s = sample standard deviation
N = the number of observations
xi = the observed values of a sample item
x
̄ = the mean value of the observations
In statistics, variance measures
variability from the average or
mean. It is calculated by taking
the differences between each
number in the data set and the
mean, then squaring the
differences to make them
positive, and finally dividing the
sum of the squares by the
number of values in the data set.
Square of standard deviation
STANDARD DEVIATION
A standard deviation (or σ) is a measure of how dispersed the data is in relation to the mean. Low,
or small, standard deviation indicates data are clustered tightly around the mean, and high, or
large, standard deviation indicates data are more spread out.
Most widely applied measure of variability
Square root of the variance
Population:
Sample:
σ = population standard deviation
N = the size of the population
xi = each value from the
population
𝜇 = the population mean
s = sample standard deviation
N = the number of observations
xi = the observed values of a sample item
x
̄ = the mean value of the observations
UNIT 3-1.pptx of biostatistics nursing 6th sem

More Related Content

Similar to UNIT 3-1.pptx of biostatistics nursing 6th sem (20)

PPTX
3Data summarization.pptx
AmanuelMerga
 
PPT
Biostatistics basics-biostatistics4734
AbhishekDas15
 
PPT
Biostatistics basics-biostatistics4734
AbhishekDas15
 
PPTX
Measures of central tendency
Mmedsc Hahm
 
PDF
unit4 rm research methodology .pdf
AnmolMogalai
 
PPTX
Measures of Central Tendency, Measures of Position, Measures of Dispersion, S...
Sundar B N
 
PPTX
Measures of Central Tendency and Dispersion (Week-07).pptx
SarmadAltafHafizAlta
 
PDF
SUMMARY MEASURES.pdf
GillaMarieLeopardas1
 
PPTX
Presentation of DESCRIPTIVE STATISTICS analysis
sasaelmasry66
 
PPT
Stat11t chapter3
raylenepotter
 
PPTX
measures of central tendency.pptx
Manish Agarwal
 
DOCX
161144815 obesity
homeworkping7
 
PPTX
Lecture 3 Measures of Central Tendency and Dispersion.pptx
shakirRahman10
 
PPT
Business statistics
Ravi Prakash
 
PPTX
Chapter 12 Data Analysis Descriptive Methods and Index Numbers
International advisers
 
PPT
Introduction biostatistics
Dr.Muhammad Omer
 
PDF
1.0 Descriptive statistics.pdf
thaersyam
 
PDF
Statistics and permeability engineering reports
wwwmostafalaith99
 
PPT
Triola 11 chapter 3
babygirl5810
 
PPTX
Central tendency _dispersion
Kirti Gupta
 
3Data summarization.pptx
AmanuelMerga
 
Biostatistics basics-biostatistics4734
AbhishekDas15
 
Biostatistics basics-biostatistics4734
AbhishekDas15
 
Measures of central tendency
Mmedsc Hahm
 
unit4 rm research methodology .pdf
AnmolMogalai
 
Measures of Central Tendency, Measures of Position, Measures of Dispersion, S...
Sundar B N
 
Measures of Central Tendency and Dispersion (Week-07).pptx
SarmadAltafHafizAlta
 
SUMMARY MEASURES.pdf
GillaMarieLeopardas1
 
Presentation of DESCRIPTIVE STATISTICS analysis
sasaelmasry66
 
Stat11t chapter3
raylenepotter
 
measures of central tendency.pptx
Manish Agarwal
 
161144815 obesity
homeworkping7
 
Lecture 3 Measures of Central Tendency and Dispersion.pptx
shakirRahman10
 
Business statistics
Ravi Prakash
 
Chapter 12 Data Analysis Descriptive Methods and Index Numbers
International advisers
 
Introduction biostatistics
Dr.Muhammad Omer
 
1.0 Descriptive statistics.pdf
thaersyam
 
Statistics and permeability engineering reports
wwwmostafalaith99
 
Triola 11 chapter 3
babygirl5810
 
Central tendency _dispersion
Kirti Gupta
 

Recently uploaded (20)

PPTX
national medicinal plants board mpharm.pptx
SHAHEEN SHABBIR
 
PPTX
IDEAS AND EARLY STATES Social science pptx
NIRANJANASSURESH
 
PPTX
Joint Mobility : Fundamentals of Joint Mobility
Sreeraj S R
 
PPTX
TOP 10 AI TOOLS YOU MUST LEARN TO SURVIVE IN 2025 AND ABOVE
digilearnings.com
 
PPTX
Rules and Regulations of Madhya Pradesh Library Part-I
SantoshKumarKori2
 
PPTX
THE HUMAN INTEGUMENTARY SYSTEM#MLT#BCRAPC.pptx
Subham Panja
 
PPTX
Artificial Intelligence in Gastroentrology: Advancements and Future Presprec...
AyanHossain
 
PPTX
HEALTH CARE DELIVERY SYSTEM - UNIT 2 - GNM 3RD YEAR.pptx
Priyanshu Anand
 
PPTX
Constitutional Design Civics Class 9.pptx
bikesh692
 
PDF
A guide to responding to Section C essay tasks for the VCE English Language E...
jpinnuck
 
PPTX
The Future of Artificial Intelligence Opportunities and Risks Ahead
vaghelajayendra784
 
PPTX
GENERAL METHODS OF ISOLATION AND PURIFICATION OF MARINE__MPHARM.pptx
SHAHEEN SHABBIR
 
PDF
Right to Information.pdf by Sapna Maurya XI D
Directorate of Education Delhi
 
PDF
TOP 10 AI TOOLS YOU MUST LEARN TO SURVIVE IN 2025 AND ABOVE
digilearnings.com
 
PPTX
MALABSORPTION SYNDROME: NURSING MANAGEMENT.pptx
PRADEEP ABOTHU
 
PPTX
Various Psychological tests: challenges and contemporary trends in psychologi...
santoshmohalik1
 
PPTX
INTESTINAL OBSTRUCTION: NURSING MANAGEMENT.pptx
PRADEEP ABOTHU
 
PPTX
Digital Professionalism and Interpersonal Competence
rutvikgediya1
 
PPTX
Virus sequence retrieval from NCBI database
yamunaK13
 
PPTX
INTESTINALPARASITES OR WORM INFESTATIONS.pptx
PRADEEP ABOTHU
 
national medicinal plants board mpharm.pptx
SHAHEEN SHABBIR
 
IDEAS AND EARLY STATES Social science pptx
NIRANJANASSURESH
 
Joint Mobility : Fundamentals of Joint Mobility
Sreeraj S R
 
TOP 10 AI TOOLS YOU MUST LEARN TO SURVIVE IN 2025 AND ABOVE
digilearnings.com
 
Rules and Regulations of Madhya Pradesh Library Part-I
SantoshKumarKori2
 
THE HUMAN INTEGUMENTARY SYSTEM#MLT#BCRAPC.pptx
Subham Panja
 
Artificial Intelligence in Gastroentrology: Advancements and Future Presprec...
AyanHossain
 
HEALTH CARE DELIVERY SYSTEM - UNIT 2 - GNM 3RD YEAR.pptx
Priyanshu Anand
 
Constitutional Design Civics Class 9.pptx
bikesh692
 
A guide to responding to Section C essay tasks for the VCE English Language E...
jpinnuck
 
The Future of Artificial Intelligence Opportunities and Risks Ahead
vaghelajayendra784
 
GENERAL METHODS OF ISOLATION AND PURIFICATION OF MARINE__MPHARM.pptx
SHAHEEN SHABBIR
 
Right to Information.pdf by Sapna Maurya XI D
Directorate of Education Delhi
 
TOP 10 AI TOOLS YOU MUST LEARN TO SURVIVE IN 2025 AND ABOVE
digilearnings.com
 
MALABSORPTION SYNDROME: NURSING MANAGEMENT.pptx
PRADEEP ABOTHU
 
Various Psychological tests: challenges and contemporary trends in psychologi...
santoshmohalik1
 
INTESTINAL OBSTRUCTION: NURSING MANAGEMENT.pptx
PRADEEP ABOTHU
 
Digital Professionalism and Interpersonal Competence
rutvikgediya1
 
Virus sequence retrieval from NCBI database
yamunaK13
 
INTESTINALPARASITES OR WORM INFESTATIONS.pptx
PRADEEP ABOTHU
 
Ad

UNIT 3-1.pptx of biostatistics nursing 6th sem

  • 1. MEASURES OF CENTRAL TENDENCY & MEASURES OF DISPERSION HOOR GULALAI KAKAKHEL MS BIOCHEMISTRY & MOLECULAR BIOLOGY
  • 2. CONTENTS Measure of central tendency  Mean  Median  Mode Measure of dispersion  Range  Variance  Standard deviation
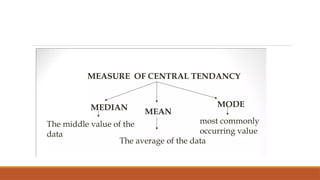
  • 3. MEASURE OF CENTRAL TENDENCY In statistics, the central tendency is the descriptive summary of a data set. It is stated as the statistical measure that represents the single value of the entire distribution or a dataset. It aims to provide an accurate description of the entire data in the distribution. A measure of central tendency (also referred to as measures of centre or central location) is a summary measure that attempts to describe a whole set of data with a single value that represents the middle or centre of its distribution. There are three main measures of central tendency:  Mean  Median  Mode Each of these measures describes a different indication of the typical or central value in the distribution.
  • 5. 1. MEAN The mean represents the average value of the dataset. It can be calculated as the sum of all the values in the dataset divided by the number of values/ obervations. In general, it is considered as the arithmetic mean/ average. In statistics, mean is the most common and frequently used method to measure the center of a data set. It’s a fundamental yet essential part of the statistical analysis of data. If we calculate the average value of the population set, then it is called the population mean. Sometimes, population data is vast, and we cannot perform analysis on that data set. Hence, in that case, we take a sample out of it and take an average. That sample represents the population set and the mean of this part of the data is called a sample mean. An important note is that the mean value is the average value, which will fall between the maximum and minimum value in the data set. The mean value will not be the number in the data set, but its values are sometimes equal to the data set’s value.
  • 6. CONT.. Symbols 𝜇 (Mu) – for representing population mean If observations are taken from every unit of population x ̄ (x-bar) – for sample mean Direct estimate of population mean
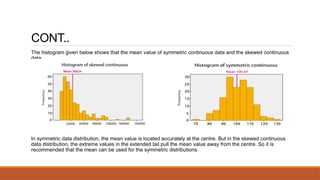
  • 7. CONT.. The histogram given below shows that the mean value of symmetric continuous data and the skewed continuous data. In symmetric data distribution, the mean value is located accurately at the centre. But in the skewed continuous data distribution, the extreme values in the extended tail pull the mean value away from the centre. So it is recommended that the mean can be used for the symmetric distributions.
  • 8. Advantage of the mean The mean can be used for both continuous and discrete numeric data. Limitations of the mean The mean cannot be calculated for categorical data, as the values cannot be summed. As the mean includes every value in the distribution the mean is influenced by outliers and skewed distributions. Another thing about the mean The population mean is indicated by the Greek symbol µ (pronounced ‘mu’). When the mean is calculated on a distribution from a sample it is indicated by the symbol (pronounced X-bar). x ̅
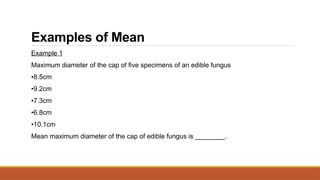
  • 9. Examples of Mean Example 1 Maximum diameter of the cap of five specimens of an edible fungus •8.5cm •9.2cm •7.3cm •6.8cm •10.1cm Mean maximum diameter of the cap of edible fungus is ________.
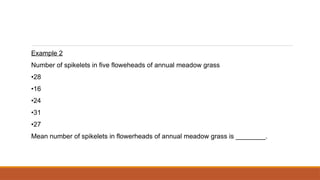
  • 10. Example 2 Number of spikelets in five floweheads of annual meadow grass •28 •16 •24 •31 •27 Mean number of spikelets in flowerheads of annual meadow grass is ________.
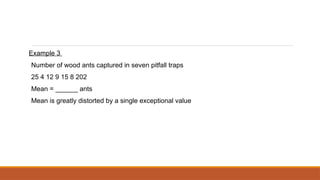
  • 11. Example 3 Number of wood ants captured in seven pitfall traps 25 4 12 9 15 8 202 Mean = ______ ants Mean is greatly distorted by a single exceptional value
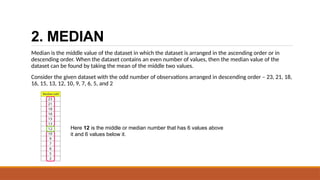
  • 12. 2. MEDIAN Median is the middle value of the dataset in which the dataset is arranged in the ascending order or in descending order. When the dataset contains an even number of values, then the median value of the dataset can be found by taking the mean of the middle two values. Consider the given dataset with the odd number of observations arranged in descending order – 23, 21, 18, 16, 15, 13, 12, 10, 9, 7, 6, 5, and 2 Here 12 is the middle or median number that has 6 values above it and 6 values below it.
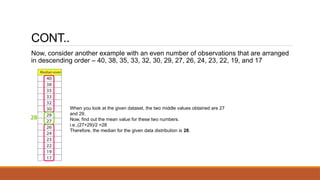
  • 13. CONT.. Now, consider another example with an even number of observations that are arranged in descending order – 40, 38, 35, 33, 32, 30, 29, 27, 26, 24, 23, 22, 19, and 17 When you look at the given dataset, the two middle values obtained are 27 and 29. Now, find out the mean value for these two numbers. i.e.,(27+29)/2 =28 Therefore, the median for the given data distribution is 28.
  • 14. Advantage of the median The median is less affected by outliers and skewed data than the mean and is usually the preferred measure of central tendency when the distribution is not symmetrical. Limitation of the median The median cannot be identified for categorical nominal data, as it cannot be logically ordered.
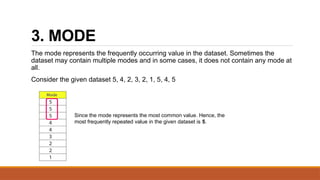
  • 15. 3. MODE The mode represents the frequently occurring value in the dataset. Sometimes the dataset may contain multiple modes and in some cases, it does not contain any mode at all. Consider the given dataset 5, 4, 2, 3, 2, 1, 5, 4, 5 Since the mode represents the most common value. Hence, the most frequently repeated value in the given dataset is 5.
  • 16. Advantage of the mode The mode has an advantage over the median and the mean as it can be found for both numerical and categorical (non- numerical) data. Limitations of the mode The are some limitations to using the mode. In some distributions, the mode may not reflect the centre of the distribution very well. When the distribution of retirement age is ordered from lowest to highest value, it is easy to see that the centre of the distribution is 57 years, but the mode is lower, at 54 years. 54, 54, 54, 55, 56, 57, 57, 58, 58, 60, 60 It is also possible for there to be more than one mode for the same distribution of data, (bi-modal, or multi-modal). The presence of more than one mode can limit the ability of the mode in describing the centre or typical value of the distribution because a single value to describe the centre cannot be identified. In some cases, particularly where the data are continuous, the distribution may have no mode at all (i.e. if all values are different). In cases such as these, it may be better to consider using the median or mean or group the data into appropriate intervals and find the modal class.
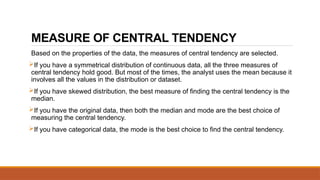
  • 17. MEASURE OF CENTRAL TENDENCY Based on the properties of the data, the measures of central tendency are selected. If you have a symmetrical distribution of continuous data, all the three measures of central tendency hold good. But most of the times, the analyst uses the mean because it involves all the values in the distribution or dataset. If you have skewed distribution, the best measure of finding the central tendency is the median. If you have the original data, then both the median and mode are the best choice of measuring the central tendency. If you have categorical data, the mode is the best choice to find the central tendency.
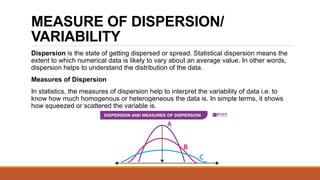
  • 18. MEASURE OF DISPERSION/ VARIABILITY Dispersion is the state of getting dispersed or spread. Statistical dispersion means the extent to which numerical data is likely to vary about an average value. In other words, dispersion helps to understand the distribution of the data. Measures of Dispersion In statistics, the measures of dispersion help to interpret the variability of data i.e. to know how much homogenous or heterogeneous the data is. In simple terms, it shows how squeezed or scattered the variable is.
  • 19. Variability If there were no variability within population –There would be no need of statistics A single item or sample unit or sampling unit –Would give all required information about the population Therefore – it is not enough simply to give the measure of central tendency –Information about variability – also needed Mathematically defined measures – used for the quantitative analysis of variability Most basic – range, standard deviation and variance
  • 20. RANGE Simplest measure of variability (largest score – smallest score) Indicates the highest and lowest observations in a distribution Shows – how wide the distribution is over which the measurements are spread Does not give an idea – about the pattern of distribution –Are they evenly spread? –Or are they clustered?
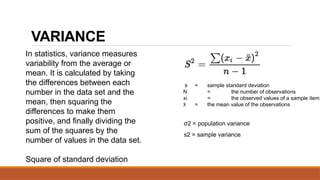
  • 21. VARIANCE σ2 = population variance s2 = sample variance s = sample standard deviation N = the number of observations xi = the observed values of a sample item x ̄ = the mean value of the observations In statistics, variance measures variability from the average or mean. It is calculated by taking the differences between each number in the data set and the mean, then squaring the differences to make them positive, and finally dividing the sum of the squares by the number of values in the data set. Square of standard deviation
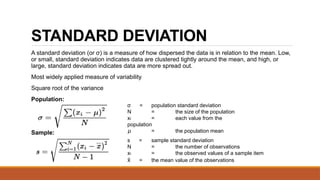
  • 22. STANDARD DEVIATION A standard deviation (or σ) is a measure of how dispersed the data is in relation to the mean. Low, or small, standard deviation indicates data are clustered tightly around the mean, and high, or large, standard deviation indicates data are more spread out. Most widely applied measure of variability Square root of the variance Population: Sample: σ = population standard deviation N = the size of the population xi = each value from the population 𝜇 = the population mean s = sample standard deviation N = the number of observations xi = the observed values of a sample item x ̄ = the mean value of the observations

Editor's Notes

  • #9: Mean maximum diameter of the cap of edible fungus is 8.38cm.
  • #10: Mean number of spikelets in flowerheads of annual meadow grass is 25.2.
  • #11: Mean = 39.3 ants
  • #12: Arranged in ascending or descending order
  • #17: We say data is skewed when the curve appears distorted to the left or right in a statistical distribution.