Understanding the cost of living through statistics
Download as pptx, pdf0 likes808 views

A one-day event which discussed how the cost of living is affecting the UK economy and what this means for different households, informed by the range of statistics that the Office for National Statistics (ONS) produces.


More Related Content
What's hot (20)
Similar to Understanding the cost of living through statistics (20)


More from Office for National Statistics (20)


Recently uploaded (20)


Understanding the cost of living through statistics
- 1. Understanding the cost of living through statistics 25 October 2022 slido #251022 #CostOfLiving @ONSfocus
- 2. Understanding the cost of living through statistics Welcome Michael Hardie Deputy Director, Prices Office for National Statistics slido #251022 #CostOfLiving @ONSfocus
- 3. Agenda 9.00am: Registration 9.30am: Chair's welcome – Mike Hardie, Deputy Director, Prices, ONS 9.40am: Opening address – Professor Sir Ian Diamond, National Statistician, ONS 10.00am: Response to opening address – Huw Pill, Chief Economist, Bank of England 10.25am: Current inflation statistical landscape – Matt Corder, Deputy Director, Prices; and Sonia Carrera, Assistant Deputy Director, Analytical Hub, ONS 10.50am: Analysis of cost of living impacts on different household groups – Abi Casey, Assistant Deputy Director, Prices, ONS 11.00am: Q&A 11.20am: Break 11.40am: Energy statistics and the cost of living – Tim Vizard, Assistant Deputy Director, Public Policy Analysis, and Jon Gough, Assistant Deputy Director, Business Insights and Conditions Survey (BICS), ONS 12.00pm: Q&A slido #251022 #CostOfLiving @ONSfocus
- 4. Agenda 12.15pm: Panel session: Cost of living analytical insights from different perspectives with Q&A Chair: Sam Beckett, Second Permanent Secretary, ONS Charlotte Dendy, Head of Economic Surveys and Data, the CBI Ashwin Kumar, Professor of Social Policy, Manchester Metropolitan University Afzal Rahman, Policy Officer, the Trades Union Congress Morgan Wild, Head of Policy, Citizens Advice 1.15pm: Lunch 1.55pm: How inflation and cost of living statistics are evolving, and the opportunities for transformation Chair: Sam Beckett, Second Permanent Secretary, ONS Peter Levell, Associate Director, Institute for Fiscal Studies Omar Guerrero, Head of Computational Social Science research, The Alan Turing Institute 2.25pm: Q&A 2.35pm: How the ONS is transforming consumer price stats – Sofia Poni, Assistant Deputy Director, Prices, ONS 2.45pm: Q&A 2.55pm: Closing remarks – Mike Hardie, Deputy Director, Prices, ONS 3.00pm: Close slido #251022 #CostOfLiving @ONSfocus
- 5. Questions can be submitted via slido using code #251022 slido #251022 #CostOfLiving @ONSfocus
- 6. Understanding the cost of living through statistics Professor Sir Ian Diamond National Statistician Office for National Statistics slido #251022 #CostOfLiving @ONSfocus
- 7. Understanding the cost of living through statistics Huw Pill Chief Economist Bank of England slido #251022 #CostOfLiving @ONSfocus
- 8. The current inflation statistical landscape Deputy Director, Prices Office for National Statistics Matthew Corder slido #251022 #CostOfLiving @ONSfocus
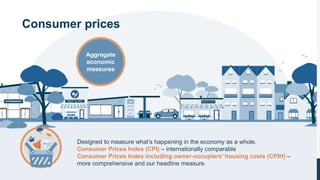
- 9. Consumer prices Designed to measure what’s happening in the economy as a whole. Consumer Prices Index (CPI) – internationally comparable Consumer Prices Index including owner-occupiers’ housing costs (CPIH) – more comprehensive and our headline measure Aggregate economic measures
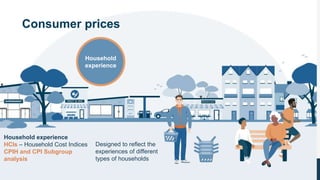
- 10. Consumer prices Designed to reflect the experiences of different types of households Household experience HCIs – Household Cost Indices CPIH and CPI Subgroup analysis Household experience
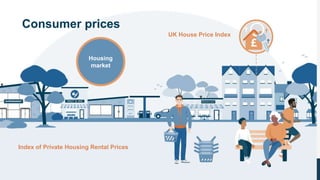
- 11. Consumer prices UK House Price Index Housing market Index of Private Housing Rental Prices
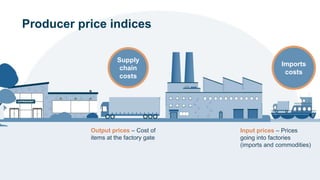
- 12. Producer price indices Output prices – Cost of items at the factory gate Imports costs Supply chain costs Input prices – Prices going into factories (imports and commodities)
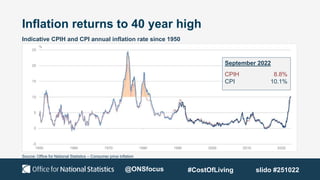
- 13. Inflation returns to 40 year high Source: Office for National Statistics – Consumer price inflation September 2022 CPIH 8.8% CPI 10.1% Indicative CPIH and CPI annual inflation rate since 1950 @ONSfocus #CostOfLiving slido #251022
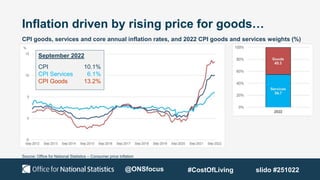
- 14. Inflation driven by rising price for goods… Source: Office for National Statistics – Consumer price inflation CPI goods, services and core annual inflation rates, and 2022 CPI goods and services weights (%) September 2022 CPI 10.1% CPI Services 6.1% CPI Goods 13.2% @ONSfocus #CostOfLiving slido #251022
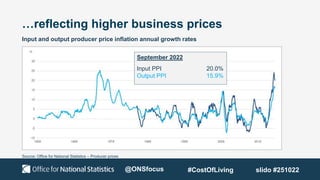
- 15. …reflecting higher business prices Source: Office for National Statistics – Producer prices Input and output producer price inflation annual growth rates September 2022 Input PPI 20.0% Output PPI 15.9% @ONSfocus #CostOfLiving slido #251022
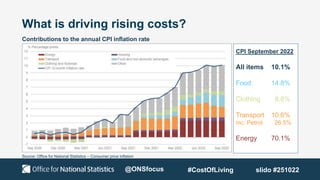
- 16. What is driving rising costs? Source: Office for National Statistics – Consumer price inflation CPI September 2022 All items 10.1% Food 14.8% Clothing 8.8% Transport 10.6% inc. Petrol 26.5% Energy 70.1% Contributions to the annual CPI inflation rate @ONSfocus #CostOfLiving slido #251022
- 17. Energy prices have risen sharply… Annual CPI inflation rates for energy Source: Office for National Statistics – Consumer price inflation • Ofgem price cap introduced in January 2019 • Energy prices fell during the pandemic, when consumption reduced during lockdowns • Gas prices fell between October 2019 and October 2021 September 2022 Electricity 54.0% Gas 95.7% @ONSfocus #CostOfLiving slido #251022
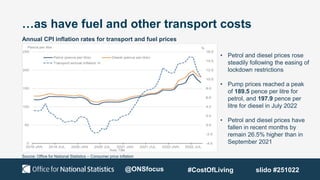
- 18. …as have fuel and other transport costs Annual CPI inflation rates for transport and fuel prices Source: Office for National Statistics – Consumer price inflation • Petrol and diesel prices rose steadily following the easing of lockdown restrictions • Pump prices reached a peak of 189.5 pence per litre for petrol, and 197.9 pence per litre for diesel in July 2022 • Petrol and diesel prices have fallen in recent months by remain 26.5% higher than in September 2021 @ONSfocus #CostOfLiving slido #251022
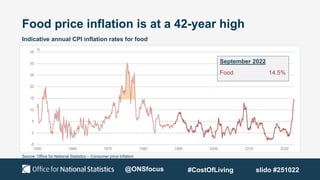
- 19. Food price inflation is at a 42-year high Indicative annual CPI inflation rates for food Source: Office for National Statistics – Consumer price inflation September 2022 Food 14.5% @ONSfocus #CostOfLiving slido #251022
- 20. Recent trends in inflation of food production Sonia Carrera Assistant Deputy Director Economic and Cross-Cutting Analysis Office for National Statistics slido #251022 #CostOfLiving @ONSfocus
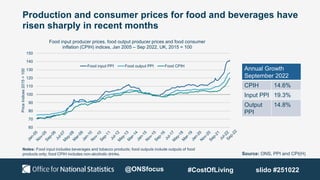
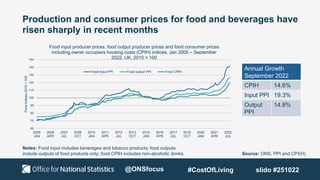
- 21. Production and consumer prices for food and beverages have risen sharply in recent months 60 70 80 90 100 110 120 130 140 150 Price Indices 2015 = 100 Food input producer prices, food output producer prices and food consumer inflation (CPIH) indices, Jan 2005 – Sep 2022, UK, 2015 = 100 Food input PPI Food output PPI Food CPIH Source: ONS, PPI and CPI(H) Notes: Food input includes beverages and tobacco products; food outputs include outputs of food products only; food CPIH includes non-alcoholic drinks. Annual Growth September 2022 CPIH 14.6% Input PPI 19.3% Output PPI 14.8% @ONSfocus #CostOfLiving slido #251022
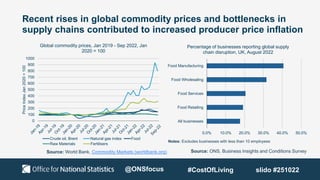
- 22. Recent rises in global commodity prices and bottlenecks in supply chains contributed to increased producer price inflation Source: World Bank, Commodity Markets (worldbank.org) Source: ONS, Business Insights and Conditions Survey 0 100 200 300 400 500 600 700 800 900 1000 Price Index Jan 2020 = 100 Global commodity prices, Jan 2019 - Sep 2022, Jan 2020 = 100 Crude oil, Brent Natural gas index Food Raw Materials Fertilisers 0.0% 10.0% 20.0% 30.0% 40.0% 50.0% All businesses Food Retailing Food Services Food Wholesaling Food Manufacturing Percentage of businesses reporting global supply chain disruption, UK, August 2022 Notes: Excludes businesses with less than 10 employees @ONSfocus #CostOfLiving slido #251022
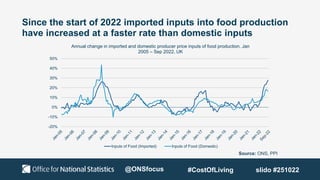
- 23. Since the start of 2022 imported inputs into food production have increased at a faster rate than domestic inputs Source: ONS, PPI -20% -10% 0% 10% 20% 30% 40% 50% Annual change in imported and domestic producer price inputs of food production, Jan 2005 – Sep 2022, UK Inputs of Food (Imported) Inputs of Food (Domestic) @ONSfocus #CostOfLiving slido #251022
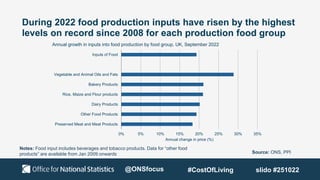
- 24. During 2022 food production inputs have risen by the highest levels on record since 2008 for each production food group Source: ONS, PPI 0% 5% 10% 15% 20% 25% 30% 35% Preserved Meat and Meat Products Other Food Products Dairy Products Rice, Maize and Flour products Bakery Products Vegetable and Animal Oils and Fats Inputs of Food Annual change in price (%) Annual growth in inputs into food production by food group, UK, September 2022 Notes: Food input includes beverages and tobacco products. Data for “other food products” are available from Jan 2009 onwards @ONSfocus #CostOfLiving slido #251022
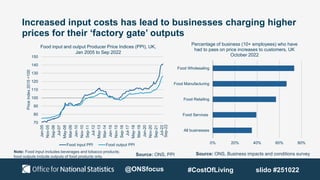
- 25. Increased input costs has lead to businesses charging higher prices for their ‘factory gate’ outputs 70 80 90 100 110 120 130 140 150 Jan-05 Nov-05 Sep-06 Jul-07 May-08 Mar-09 Jan-10 Nov-10 Sep-11 Jul-12 May-13 Mar-14 Jan-15 Nov-15 Sep-16 Jul-17 May-18 Mar-19 Jan-20 Nov-20 Sep-21 Jul-22 Price Index 2015 =100 Food input PPI Food output PPI Food input and output Producer Price Indices (PPI), UK, Jan 2005 to Sep 2022 Source: ONS, Business impacts and conditions survey Source: ONS, PPI 0% 20% 40% 60% 80% All businesses Food Services Food Retailing Food Manufacturing Food Wholesaling Percentage of business (10+ employees) who have had to pass on price increases to customers, UK October 2022 Sep-22 Note: Food input includes beverages and tobacco products; food outputs include outputs of food products only. @ONSfocus #CostOfLiving slido #251022
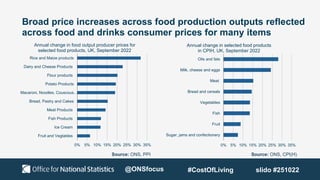
- 26. Broad price increases across food production outputs reflected across food and drinks consumer prices for many items 0% 5% 10% 15% 20% 25% 30% 35% Sugar, jams and confectionery Fruit Fish Vegetables Bread and cereals Meat Milk, cheese and eggs Oils and fats Annual change in selected food products in CPIH, UK, September 2022 0% 5% 10% 15% 20% 25% 30% 35% Fruit and Vegtables Ice Cream Fish Products Meat Products Bread, Pastry and Cakes Macaroni, Noodles, Couscous… Potato Products Flour products Dairy and Cheese Products Rice and Maize products Annual change in food output producer prices for selected food products, UK, September 2022 Source: ONS, CPI(H) Source: ONS, PPI @ONSfocus #CostOfLiving slido #251022
- 27. Production and consumer prices for food and beverages have risen sharply in recent months 60 70 80 90 100 110 120 130 140 150 2005 JAN 2006 APR 2007 JUL 2008 OCT 2010 JAN 2011 APR 2012 JUL 2013 OCT 2015 JAN 2016 APR 2017 JUL 2018 OCT 2020 JAN 2021 APR 2022 JUL Price Indices 2015 = 100 Food input producer prices, food output producer prices and food consumer prices including owner occupiers housing costs (CPIH) indices, Jan 2005 – September 2022, UK, 2015 = 100 Food input PPI Food output PPI Food CPIH Source: ONS, PPI and CPI(H) Notes: Food input includes beverages and tobacco products; food outputs include outputs of food products only; food CPIH includes non-alcoholic drinks, Annual Growth September 2022 CPIH 14.6% Input PPI 19.3% Output PPI 14.8% @ONSfocus #CostOfLiving slido #251022
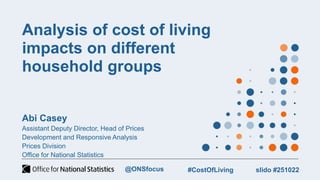
- 28. Analysis of cost of living impacts on different household groups Abi Casey Assistant Deputy Director, Head of Prices Development and Responsive Analysis Prices Division Office for National Statistics slido #251022 #CostOfLiving @ONSfocus
- 29. Consumer prices Designed to reflect the experiences of different types of households Household experience HCIs – Household Cost Indices CPIH and CPI Subgroup analysis Household experience
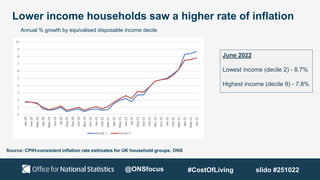
- 30. Lower income households saw a higher rate of inflation Annual % growth by equivalised disposable income decile Source: CPIH-consistent inflation rate estimates for UK household groups, ONS June 2022 Lowest income (decile 2) - 8.7% Highest income (decile 9) - 7.8% @ONSfocus #CostOfLiving slido #251022
- 31. Subsidised renters saw a higher rate of inflation Annual % growth by household tenure status Source: CPIH-consistent inflation rate estimates for UK household groups, ONS June 2022 Subsidised renters – 9.8% Renters – 7.7% Owner-occupiers – 8.1% @ONSfocus #CostOfLiving slido #251022
- 32. How have prices changed for the lowest priced grocery items? @ONSfocus #CostOfLiving slido #251022
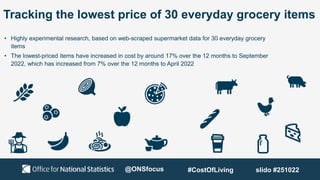
- 33. Tracking the lowest price of 30 everyday grocery items • Highly experimental research, based on web-scraped supermarket data for 30 everyday grocery items • The lowest-priced items have increased in cost by around 17% over the 12 months to September 2022, which has increased from 7% over the 12 months to April 2022 @ONSfocus #CostOfLiving slido #251022
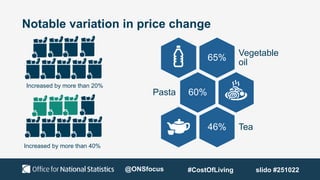
- 34. Notable variation in price change Increased by more than 20% Increased by more than 40% 65% Vegetable oil 60% Pasta 46% Tea @ONSfocus #CostOfLiving slido #251022
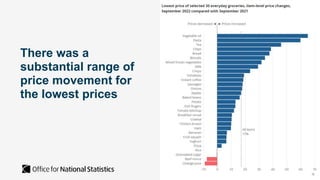
- 35. OFFSEN until 7AM 25 October There was a substantial range of price movement for the lowest prices
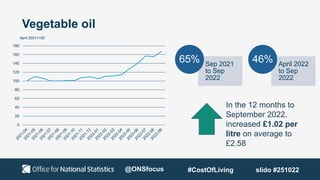
- 36. Sep 2021 to Sep 2022 65% April 2022 to Sep 2022 46% Vegetable oil In the 12 months to September 2022, increased £1.02 per litre on average to £2.58 0 20 40 60 80 100 120 140 160 180 April 2021=100 @ONSfocus #CostOfLiving slido #251022
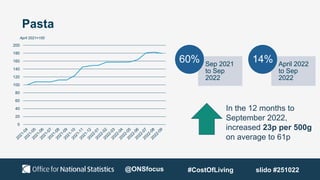
- 37. Sep 2021 to Sep 2022 60% April 2022 to Sep 2022 14% Pasta 0 20 40 60 80 100 120 140 160 180 200 In the 12 months to September 2022, increased 23p per 500g on average to 61p April 2021=100 #CostOfLiving @ONSfocus slido #251022
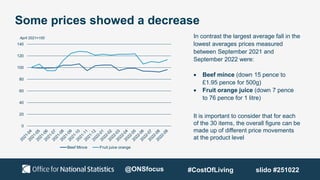
- 38. Some prices showed a decrease 0 20 40 60 80 100 120 140 Beef Mince Fruit juice orange In contrast the largest average fall in the lowest averages prices measured between September 2021 and September 2022 were: Beef mince (down 15 pence to £1.95 pence for 500g) Fruit orange juice (down 7 pence to 76 pence for 1 litre) It is important to consider that for each of the 30 items, the overall figure can be made up of different price movements at the product level April 2021=100 @ONSfocus #CostOfLiving slido #251022
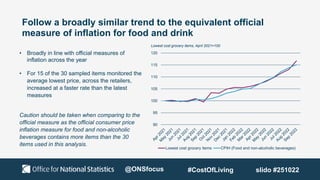
- 39. Follow a broadly similar trend to the equivalent official measure of inflation for food and drink 90 95 100 105 110 115 120 Lowest cost grocery items CPIH (Food and non-alcoholic beverages) • Broadly in line with official measures of inflation across the year • For 15 of the 30 sampled items monitored the average lowest price, across the retailers, increased at a faster rate than the latest measures Caution should be taken when comparing to the official measure as the official consumer price inflation measure for food and non-alcoholic beverages contains more items than the 30 items used in this analysis. Lowest cost grocery items, April 2021=100 @ONSfocus #CostOfLiving slido #251022
- 40. Questions can be submitted via slido using code #251022 Q&A @ONSfocus #CostOfLiving slido #251022
- 41. Understanding the cost of living through statistics Break slido #251022 #CostOfLiving @ONSfocus
- 42. Energy statistics and the cost of living Tim Vizard Assistant Deputy Director, Public Policy Analysis Office for National Statistics Jon Gough Assistant Deputy Director Business Insights and Conditions Survey (BICS) Office for National Statistics slido #251022 #CostOfLiving @ONSfocus
- 43. Cost of living – Public opinions and social trends from the Opinions and Lifestyle Survey Tim Vizard Assistant Deputy Director ONS Analytical Hub @TimVizardONS (Twitter) @ONSfocus #CostOfLiving slido #251022
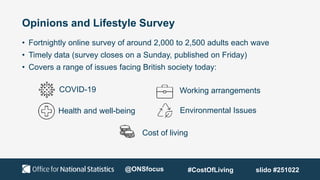
- 44. Opinions and Lifestyle Survey • Fortnightly online survey of around 2,000 to 2,500 adults each wave • Timely data (survey closes on a Sunday, published on Friday) • Covers a range of issues facing British society today: Environmental Issues Health and well-being COVID-19 Working arrangements Cost of living @ONSfocus #CostOfLiving slido #251022
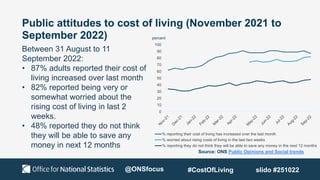
- 45. Source: ONS Public Opinions and Social trends Public attitudes to cost of living (November 2021 to September 2022) Between 31 August to 11 September 2022: • 87% adults reported their cost of living increased over last month • 82% reported being very or somewhat worried about the rising cost of living in last 2 weeks. • 48% reported they do not think they will be able to save any money in next 12 months percent 0 10 20 30 40 50 60 70 80 90 100 % reporting their cost of living has increased over the last month % worried about rising costs of living in the last two weeks % reporting they do not think they will be able to save any money in the next 12 months @ONSfocus #CostOfLiving slido #251022
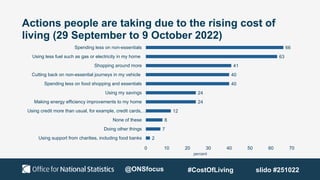
- 46. Actions people are taking due to the rising cost of living (29 September to 9 October 2022) 2 7 8 12 24 24 40 40 41 63 66 0 10 20 30 40 50 60 70 Using support from charities, including food banks Doing other things None of these Using credit more than usual, for example, credit cards,… Making energy efficiency improvements to my home Using my savings Spending less on food shopping and essentials Cutting back on non-essential journeys in my vehicle Shopping around more Using less fuel such as gas or electricity in my home Spending less on non-essentials percent @ONSfocus #CostOfLiving slido #251022
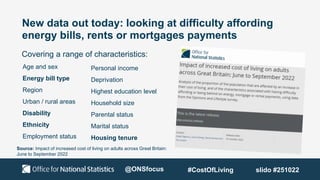
- 47. New data out today: looking at difficulty affording energy bills, rents or mortgages payments Age and sex Energy bill type Region Urban / rural areas Disability Ethnicity Employment status Personal income Deprivation Highest education level Household size Parental status Marital status Housing tenure Source: Impact of increased cost of living on adults across Great Britain: June to September 2022 Covering a range of characteristics: @ONSfocus #CostOfLiving slido #251022
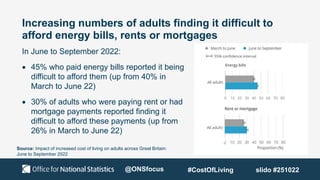
- 48. Increasing numbers of adults finding it difficult to afford energy bills, rents or mortgages In June to September 2022: 45% who paid energy bills reported it being difficult to afford them (up from 40% in March to June 22) 30% of adults who were paying rent or had mortgage payments reported finding it difficult to afford these payments (up from 26% in March to June 22) Awaiting Chart @ONSfocus Source: Impact of increased cost of living on adults across Great Britain: June to September 2022 #CostOfLiving slido #251022
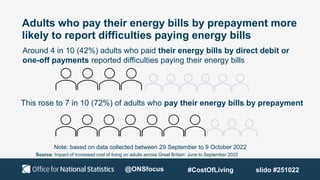
- 49. Adults who pay their energy bills by prepayment more likely to report difficulties paying energy bills This rose to 7 in 10 (72%) of adults who pay their energy bills by prepayment Around 4 in 10 (42%) adults who paid their energy bills by direct debit or one-off payments reported difficulties paying their energy bills Note: based on data collected between 29 September to 9 October 2022 @ONSfocus Source: Impact of increased cost of living on adults across Great Britain: June to September 2022 #CostOfLiving slido #251022
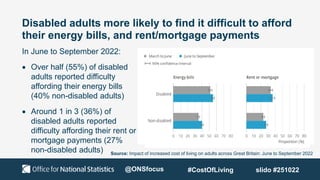
- 50. Disabled adults more likely to find it difficult to afford their energy bills, and rent/mortgage payments In June to September 2022: Over half (55%) of disabled adults reported difficulty affording their energy bills (40% non-disabled adults) Around 1 in 3 (36%) of disabled adults reported difficulty affording their rent or mortgage payments (27% non-disabled adults) @ONSfocus Source: Impact of increased cost of living on adults across Great Britain: June to September 2022 #CostOfLiving slido #251022
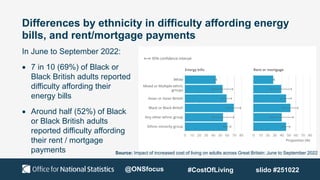
- 51. Differences by ethnicity in difficulty affording energy bills, and rent/mortgage payments In June to September 2022: 7 in 10 (69%) of Black or Black British adults reported difficulty affording their energy bills Around half (52%) of Black or Black British adults reported difficulty affording their rent / mortgage payments @ONSfocus Source: Impact of increased cost of living on adults across Great Britain: June to September 2022 #CostOfLiving slido #251022
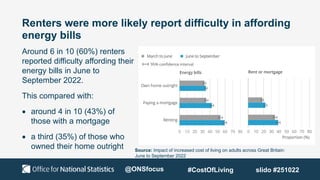
- 52. Renters were more likely report difficulty in affording energy bills Around 6 in 10 (60%) renters reported difficulty affording their energy bills in June to September 2022. This compared with: around 4 in 10 (43%) of those with a mortgage a third (35%) of those who owned their home outright @ONSfocus Source: Impact of increased cost of living on adults across Great Britain: June to September 2022 #CostOfLiving slido #251022
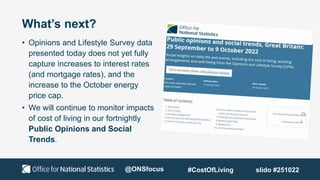
- 53. What’s next? • Opinions and Lifestyle Survey data presented today does not yet fully capture increases to interest rates (and mortgage rates), and the increase to the October energy price cap. • We will continue to monitor impacts of cost of living in our fortnightly Public Opinions and Social Trends. @ONSfocus #CostOfLiving slido #251022
- 54. Business perspective – Business Insights and Conditions Survey Jon Gough Assistant Deputy Director Business Insights and Conditions Survey (BICS) Office for National Statistics slido #251022 #CostOfLiving @ONSfocus
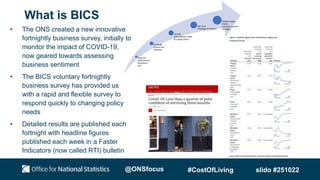
- 55. What is BICS • The ONS created a new innovative fortnightly business survey, initially to monitor the impact of COVID-19, now geared towards assessing business sentiment • The BICS voluntary fortnightly business survey has provided us with a rapid and flexible survey to respond quickly to changing policy needs • Detailed results are published each fortnight with headline figures published each week in a Faster Indicators (now called RTI) bulletin Financial performance Workforce size Furlough Grants and Schemes EU Exit International trade & supply chains Net zero Shortage of workers Global supply chains Increase in prices (energy) @ONSfocus #CostOfLiving slido #251022
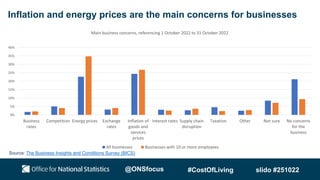
- 56. Inflation and energy prices are the main concerns for businesses 0% 5% 10% 15% 20% 25% 30% 35% 40% Business rates Competition Energy prices Exchange rates Inflation of goods and services prices Interest rates Supply chain disruption Taxation Other Not sure No concerns for the business Main business concerns, referencing 1 October 2022 to 31 October 2022 All businesses Businesses with 10 or more employees Source: The Business Insights and Conditions Survey (BICS) @ONSfocus #CostOfLiving slido #251022
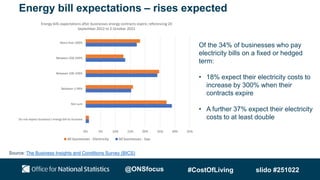
- 57. Of the 34% of businesses who pay electricity bills on a fixed or hedged term: • 18% expect their electricity costs to increase by 300% when their contracts expire • A further 37% expect their electricity costs to at least double 0% 5% 10% 15% 20% 25% 30% 35% Do not expect business's energy bill to increase Not sure Between 1-99% Between 100-199% Between 200-299% More than 300% Energy bills expectations after businesses energy contracts expire, referencing 20 September 2022 to 2 October 2022 All businesses - Electricity All businesses - Gas Energy bill expectations – rises expected Source: The Business Insights and Conditions Survey (BICS) @ONSfocus #CostOfLiving slido #251022
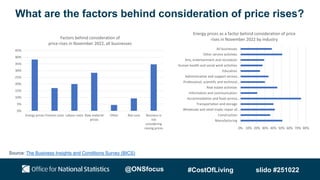
- 58. What are the factors behind consideration of price rises? 0% 5% 10% 15% 20% 25% 30% 35% 40% 45% Energy prices Finance costs Labour costs Raw material prices Other Not sure Business is not considering raising prices Factors behind consideration of price rises in November 2022, all businesses 0% 10% 20% 30% 40% 50% 60% 70% 80% Manufacturing Construction Wholesale and retail trade; repair of… Transportation and storage Accommodation and food service… Information and communication Real estate activities Professional, scientific and technical… Administrative and support service… Education Human health and social work activities Arts, entertainment and recreation Other service activities All businesses Energy prices as a factor behind consideration of price rises in November 2022 by industry Source: The Business Insights and Conditions Survey (BICS) @ONSfocus #CostOfLiving slido #251022
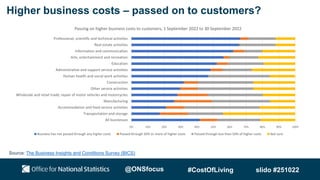
- 59. Higher business costs – passed on to customers? 0% 10% 20% 30% 40% 50% 60% 70% 80% 90% 100% All businesses Transportation and storage Accommodation and food service activities Manufacturing Wholesale and retail trade; repair of motor vehicles and motorcycles Other service activities Construction Human health and social work activities Administrative and support service activities Education Arts, entertainment and recreation Information and communication Real estate activities Professional, scientific and technical activities Passing on higher business costs to customers, 1 September 2022 to 30 September 2022 Business has not passed through any higher costs Passed through 50% or more of higher costs Passed through less than 50% of higher costs Not sure Source: The Business Insights and Conditions Survey (BICS) @ONSfocus #CostOfLiving slido #251022
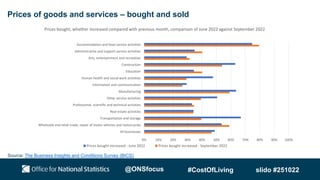
- 60. Prices of goods and services – bought and sold Source: The Business Insights and Conditions Survey (BICS) 0% 10% 20% 30% 40% 50% 60% 70% 80% 90% 100% All businesses Wholesale and retail trade; repair of motor vehicles and motorcycles Transportation and storage Real estate activities Professional, scientific and technical activities Other service activities Manufacturing Information and communication Human health and social work activities Education Construction Arts, entertainment and recreation Administrative and support service activities Accommodation and food service activities Prices bought, whether increased compared with previous month, comparison of June 2022 against September 2022 Prices bought increased - June 2022 Prices bought increased - September 2022 @ONSfocus #CostOfLiving slido #251022
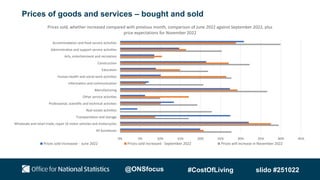
- 61. 0% 5% 10% 15% 20% 25% 30% 35% 40% 45% All businesses Wholesale and retail trade; repair of motor vehicles and motorcycles Transportation and storage Real estate activities Professional, scientific and technical activities Other service activities Manufacturing Information and communication Human health and social work activities Education Construction Arts, entertainment and recreation Administrative and support service activities Accommodation and food service activities Prices sold, whether increased compared with previous month, comparison of June 2022 against September 2022, plus price expectations for November 2022 Prices sold increased - June 2022 Prices sold increased - September 2022 Prices will increase in November 2022 Prices of goods and services – bought and sold @ONSfocus #CostOfLiving slido #251022
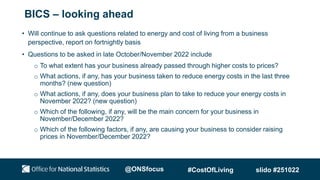
- 62. BICS – looking ahead • Will continue to ask questions related to energy and cost of living from a business perspective, report on fortnightly basis • Questions to be asked in late October/November 2022 include o To what extent has your business already passed through higher costs to prices? o What actions, if any, has your business taken to reduce energy costs in the last three months? (new question) o What actions, if any, does your business plan to take to reduce your energy costs in November 2022? (new question) o Which of the following, if any, will be the main concern for your business in November/December 2022? o Which of the following factors, if any, are causing your business to consider raising prices in November/December 2022? @ONSfocus #CostOfLiving slido #251022
- 63. Questions can be submitted via slido using code #251022 Q&A @ONSfocus #CostOfLiving slido #251022
- 64. Panel session: Cost of living analytical insights from different perspectives Chair – Sam Beckett Second Permanent Secretary Joint Head of the Government Economic Service Office for National Statistics slido #251022 #CostOfLiving @ONSfocus
- 65. Panel members • Charlotte Dendy, Head of Economic Surveys and Data, the CBI • Ashwin Kumar, Professor of Social Policy, Manchester Metropolitan University • Afzal Rahman, Policy Officer, the Trades Union Congress • Morgan Wild, Head of Policy, Citizens Advice slido #251022 #CostOfLiving @ONSfocus
- 66. Understanding the cost of living through statistics Lunch slido #251022 #CostOfLiving @ONSfocus
- 67. How inflation and cost of living statistics are evolving, and the opportunities for transformation Chair – Sam Beckett Peter Levell Associate Director, Institute for Fiscal Studies Omar Guerrero Head of Computational Social Science research The Alan Turing Institute slido #251022 #CostOfLiving @ONSfocus
- 68. @TheIFS Measuring the cost of living crisis Peter Levell, IFS
- 69. (Quiet) revolution underway in the way consumer price statistics are collected For many decades, prices have been collected in the same way Manual collection of prices for 700 representative items Around 180,000 prices collected each month This is rising to hundreds of millions of price quotes collected directly from retailers What does this mean? Large sample sizes Higher frequency (month to month price changes) Can include seasonal goods Greater opportunities for stratification by region Measuring the cost of living crisis © Institute for Fiscal Studies Big changes in the way prices are being collected
- 70. Measuring the cost of living crisis © Institute for Fiscal Studies What about inflation for different groups?
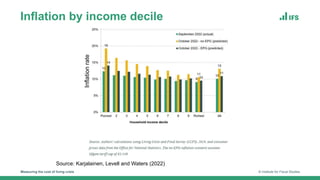
- 71. Measuring the cost of living crisis © Institute for Fiscal Studies Inflation by income decile Inflation rate Source: Karjalainen, Levell and Waters (2022)
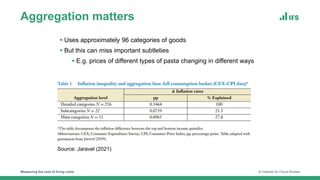
- 72. Measuring the cost of living crisis © Institute for Fiscal Studies Aggregation matters Source: Jaravel (2021) Uses approximately 96 categories of goods But this can miss important subtleties E.g. prices of different types of pasta changing in different ways
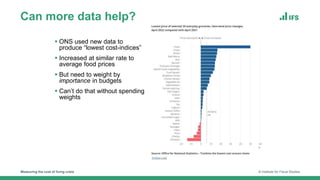
- 73. Can more data help? Measuring the cost of living crisis © Institute for Fiscal Studies ONS used new data to produce “lowest cost-indices” Increased at similar rate to average food prices But need to weight by importance in budgets Can’t do that without spending weights
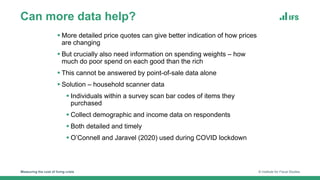
- 74. Can more data help? Measuring the cost of living crisis © Institute for Fiscal Studies More detailed price quotes can give better indication of how prices are changing But crucially also need information on spending weights – how much do poor spend on each good than the rich This cannot be answered by point-of-sale data alone Solution – household scanner data Individuals within a survey scan bar codes of items they purchased Collect demographic and income data on respondents Both detailed and timely O’Connell and Jaravel (2020) used during COVID lockdown
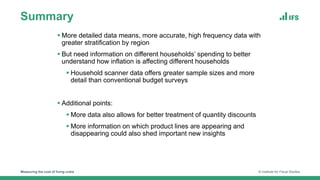
- 75. Summary Measuring the cost of living crisis © Institute for Fiscal Studies More detailed data means, more accurate, high frequency data with greater stratification by region But need information on different households’ spending to better understand how inflation is affecting different households Household scanner data offers greater sample sizes and more detail than conventional budget surveys Additional points: More data also allows for better treatment of quantity discounts More information on which product lines are appearing and disappearing could also shed important new insights
- 76. The Institute for Fiscal Studies 7 Ridgmount Street London WC1E 7AE www.ifs.org.uk
- 77. The Alan Turing Institute @guerrero_oa 77 Dr Omar A Guerrero Head of Computational Social Science Research The Alan Turing Institute How data + AI can help understanding inequality and enhancing policymaking
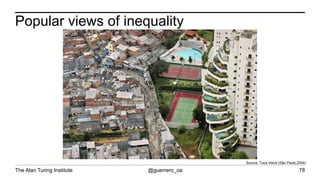
- 78. The Alan Turing Institute @guerrero_oa Popular views of inequality 78 Source: Tuca Vieira (São Paulo,2004)
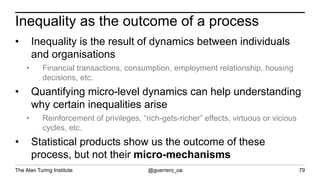
- 79. The Alan Turing Institute @guerrero_oa Inequality as the outcome of a process 79 • Inequality is the result of dynamics between individuals and organisations • Financial transactions, consumption, employment relationship, housing decisions, etc. • Quantifying micro-level dynamics can help understanding why certain inequalities arise • Reinforcement of privileges, “rich-gets-richer” effects, virtuous or vicious cycles, etc. • Statistical products show us the outcome of these process, but not their micro-mechanisms
- 80. The Alan Turing Institute @guerrero_oa Why AI? 80 • As data becomes more granular and social scientists document more evidence about micro-level mechanisms, it becomes more difficult to develop dynamic models • Heterogeneous agents • Bounded rationality • Disequilibrium dynamics • Decentralised interactions • Complex interaction topologies • Policy evaluation and design often demand a systemic view and nuanced counterfactuals
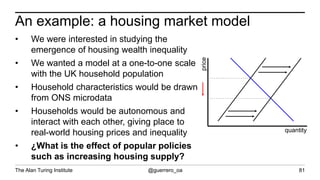
- 81. The Alan Turing Institute @guerrero_oa An example: a housing market model price quantity • We were interested in studying the emergence of housing wealth inequality • We wanted a model at a one-to-one scale with the UK household population • Household characteristics would be drawn from ONS microdata • Households would be autonomous and interact with each other, giving place to real-world housing prices and inequality • ¿What is the effect of popular policies such as increasing housing supply? 81
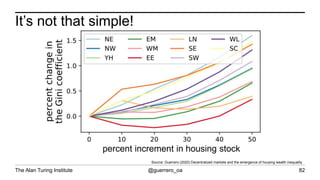
- 82. The Alan Turing Institute @guerrero_oa It’s not that simple! 82 Source: Guerrero (2020) Decentralized markets and the emergence of housing wealth inequality percent increment in housing stock
- 83. The Alan Turing Institute @guerrero_oa 83 Thank you! oguerrero@turing.ac.uk @guerrero_oa
- 84. Questions can be submitted via slido using code #251022 Q&A slido #251022 #CostOfLiving @ONSfocus
- 85. Transformation of UK consumer price statistics Sofia Poni Assistant Deputy Director Consumer Prices Transformation, Prices Division Office for National Statistics slido #251022 #CostOfLiving @ONSfocus
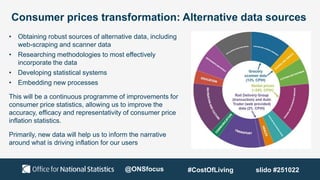
- 86. • Obtaining robust sources of alternative data, including web-scraping and scanner data • Researching methodologies to most effectively incorporate the data • Developing statistical systems • Embedding new processes This will be a continuous programme of improvements for consumer price statistics, allowing us to improve the accuracy, efficacy and representativity of consumer price inflation statistics. Primarily, new data will help us to inform the narrative around what is driving inflation for our users Consumer prices transformation: Alternative data sources @ONSfocus #CostOfLiving slido #251022
- 87. Data, methods and systems @ONSfocus #CostOfLiving slido #251022
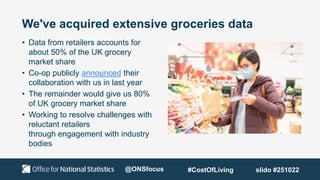
- 88. We've acquired extensive groceries data • Data from retailers accounts for about 50% of the UK grocery market share • Co-op publicly announced their collaboration with us in last year • The remainder would give us 80% of UK grocery market share • Working to resolve challenges with reluctant retailers through engagement with industry bodies @ONSfocus #CostOfLiving slido #251022
- 89. And rail fares and second-hand cars data • Doesn't require added functionality - we can incorporate into headline statistics from 2023 • Autotrader and Rail Delivery Group publicly announced our partnership in April, in the The Times @ONSfocus #CostOfLiving slido #251022
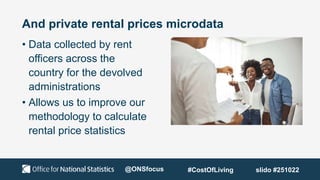
- 90. And private rental prices microdata • Data collected by rent officers across the country for the devolved administrations • Allows us to improve our methodology to calculate rental price statistics @ONSfocus #CostOfLiving slido #251022
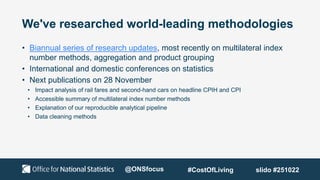
- 91. We've researched world-leading methodologies • Biannual series of research updates, most recently on multilateral index number methods, aggregation and product grouping • International and domestic conferences on statistics • Next publications on 28 November • Impact analysis of rail fares and second-hand cars on headline CPIH and CPI • Accessible summary of multilateral index number methods • Explanation of our reproducible analytical pipeline • Data cleaning methods @ONSfocus #CostOfLiving slido #251022
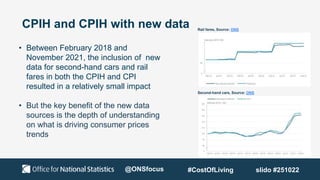
- 92. CPIH and CPIH with new data • Between February 2018 and November 2021, the inclusion of new data for second-hand cars and rail fares in both the CPIH and CPI resulted in a relatively small impact • But the key benefit of the new data sources is the depth of understanding on what is driving consumer prices trends Rail fares, Source: ONS Second-hand cars, Source: ONS @ONSfocus #CostOfLiving slido #251022
- 93. Informing the narrative @ONSfocus #CostOfLiving slido #251022
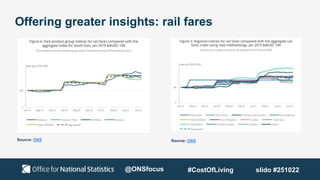
- 94. Offering greater insights: rail fares Source: ONS Source: ONS @ONSfocus #CostOfLiving slido #251022
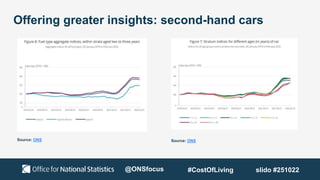
- 95. Offering greater insights: second-hand cars Source: ONS Source: ONS @ONSfocus #CostOfLiving slido #251022
- 96. What comes next? @ONSfocus #CostOfLiving slido #251022
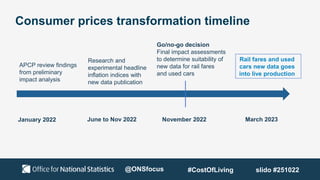
- 97. Consumer prices transformation timeline January 2022 June to Nov 2022 March 2023 November 2022 APCP review findings from preliminary impact analysis Research and experimental headline inflation indices with new data publication Go/no-go decision Final impact assessments to determine suitability of new data for rail fares and used cars Rail fares and used cars new data goes into live production @ONSfocus #CostOfLiving slido #251022
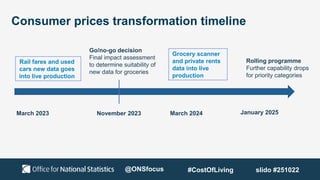
- 98. Consumer prices transformation timeline March 2023 November 2023 January 2025 March 2024 Go/no-go decision Final impact assessment to determine suitability of new data for groceries Rail fares and used cars new data goes into live production Rolling programme Further capability drops for priority categories Grocery scanner and private rents data into live production @ONSfocus #CostOfLiving slido #251022
- 99. Questions can be submitted via slido using code #251022 Q&A slido #251022 #CostOfLiving @ONSfocus
- 100. Understanding the cost of living through statistics Closing remarks Michael Hardie Deputy Director, Prices Office for National Statistics slido #251022 #CostOfLiving @ONSfocus
- 102. Thank you for attending the Understanding the cost of living through statistics event You can keep up to date on all upcoming events via ons.gov.uk/economicevents If you would like to ask a question or provide any feedback, please do so via economic.engagement@ons.gov.uk slido #251022 #CostOfLiving @ONSfocus
Editor's Notes
- #28: Price growth for food and non-alcoholic beverages have risen sharply over recent months. As mentioned by Matt, food and drinks prices for consumers rose by 14.6% in the 12 months to September 2022, which is estimated to be the highest rate since April 1980 This isn’t only true for consumer prices, with substantial price growth also recorded for food manufacturers. Subsequent presentations today will focus on Consumer Prices, so here I’d like to zoom onto produce prices, as these can in turn feed into final consumption prices and help explain some of their drivers. Prices of inputs into food production grew by 19.3% in September. The growth rate has been positive for over 2 years (26 months), and peaked in July 2022 at around 20% (20.2%). Data from the Business Insights and Conditions Survey (BICS) also show that around 70% of food manufacturers are more likely to report an increase in prices they paid for goods and materials ADD PERIOD, much higher than across all businesses at 56%. Similarly, the growth rate for prices charged by food manufacturers for their products has been positive for the past 40 months, and peaked at nearly 15% (14.8%) in the year to Sept 2022 - the highest recorded since series started in Jan 1997.
- #31: Check with Chris – this is because energy and food are a higher proportion for these households Add notes
- #32: Check with chris – definition of different tenure types Cechk with chris – reasons – is it mainly energy is a higher proportion for these households
- #35: For nine items, the lowest-cost price increased by more than 20% since September 2021, and for three of those nine items the lowest-cost price rose by 40% or more. The items where the lowest prices rose at the fastest rate between September 2021 and September 2022 were:
- #98: Publish impact analysis and experimental statistics incorporating new rail fares and second-hand cars data in November 2022 Engage with Office for Statistics Regulation and Advisory Panels on Consumer Prices to finalise 'Go/No-go' decision to incorporate rail fares and second-hand cars data into headline CPI and CPIH in 2023 Publish research, impact analysis and experimental statistics incorporating new groceries and rents data throughout 2023. Incorporate these into headline measures in 2024. Continue data acquisition and research on further priority item categories (household goods, clothing, energy)Publish impact analysis and experimental statistics incorporating new rail fares and second-hand cars data in November 2022