SlideShare a Scribd company logo
WELCOME
Dr. Subrata Kumer Sen
MBBS, MPH, BCS (Health)
Lecturer, Community Medicine
M Abdur Rahim Medical College
Dinajpur.
Statistics: The science of collecting, summarizing, and
analyzing data.
Biostatistics: The science of collecting, summarizing,
and analyzing biological data.
Medical Statistics: The science of collecting,
summarizing, and analyzing medical data.
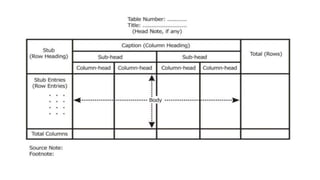
Vital Statistics: Statistics that deals with vital events.
Vital events are births, marriages, divorces, separations,
and deaths.
Sources of data for vital events/ statistics:
• National level- Census, BBS
• City Corporation/ Municipalities for births &
deaths
• Kaji Office for marriages, divorces, separations
• Notification of infectious diseases for deaths
• Hospital records for births & deaths
• Disease registers for deaths etc.
Uses of Biostatistics:
• Collection of information in the best possible scientific way.
• Simplification of huge, complex sets of data.
• Helps in the formulation of hypothesis and amplification of
ideas.
• Identification of association between two or more variables
by testing hypothesis.
• Helps in interpretation and drawing conclusion by analyzing
data
• By summarizing and presenting, helps policy makers to make
decisions based on scientific evidence.
Data: Data is a set of values collected during any type of scientific
investigation.
Data Classification:
Based on Source of Data:
I. Primary: Data directly collected at the field level during a study
II.Secondary: collected from another study, census data, hospital records
III.Tertiary: from textbooks.
Based on Nature of Data:
• Qualitative/ Categorical/ Nominal: Age, Sex, economical status
• Quantitative/ Numerical:
a. Continuous: Cont. spectrum/range can be fractioned (e.g. height, weight,
temperature)
b. Discrete: No continuity, Complete #, no fraction (e.g. Parity, patient
number in hospital)
Variable: Any characteristic which differs for one individual or
object to another.
Types:
A. According to Relationship:
1. Independent Variable
2. Intervening Variable
3. Dependent Variable
4. Confounding variable
B. According to Nature/ Characteristic:
1. Qualitative
2. Quantitative: Continuous & Discrete.
Measurement of Scale:
A.Qualitative-
1. Nominal (Sex, Religion)
2. Ordinal (Educational level, Economical Status)
B. Quantitative-
1. Interval (Temperature)
2. Ratio (age, height, weight)
Methods of Data Collection:
*Surveying Study population
*Interviewing: Face to Face, Telephone, Internet etc
*Observation: Participant, Non-participant
*Written Questionnaire
*Electronic Data Reporting
*Focus Group Discussion
*Document Review
Data collection tool (instrument):
•Questionnaire
•Interview schedule
•Checklist
•Other electronic device
Data Presentation:
A.Tabulation/ Tabular Presentation:
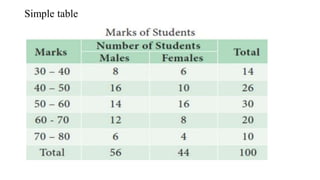
1. Simple Table
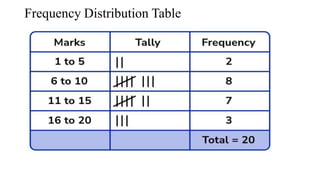
2. Frequency Distribution Table
B. Graphical Presentation:
1. Qualitative:
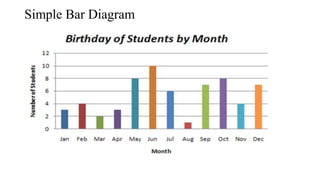
a. Bar diagram - Simple Bar Diagram, Multiple Bar diagram,
Component Bar Diagram
b. Pie/ sector chart
c. Pictogram
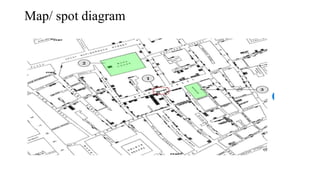
d. Map/ spot diagram
2. Quantitative:
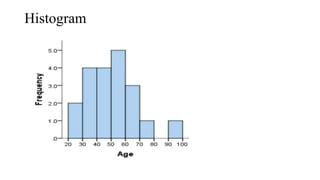
a. Histogram
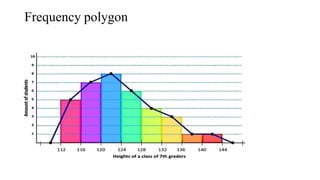
b. Frequency polygon
c. Frequency Curve
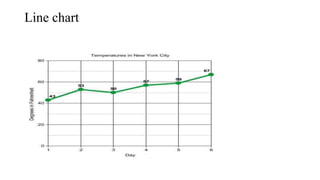
d. Line chart
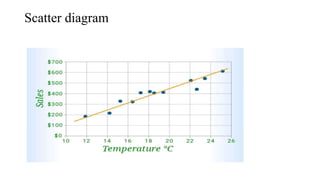
e. Scatter diagram
Characteristics of a table:
A table should have
i. Table number
ii. Title
iii. Body- a. Column b. Row
iv. Foot note/ Source (if any)
Biostatistics-C-2-Item-2pdf.pdf
Simple table
Frequency Distribution Table
Simple Bar Diagram
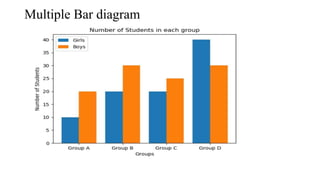
Multiple Bar diagram
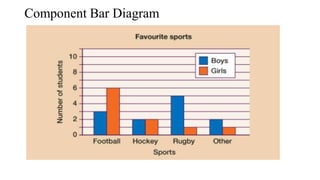
Component Bar Diagram
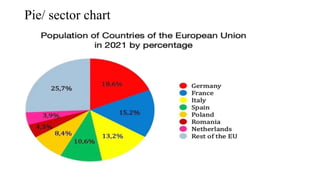
Pie/ sector chart
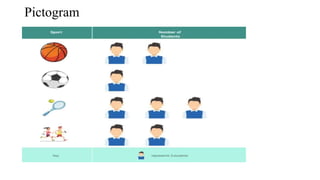
Pictogram
Map/ spot diagram
Histogram
Frequency polygon
Line chart
Scatter diagram
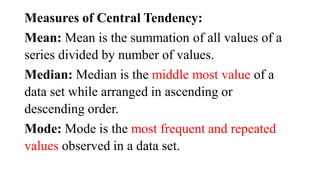
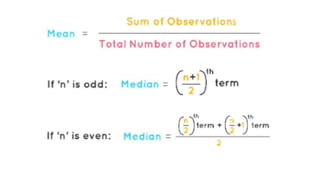
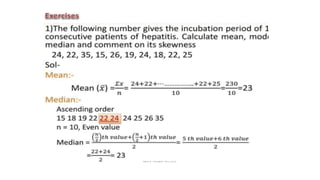
Measures of Central Tendency:
Mean: Mean is the summation of all values of a
series divided by number of values.
Median: Median is the middle most value of a
data set while arranged in ascending or
descending order.
Mode: Mode is the most frequent and repeated
values observed in a data set.
Biostatistics-C-2-Item-2pdf.pdf
Measures of Dispersion:
Range: Simply the difference between the largest and
smallest values in a set of data.
Mean Deviation: The mean deviation is an average of
absolute deviations of individual observations from the
central value of a series.
Standard Deviation: Standard deviation is the positive
square root of the mean-square deviations of the
observations from their arithmetic mean.
Population: A population is entire group of subjects or total
number of items about which information is desired.
Sample: Sample is a part of population describing the
characteristics of that population. The sample is drawn should
be representative of entire population.
Sampling: Sampling is the process of selection the sample
from a defined study population.
Sampling frame: When all the members or individuals of
population are listed by numbering then it is called sampling
frame.
Sampling methods/Techniques:
a) Random/ Probability/ Non-purposive/ Unbiased
sampling:
i) Simple random sampling (e.g. Lottery)
ii) Systematic random sampling
iii) Stratified random sampling
iv) Multistage sampling
v) Multiphase sampling
vi) Cluster Sampling
b) Non- Probability sampling:
i) Convenience or Judgment sampling
ii) Quota sampling
iii) Snowball sampling
THANK YOU
More Related Content

Similar to Biostatistics-C-2-Item-2pdf.pdf (20)

PPT
BIOSTATISTICS ethnics yefoelkgdar 1.ppt
Mohsen AL-solaimani
 
PDF
1 Introduction to Biostatistics.pdf
bayisahrsa
 
PPTX
Sources, types and collection of data.pptx
drmadhulikakgmu
 
PPTX
Principles of data collection.pptx
Dr. Chirag Sonkusare
 
PPTX
biostatistics-210618023858.pptx bbbbbbbbbb
RAMJIBANYADAV2
 
PDF
introduction Statistics.pdf introduction to the statistics
AliRiaz92
 
PPT
1. Biost. Introduction(2).ppt
muktarkedir459
 
PPTX
Chapter-one.pptx
AbebeNega
 
PPTX
Sample & data collection method,sample size estimation,variables
BipulBorthakur
 
PPTX
Basic medical statistics1234567891234567
shrikittu1008
 
PPT
Chapter 1 A.pptkgcludkyfo6r6idi5dumtdyrsys4y
playstore9ha
 
PPTX
Basic of Biostatistics and epidemology_1.pptx
haiderhighland
 
PPTX
Sample & data collection method,sample size estimation,variables
BipulBorthakur
 
PDF
6-Presentation shared.pdf
RehamAbuzaid1
 
PPTX
MAIN 2._biostatistics.pptx biostatistics
kavithagowda18
 
PPTX
Basic of Biostatisticsin the field of healthcare research.pptx
ZainyKhan9
 
PPTX
Basics of statistics
donthuraj
 
PPT
Intro_BiostatPG.ppt
victor431494
 
PPTX
Biostatics
Navneet Randhawa
 
PPTX
BIOSTATISTICS (MPT) 11 (1).pptx
VaishnaviElumalai
 
BIOSTATISTICS ethnics yefoelkgdar 1.ppt
Mohsen AL-solaimani
 
1 Introduction to Biostatistics.pdf
bayisahrsa
 
Sources, types and collection of data.pptx
drmadhulikakgmu
 
Principles of data collection.pptx
Dr. Chirag Sonkusare
 
biostatistics-210618023858.pptx bbbbbbbbbb
RAMJIBANYADAV2
 
introduction Statistics.pdf introduction to the statistics
AliRiaz92
 
1. Biost. Introduction(2).ppt
muktarkedir459
 
Chapter-one.pptx
AbebeNega
 
Sample & data collection method,sample size estimation,variables
BipulBorthakur
 
Basic medical statistics1234567891234567
shrikittu1008
 
Chapter 1 A.pptkgcludkyfo6r6idi5dumtdyrsys4y
playstore9ha
 
Basic of Biostatistics and epidemology_1.pptx
haiderhighland
 
Sample & data collection method,sample size estimation,variables
BipulBorthakur
 
6-Presentation shared.pdf
RehamAbuzaid1
 
MAIN 2._biostatistics.pptx biostatistics
kavithagowda18
 
Basic of Biostatisticsin the field of healthcare research.pptx
ZainyKhan9
 
Basics of statistics
donthuraj
 
Intro_BiostatPG.ppt
victor431494
 
Biostatics
Navneet Randhawa
 
BIOSTATISTICS (MPT) 11 (1).pptx
VaishnaviElumalai
 

Recently uploaded (20)

PPTX
Resolution of Trifascicular Heart Block with Effective Closure of Congenital ...
YasserMohammedHassan1
 
PPT
NT-proBNP — A Prognostic Marker of Long-Term Impairment in Sepsis Survivors
Sona Thesis Consultancy
 
PPTX
11 .Neurosurgery (part.1) cranial surgery.pptx
Bolan University of Medical and Health Sciences ,Quetta
 
PPTX
Autoimmune encephalitis clinical meet presentation.pptx
egudurureddy
 
PPTX
Important concept of the Pharmacology.pptx
Tasleem Haider
 
PPTX
Synopsis Writing Made Easy for PG Scholars and PG Guides
Dr KHALID B.M
 
PDF
Skeletal Muscle strcuture_Physiological properties
MedicoseAcademics
 
PPTX
Stroke Imaging: Fundamental principles and concepts
Dr. Aryan (Anish Dhakal)
 
PDF
clinical corelations of Muscle_Dystrophies & Myopathies
MedicoseAcademics
 
PPTX
Advanced_Biomaterials_Presentation_PhD_Level.pptx
St. Xavier's college, maitighar,Kathmandu
 
PDF
Medibyte-Best-PCD-Pharma-Franchise-in-India.pdf
Medibyte Pharma
 
PPT
General Survey lec 2 Post RN | Post BS Nursing Lecture
Islamabad Nursing College
 
PDF
Characteristics of whole skeletal muscle contraction
MedicoseAcademics
 
PPTX
molecular pharmaceutics m pharm ppt.pptx
abdulubed0701
 
PPTX
Strength-Duration (SD) Curve in Electrotherapy
BALAJI SOMA
 
PPTX
scope of research in nursing services.pptx
Pratiksha Rai
 
PDF
Mechanics of Muscle contraction_Lever system
MedicoseAcademics
 
PDF
Best Sexologist in Patna, Bihar Science behind Ejaculation Disorders: Dr. Sun...
Sexologist Dr. Sunil Dubey - Dubey Clinic
 
PDF
SCHIZOPHRENIA (ANTIPSYCHOTIC DRUGS)..pdf
SATENDRAPRADHAN1
 
PPTX
Unexplained Infertility: Newer Understanding
Sujoy Dasgupta
 
Resolution of Trifascicular Heart Block with Effective Closure of Congenital ...
YasserMohammedHassan1
 
NT-proBNP — A Prognostic Marker of Long-Term Impairment in Sepsis Survivors
Sona Thesis Consultancy
 
11 .Neurosurgery (part.1) cranial surgery.pptx
Bolan University of Medical and Health Sciences ,Quetta
 
Autoimmune encephalitis clinical meet presentation.pptx
egudurureddy
 
Important concept of the Pharmacology.pptx
Tasleem Haider
 
Synopsis Writing Made Easy for PG Scholars and PG Guides
Dr KHALID B.M
 
Skeletal Muscle strcuture_Physiological properties
MedicoseAcademics
 
Stroke Imaging: Fundamental principles and concepts
Dr. Aryan (Anish Dhakal)
 
clinical corelations of Muscle_Dystrophies & Myopathies
MedicoseAcademics
 
Advanced_Biomaterials_Presentation_PhD_Level.pptx
St. Xavier's college, maitighar,Kathmandu
 
Medibyte-Best-PCD-Pharma-Franchise-in-India.pdf
Medibyte Pharma
 
General Survey lec 2 Post RN | Post BS Nursing Lecture
Islamabad Nursing College
 
Characteristics of whole skeletal muscle contraction
MedicoseAcademics
 
molecular pharmaceutics m pharm ppt.pptx
abdulubed0701
 
Strength-Duration (SD) Curve in Electrotherapy
BALAJI SOMA
 
scope of research in nursing services.pptx
Pratiksha Rai
 
Mechanics of Muscle contraction_Lever system
MedicoseAcademics
 
Best Sexologist in Patna, Bihar Science behind Ejaculation Disorders: Dr. Sun...
Sexologist Dr. Sunil Dubey - Dubey Clinic
 
SCHIZOPHRENIA (ANTIPSYCHOTIC DRUGS)..pdf
SATENDRAPRADHAN1
 
Unexplained Infertility: Newer Understanding
Sujoy Dasgupta
 
Ad

Biostatistics-C-2-Item-2pdf.pdf

  • 2. Dr. Subrata Kumer Sen MBBS, MPH, BCS (Health) Lecturer, Community Medicine M Abdur Rahim Medical College Dinajpur.
  • 3. Statistics: The science of collecting, summarizing, and analyzing data. Biostatistics: The science of collecting, summarizing, and analyzing biological data. Medical Statistics: The science of collecting, summarizing, and analyzing medical data. Vital Statistics: Statistics that deals with vital events. Vital events are births, marriages, divorces, separations, and deaths.
  • 4. Sources of data for vital events/ statistics: • National level- Census, BBS • City Corporation/ Municipalities for births & deaths • Kaji Office for marriages, divorces, separations • Notification of infectious diseases for deaths • Hospital records for births & deaths • Disease registers for deaths etc.
  • 5. Uses of Biostatistics: • Collection of information in the best possible scientific way. • Simplification of huge, complex sets of data. • Helps in the formulation of hypothesis and amplification of ideas. • Identification of association between two or more variables by testing hypothesis. • Helps in interpretation and drawing conclusion by analyzing data • By summarizing and presenting, helps policy makers to make decisions based on scientific evidence.
  • 6. Data: Data is a set of values collected during any type of scientific investigation. Data Classification: Based on Source of Data: I. Primary: Data directly collected at the field level during a study II.Secondary: collected from another study, census data, hospital records III.Tertiary: from textbooks. Based on Nature of Data: • Qualitative/ Categorical/ Nominal: Age, Sex, economical status • Quantitative/ Numerical: a. Continuous: Cont. spectrum/range can be fractioned (e.g. height, weight, temperature) b. Discrete: No continuity, Complete #, no fraction (e.g. Parity, patient number in hospital)
  • 7. Variable: Any characteristic which differs for one individual or object to another. Types: A. According to Relationship: 1. Independent Variable 2. Intervening Variable 3. Dependent Variable 4. Confounding variable B. According to Nature/ Characteristic: 1. Qualitative 2. Quantitative: Continuous & Discrete.
  • 8. Measurement of Scale: A.Qualitative- 1. Nominal (Sex, Religion) 2. Ordinal (Educational level, Economical Status) B. Quantitative- 1. Interval (Temperature) 2. Ratio (age, height, weight)
  • 9. Methods of Data Collection: *Surveying Study population *Interviewing: Face to Face, Telephone, Internet etc *Observation: Participant, Non-participant *Written Questionnaire *Electronic Data Reporting *Focus Group Discussion *Document Review
  • 10. Data collection tool (instrument): •Questionnaire •Interview schedule •Checklist •Other electronic device
  • 11. Data Presentation: A.Tabulation/ Tabular Presentation: 1. Simple Table 2. Frequency Distribution Table B. Graphical Presentation: 1. Qualitative: a. Bar diagram - Simple Bar Diagram, Multiple Bar diagram, Component Bar Diagram b. Pie/ sector chart c. Pictogram d. Map/ spot diagram
  • 12. 2. Quantitative: a. Histogram b. Frequency polygon c. Frequency Curve d. Line chart e. Scatter diagram
  • 13. Characteristics of a table: A table should have i. Table number ii. Title iii. Body- a. Column b. Row iv. Foot note/ Source (if any)
  • 27. Measures of Central Tendency: Mean: Mean is the summation of all values of a series divided by number of values. Median: Median is the middle most value of a data set while arranged in ascending or descending order. Mode: Mode is the most frequent and repeated values observed in a data set.
  • 30. Measures of Dispersion: Range: Simply the difference between the largest and smallest values in a set of data. Mean Deviation: The mean deviation is an average of absolute deviations of individual observations from the central value of a series. Standard Deviation: Standard deviation is the positive square root of the mean-square deviations of the observations from their arithmetic mean.
  • 31. Population: A population is entire group of subjects or total number of items about which information is desired. Sample: Sample is a part of population describing the characteristics of that population. The sample is drawn should be representative of entire population. Sampling: Sampling is the process of selection the sample from a defined study population. Sampling frame: When all the members or individuals of population are listed by numbering then it is called sampling frame.
  • 32. Sampling methods/Techniques: a) Random/ Probability/ Non-purposive/ Unbiased sampling: i) Simple random sampling (e.g. Lottery) ii) Systematic random sampling iii) Stratified random sampling iv) Multistage sampling v) Multiphase sampling vi) Cluster Sampling
  • 33. b) Non- Probability sampling: i) Convenience or Judgment sampling ii) Quota sampling iii) Snowball sampling