CABT SHS Statistics & Probability - Mean and Variance of Sampling Distributions of Sample Means
Download as PPTX, PDF•79 likes•22,192 views

The document is a Grade 11 statistics lecture presentation that covers the mean and variance of sampling distributions of sample means. It explains the central limit theorem and provides examples of constructing sampling distributions and calculating their mean and variance for finite and infinite populations. Additionally, it discusses the effects of sampling with and without replacement, and introduces the finite population correction factor.


CABT SHS Statistics & Probability - Mean and Variance of Sampling Distributions of Sample Means
- 1. CABT Statistics & Probability – Grade 11 Lecture Presentation
- 3. Mean & Variance of Sampling Distributions of Sample Means A Grade 11 Statistics and Probability Lecture
- 4. At the end of this lesson, you are expected to: find the mean and variance of the sampling distribution of the sample means. state and explain the Central Limit Theorem. use the Central Limit Theorem to solve problems involving means and variances of sampling distribution of means. Lesson Objectives Mean and Variance of Sampling Distributions of Sample Means
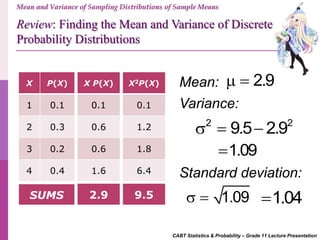
- 5. Review: Finding the Mean and Variance of Discrete Probability Distributions CABT Statistics & Probability – Grade 11 Lecture Presentation Mean and Variance of Sampling Distributions of Sample Means X P(X) 1 0.1 2 0.3 3 0.2 4 0.4 X P(X) 0.1 0.6 0.6 1.6 X2P(X) 0.1 1.2 1.8 6.4 2.9 9.5SUMS Mean: 2.9 Variance: 2 2 9.5 2.9 1.09 Standard deviation: 1.09 1.04
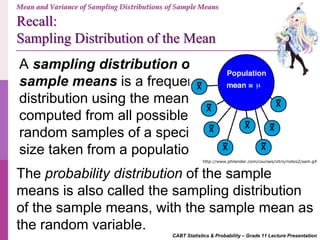
- 6. Recall: Sampling Distribution of the Mean CABT Statistics & Probability – Grade 11 Lecture Presentation A sampling distribution of sample means is a frequency distribution using the means computed from all possible random samples of a specific size taken from a population. The probability distribution of the sample means is also called the sampling distribution of the sample means, with the sample mean as the random variable. http://www.philender.com/courses/intro/notes2/sam.gif Mean and Variance of Sampling Distributions of Sample Means
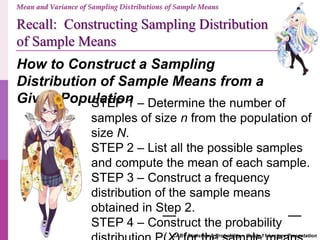
- 7. Recall: Constructing Sampling Distribution of Sample Means CABT Statistics & Probability – Grade 11 Lecture Presentation Mean and Variance of Sampling Distributions of Sample Means How to Construct a Sampling Distribution of Sample Means from a Given PopulationSTEP 1 – Determine the number of samples of size n from the population of size N. STEP 2 – List all the possible samples and compute the mean of each sample. STEP 3 – Construct a frequency distribution of the sample means obtained in Step 2. STEP 4 – Construct the probability
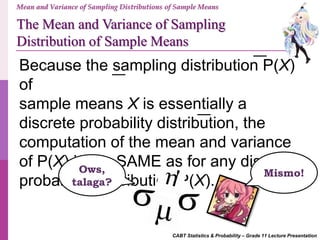
- 8. CABT Statistics & Probability – Grade 11 Lecture Presentation Mean and Variance of Sampling Distributions of Sample Means The Mean and Variance of Sampling Distribution of Sample Means Because the sampling distribution P(X) of sample means X is essentially a discrete probability distribution, the computation of the mean and variance of P(X) is the SAME as for any discrete probability distribution P(X). Ows, talaga? Mismo!
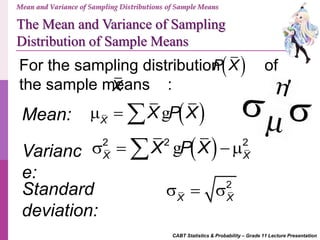
- 9. CABT Statistics & Probability – Grade 11 Lecture Presentation Mean and Variance of Sampling Distributions of Sample Means The Mean and Variance of Sampling Distribution of Sample Means For the sampling distribution of the sample means : Mean: X X P X g Varianc e: 2 2 2 X X X P X g Standard deviation: 2 X X P X X
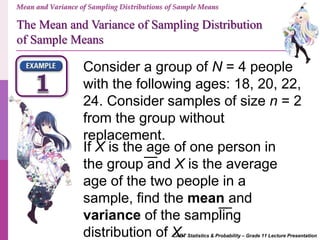
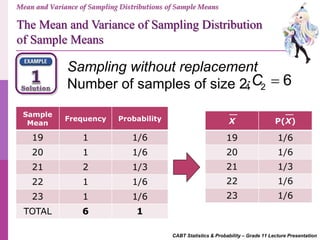
- 10. CABT Statistics & Probability – Grade 11 Lecture Presentation Consider a group of N = 4 people with the following ages: 18, 20, 22, 24. Consider samples of size n = 2 from the group without replacement. If X is the age of one person in the group and X is the average age of the two people in a sample, find the mean and variance of the sampling distribution of X. Mean and Variance of Sampling Distributions of Sample Means The Mean and Variance of Sampling Distribution of Sample Means
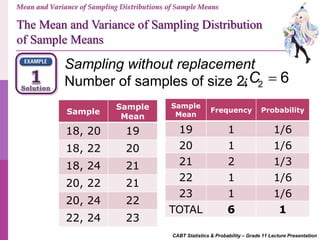
- 11. CABT Statistics & Probability – Grade 11 Lecture Presentation Sampling without replacement Number of samples of size 2:4 2 6C Sample Sample Mean 18, 20 19 18, 22 20 18, 24 21 20, 22 21 20, 24 22 22, 24 23 Sample Mean Frequency Probability 19 1 1/6 20 1 1/6 21 2 1/3 22 1 1/6 23 1 1/6 TOTAL 6 1 Mean and Variance of Sampling Distributions of Sample Means The Mean and Variance of Sampling Distribution of Sample Means
- 12. CABT Statistics & Probability – Grade 11 Lecture Presentation Sample Mean Frequency Probability 19 1 1/6 20 1 1/6 21 2 1/3 22 1 1/6 23 1 1/6 TOTAL 6 1 X P(X) 19 1/6 20 1/6 21 1/3 22 1/6 23 1/6 Mean and Variance of Sampling Distributions of Sample Means Sampling without replacement Number of samples of size 2:4 2 6C The Mean and Variance of Sampling Distribution of Sample Means
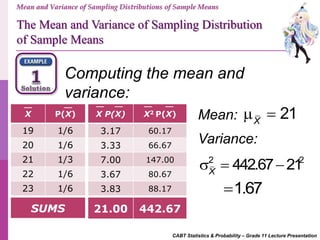
- 13. CABT Statistics & Probability – Grade 11 Lecture Presentation Computing the mean and variance: Mean and Variance of Sampling Distributions of Sample Means X P(X) 19 1/6 20 1/6 21 1/3 22 1/6 23 1/6 X P(X) X2 P(X) 3.17 60.17 3.33 66.67 7.00 147.00 3.67 80.67 3.83 88.17 21.00 442.67SUMS Mean: 21X Variance: 2 2 442.67 21X 1.67 The Mean and Variance of Sampling Distribution of Sample Means
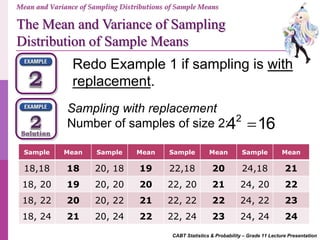
- 14. CABT Statistics & Probability – Grade 11 Lecture Presentation Redo Example 1 if sampling is with replacement. Mean and Variance of Sampling Distributions of Sample Means The Mean and Variance of Sampling Distribution of Sample Means Sampling with replacement Number of samples of size 2: 2 4 16 Sample Mean Sample Mean Sample Mean Sample Mean 18,18 18 20, 18 19 22,18 20 24,18 21 18, 20 19 20, 20 20 22, 20 21 24, 20 22 18, 22 20 20, 22 21 22, 22 22 24, 22 23 18, 24 21 20, 24 22 22, 24 23 24, 24 24
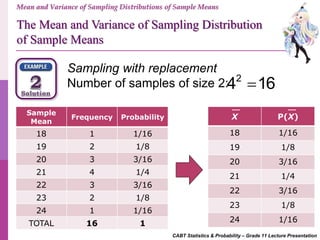
- 15. CABT Statistics & Probability – Grade 11 Lecture Presentation Mean and Variance of Sampling Distributions of Sample Means Sampling with replacement Number of samples of size 2: 2 4 16 Sample Mean Frequency Probability 18 1 1/16 19 2 1/8 20 3 3/16 21 4 1/4 22 3 3/16 23 2 1/8 24 1 1/16 TOTAL 16 1 X P(X) 18 1/16 19 1/8 20 3/16 21 1/4 22 3/16 23 1/8 24 1/16 The Mean and Variance of Sampling Distribution of Sample Means
- 16. CABT Statistics & Probability – Grade 11 Lecture Presentation Mean and Variance of Sampling Distributions of Sample Means The Mean and Variance of Sampling Distribution of Sample Means X P(X) 18 1/16 19 1/8 20 3/16 21 1/4 22 3/16 23 1/8 24 1/16 Computing the mean and variance: X P(X) X2 P(X) 1.13 20.25 2.38 45.13 3.75 75.00 5.25 110.25 4.13 90.75 2.88 66.13 1.50 36.00 21 443.5SUMS Mean: 21X Variance: 2 2 443.5 21X 2.5
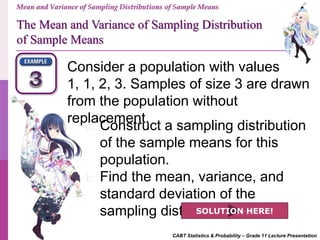
- 17. CABT Statistics & Probability – Grade 11 Lecture Presentation Mean and Variance of Sampling Distributions of Sample Means Consider a population with values 1, 1, 2, 3. Samples of size 3 are drawn from the population without replacement. a. Construct a sampling distribution of the sample means for this population. b. Find the mean, variance, and standard deviation of the sampling distribution.SOLUTION HERE! The Mean and Variance of Sampling Distribution of Sample Means
- 19. Intermission Number…
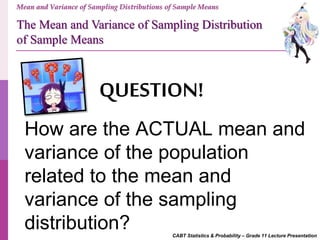
- 20. CABT Statistics & Probability – Grade 11 Lecture Presentation Mean and Variance of Sampling Distributions of Sample Means QUESTION! How are the ACTUAL mean and variance of the population related to the mean and variance of the sampling distribution? The Mean and Variance of Sampling Distribution of Sample Means
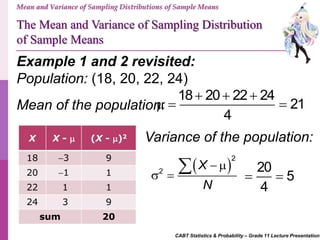
- 21. CABT Statistics & Probability – Grade 11 Lecture Presentation Example 1 and 2 revisited: Population: (18, 20, 22, 24) Mean and Variance of Sampling Distributions of Sample Means The Mean and Variance of Sampling Distribution of Sample Means Mean of the population: 18 20 22 24 21 4 X X - (X - )2 18 3 9 20 1 1 22 1 1 24 3 9 sum 20 Variance of the population: 2 2 X N 20 5 4
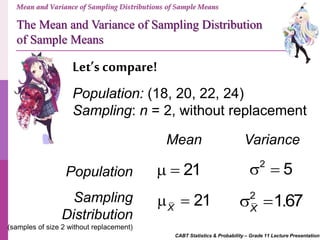
- 22. CABT Statistics & Probability – Grade 11 Lecture Presentation Let’s compare! Mean and Variance of Sampling Distributions of Sample Means Mean Variance Population Sampling Distribution (samples of size 2 without replacement) 21 21X 2 5 2 1.67X Population: (18, 20, 22, 24) Sampling: n = 2, without replacement The Mean and Variance of Sampling Distribution of Sample Means
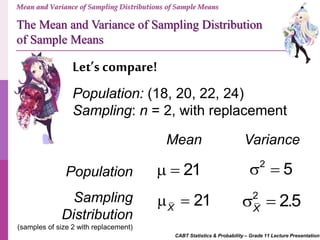
- 23. CABT Statistics & Probability – Grade 11 Lecture Presentation Let’s compare! Mean and Variance of Sampling Distributions of Sample Means Mean Variance Population Sampling Distribution (samples of size 2 with replacement) 21 21X 2 5 2 2.5X Population: (18, 20, 22, 24) Sampling: n = 2, with replacement The Mean and Variance of Sampling Distribution of Sample Means
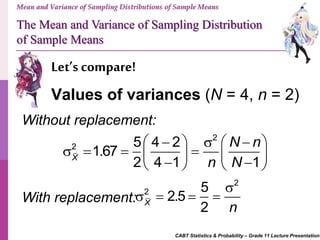
- 24. CABT Statistics & Probability – Grade 11 Lecture Presentation Let’s compare! Mean and Variance of Sampling Distributions of Sample Means Values of variances (N = 4, n = 2) The Mean and Variance of Sampling Distribution of Sample Means Without replacement: 2 2 5 4 2 1.67 2 4 1 1X N n n N With replacement: 2 2 5 2.5 2X n
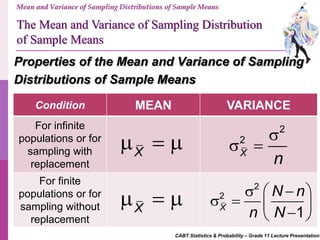
- 25. CABT Statistics & Probability – Grade 11 Lecture Presentation Mean and Variance of Sampling Distributions of Sample Means Properties of the Mean and Variance of Sampling Distributions of Sample Means The Mean and Variance of Sampling Distribution of Sample Means Condition MEAN VARIANCE For infinite populations or for sampling with replacement For finite populations or for sampling without replacement X X 2 2 X n 2 2 1X N n n N
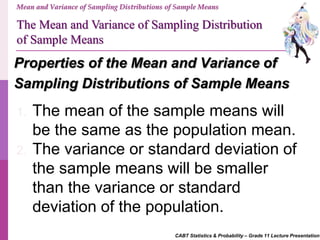
- 26. CABT Statistics & Probability – Grade 11 Lecture Presentation Mean and Variance of Sampling Distributions of Sample Means Properties of the Mean and Variance of Sampling Distributions of Sample Means The Mean and Variance of Sampling Distribution of Sample Means 1. The mean of the sample means will be the same as the population mean. 2. The variance or standard deviation of the sample means will be smaller than the variance or standard deviation of the population.
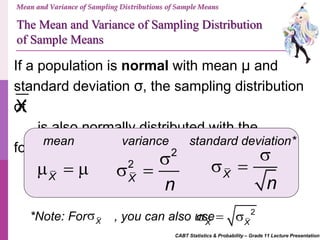
- 27. CABT Statistics & Probability – Grade 11 Lecture Presentation Mean and Variance of Sampling Distributions of Sample Means If a population is normal with mean μ and standard deviation σ, the sampling distribution of is also normally distributed with the following: X The Mean and Variance of Sampling Distribution of Sample Means mean standard deviation*variance X 2 2 X n X n *Note: For , you can also useX 2 X X
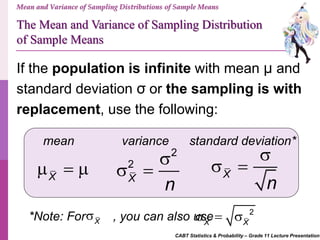
- 28. CABT Statistics & Probability – Grade 11 Lecture Presentation Mean and Variance of Sampling Distributions of Sample Means If the population is infinite with mean μ and standard deviation σ or the sampling is with replacement, use the following: mean standard deviation*variance X 2 2 X n X n The Mean and Variance of Sampling Distribution of Sample Means *Note: For , you can also useX 2 X X
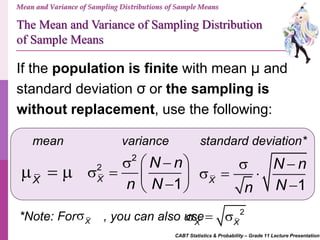
- 29. CABT Statistics & Probability – Grade 11 Lecture Presentation Mean and Variance of Sampling Distributions of Sample Means If the population is finite with mean μ and standard deviation σ or the sampling is without replacement, use the following: mean standard deviation*variance X 2 2 1X N n n N The Mean and Variance of Sampling Distribution of Sample Means 1X N n Nn *Note: For , you can also useX 2 X X
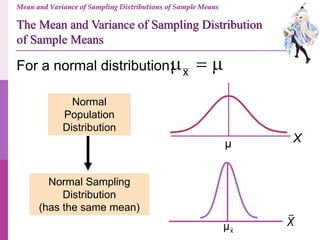
- 30. Normal Population Distribution Normal Sampling Distribution (has the same mean) x Mean and Variance of Sampling Distributions of Sample Means The Mean and Variance of Sampling Distribution of Sample Means μ X xμ X For a normal distribution:
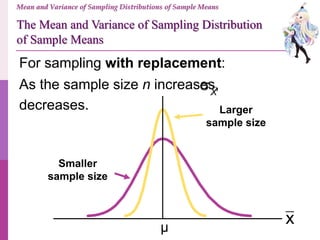
- 31. For sampling with replacement: Larger sample size Smaller sample size xμ Mean and Variance of Sampling Distributions of Sample Means The Mean and Variance of Sampling Distribution of Sample Means As the sample size n increases, decreases. X
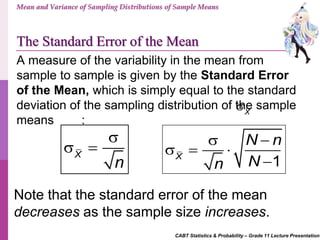
- 32. CABT Statistics & Probability – Grade 11 Lecture Presentation Mean and Variance of Sampling Distributions of Sample Means The Standard Error of the Mean A measure of the variability in the mean from sample to sample is given by the Standard Error of the Mean, which is simply equal to the standard deviation of the sampling distribution of the sample means : Note that the standard error of the mean decreases as the sample size increases. X X n 1X N n Nn
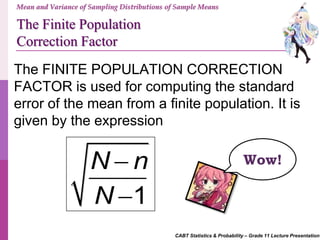
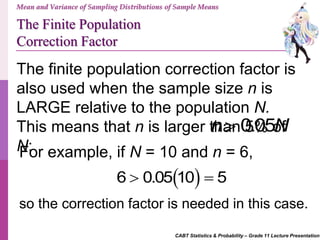
- 33. CABT Statistics & Probability – Grade 11 Lecture Presentation Mean and Variance of Sampling Distributions of Sample Means The Finite Population Correction Factor 1 N n N The FINITE POPULATION CORRECTION FACTOR is used for computing the standard error of the mean from a finite population. It is given by the expression Wow!
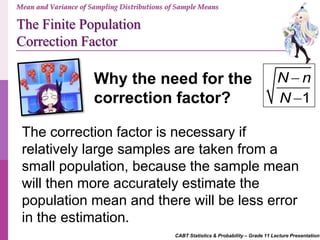
- 34. CABT Statistics & Probability – Grade 11 Lecture Presentation Mean and Variance of Sampling Distributions of Sample Means The Finite Population Correction Factor The correction factor is necessary if relatively large samples are taken from a small population, because the sample mean will then more accurately estimate the population mean and there will be less error in the estimation. Why the need for the correction factor? 1 N n N
- 35. CABT Statistics & Probability – Grade 11 Lecture Presentation Mean and Variance of Sampling Distributions of Sample Means The Finite Population Correction Factor The finite population correction factor is also used when the sample size n is LARGE relative to the population N. This means that n is larger than 5% of N: 0.05n N For example, if N = 10 and n = 6, 6 0.05 10 5 so the correction factor is needed in this case.
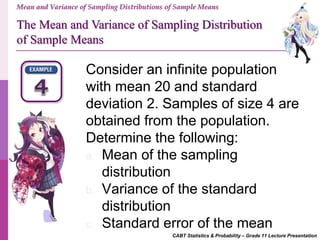
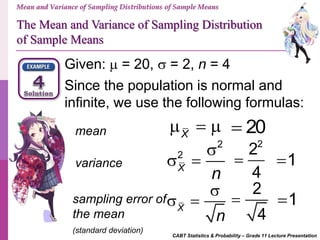
- 36. CABT Statistics & Probability – Grade 11 Lecture Presentation Consider an infinite population with mean 20 and standard deviation 2. Samples of size 4 are obtained from the population. Determine the following: a. Mean of the sampling distribution b. Variance of the standard distribution c. Standard error of the mean Mean and Variance of Sampling Distributions of Sample Means The Mean and Variance of Sampling Distribution of Sample Means
- 37. Mean and Variance of Sampling Distributions of Sample Means The Mean and Variance of Sampling Distribution of Sample Means CABT Statistics & Probability – Grade 11 Lecture Presentation Given: = 20, = 2, n = 4 Since the population is normal and infinite, we use the following formulas: mean sampling error of the mean (standard deviation) variance X 2 2 X n X n 20 2 2 4 1 2 4 1
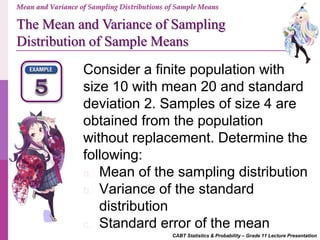
- 38. CABT Statistics & Probability – Grade 11 Lecture Presentation Mean and Variance of Sampling Distributions of Sample Means The Mean and Variance of Sampling Distribution of Sample Means Consider a finite population with size 10 with mean 20 and standard deviation 2. Samples of size 4 are obtained from the population without replacement. Determine the following: a. Mean of the sampling distribution b. Variance of the standard distribution c. Standard error of the mean
- 39. Mean and Variance of Sampling Distributions of Sample Means The Mean and Variance of Sampling Distributions of Sample Means CABT Statistics & Probability – Grade 11 Lecture Presentation Given: = 20, = 2, n = 4, N = 10 Since the population is finite and sampling is without replacement, we use the following formulas: mean sampling error of the mean (standard deviation) variance X 2 2 1X N n n N 2 X X 20 2 2 10 4 4 10 1 2 0.67X 0.67 0.82
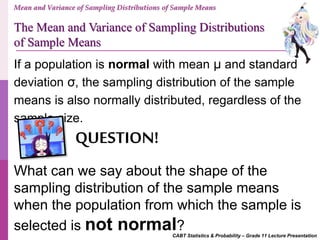
- 41. CABT Statistics & Probability – Grade 11 Lecture Presentation If a population is normal with mean μ and standard deviation σ, the sampling distribution of the sample means is also normally distributed, regardless of the sample size. What can we say about the shape of the sampling distribution of the sample means when the population from which the sample is selected is not normal? QUESTION! Mean and Variance of Sampling Distributions of Sample Means The Mean and Variance of Sampling Distributions of Sample Means
- 42. The Central Limit Theorem “The World is Normal” Theorem
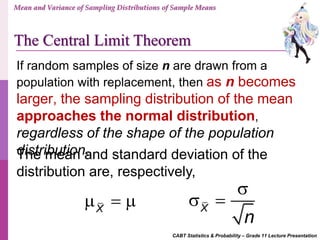
- 43. CABT Statistics & Probability – Grade 11 Lecture Presentation X X n The mean and standard deviation of the distribution are, respectively, If random samples of size n are drawn from a population with replacement, then as n becomes larger, the sampling distribution of the mean approaches the normal distribution, regardless of the shape of the population distribution. Mean and Variance of Sampling Distributions of Sample Means The Central Limit Theorem
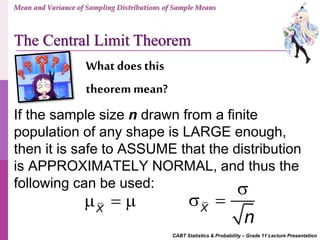
- 44. CABT Statistics & Probability – Grade 11 Lecture Presentation What does this theorem mean? If the sample size n drawn from a finite population of any shape is LARGE enough, then it is safe to ASSUME that the distribution is APPROXIMATELY NORMAL, and thus the following can be used: X X n Mean and Variance of Sampling Distributions of Sample Means The Central Limit Theorem
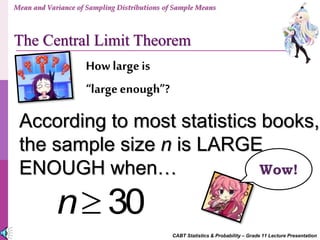
- 45. CABT Statistics & Probability – Grade 11 Lecture Presentation How largeis “largeenough”? According to most statistics books, the sample size n is LARGE ENOUGH when… 30n Wow! Mean and Variance of Sampling Distributions of Sample Means The Central Limit Theorem
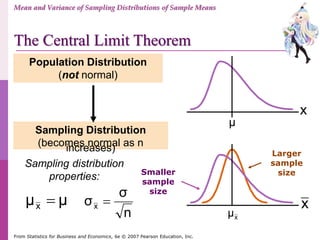
- 46. From Statistics for Business and Economics, 6e © 2007 Pearson Education, Inc. Population Distribution (not normal) Sampling Distribution (becomes normal as nincreases) Larger sample sizeSmaller sample size Sampling distribution properties: μμx n σ σx x μ Mean and Variance of Sampling Distributions of Sample Means The Central Limit Theorem x xμ
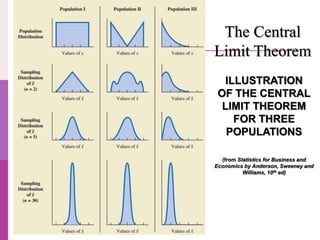
- 47. The Central Limit Theorem ILLUSTRATION OF THE CENTRAL LIMIT THEOREM FOR THREE POPULATIONS (from Statistics for Business and Economics by Anderson, Sweeney and Williams, 10th ed)
- 48. CABT Statistics & Probability – Grade 11 Lecture Presentation Two things to remember in using the Central Limit Theorem: 1. When the original variable is normally distributed, the distribution of the sample means will be normally distributed for any sample size n. 2. When the distribution of the original variable might not be normal, a sample size of 30 or more is needed to use a normal distribution to approximate the distribution of the sample means. The larger the sample, the better the approximation will be. Mean and Variance of Sampling Distributions of Sample Means The Central Limit Theorem
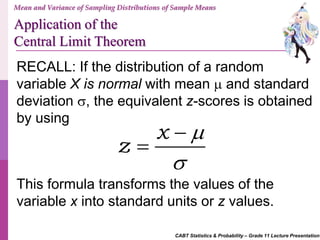
- 49. CABT Statistics & Probability – Grade 11 Lecture Presentation RECALL: If the distribution of a random variable X is normal with mean and standard deviation , the equivalent z-scores is obtained by using x z This formula transforms the values of the variable x into standard units or z values. Mean and Variance of Sampling Distributions of Sample Means Application of the Central Limit Theorem
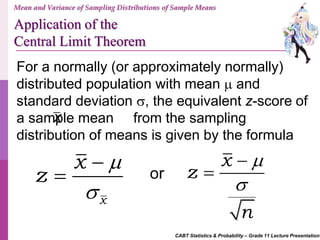
- 50. CABT Statistics & Probability – Grade 11 Lecture Presentation For a normally (or approximately normally) distributed population with mean and standard deviation , the equivalent z-score of a sample mean from the sampling distribution of means is given by the formula x x x z x z n or Mean and Variance of Sampling Distributions of Sample Means Application of the Central Limit Theorem
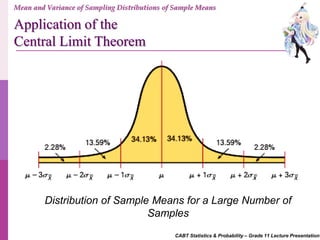
- 51. CABT Statistics & Probability – Grade 11 Lecture Presentation Distribution of Sample Means for a Large Number of Samples Mean and Variance of Sampling Distributions of Sample Means Application of the Central Limit Theorem
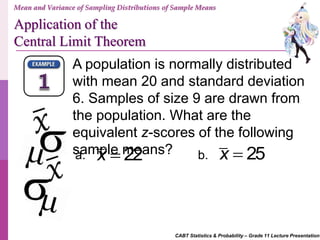
- 52. CABT Statistics & Probability – Grade 11 Lecture Presentation A population is normally distributed with mean 20 and standard deviation 6. Samples of size 9 are drawn from the population. What are the equivalent z-scores of the following sample means?a. b.22x 25x Mean and Variance of Sampling Distributions of Sample Means Application of the Central Limit Theorem
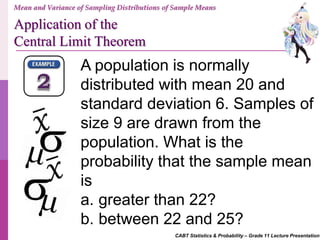
- 53. CABT Statistics & Probability – Grade 11 Lecture Presentation A population is normally distributed with mean 20 and standard deviation 6. Samples of size 9 are drawn from the population. What is the probability that the sample mean is a. greater than 22? b. between 22 and 25? Mean and Variance of Sampling Distributions of Sample Means Application of the Central Limit Theorem
- 54. CABT Statistics & Probability – Grade 11 Lecture Presentation A population has mean 50 and standard deviation 12. Samples of size 36 are drawn from the population. What is the probability that the sample mean is a. less than 48? b. between 42 and 50? c. greater than 53.5? Mean and Variance of Sampling Distributions of Sample Means Application of the Central Limit Theorem
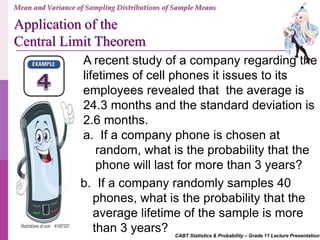
- 55. CABT Statistics & Probability – Grade 11 Lecture Presentation A recent study of a company regarding the lifetimes of cell phones it issues to its employees revealed that the average is 24.3 months and the standard deviation is 2.6 months. a. If a company phone is chosen at random, what is the probability that the phone will last for more than 3 years? b. If a company randomly samples 40 phones, what is the probability that the average lifetime of the sample is more than 3 years? Mean and Variance of Sampling Distributions of Sample Means Application of the Central Limit Theorem
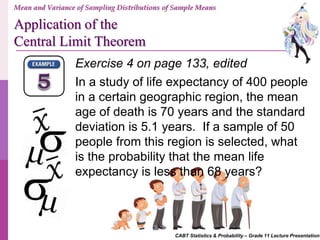
- 56. CABT Statistics & Probability – Grade 11 Lecture Presentation Exercise 4 on page 133, edited In a study of life expectancy of 400 people in a certain geographic region, the mean age of death is 70 years and the standard deviation is 5.1 years. If a sample of 50 people from this region is selected, what is the probability that the mean life expectancy is less than 68 years? Mean and Variance of Sampling Distributions of Sample Means Application of the Central Limit Theorem
- 57. CABT Statistics & Probability – Grade 11 Lecture Presentation Check your understandingDo Exercise 2 on page 132 and Extension A#1 on p. 133 of your Mean and Variance of Sampling Distributions of Sample Means
- 58. CABT Statistics & Probability – Grade 11 Lecture Presentation Assignment Do Exercise #1 on p. 132, due on Thursday, August 25. Mean and Variance of Sampling Distributions of Sample Means Quiz on the Central Limit Theorem on Tuesday, September
- 61. Thankyou!
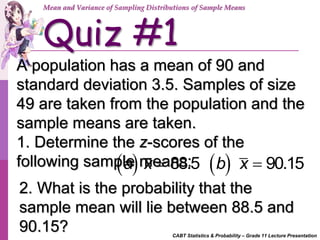
- 62. CABT Statistics & Probability – Grade 11 Lecture Presentation Quiz #1 A population has a mean of 90 and standard deviation 3.5. Samples of size 49 are taken from the population and the sample means are taken. 1. Determine the z-scores of the following sample means: Mean and Variance of Sampling Distributions of Sample Means 88.5 90.15a x b x 2. What is the probability that the sample mean will lie between 88.5 and 90.15?