


Introduction of statistics and probability
- 2. 1.Recall the different concepts in statistic; 2.Classify, organize and gathering data; 3.Understand the different scales of data measurement; 4.Calculate measures of central tendency, position and variability; 5.Differentiate Permutation from combination; and 6.Understand the basic probability concept.
- 3. Describe and differentiate the following measure of central tendency? 1. range 2. Mean 3. Median 4. Mode
- 4. Describe and differentiate the following measure of central tendency? 1. range 2. Mean 3. Median 4. Mode
- 5. is the science that deals with the collection, organization and presentation, analysis and interpretation of all kinds of data pertinent to the study being considered, so that the meaningful conclusion can be drawn.
- 6. Aids in decision making by providing comparison of data, explains action that has taken place, justify a claim or assertion, predicts future outcome and estimates un known quantities. Summarizes data for public use
- 7. In Biological and medical sciences, it helps researchers discover relationship worthy of further attention. Ex. A doctor can use statistics to determine to what extent is an increase in blood pressure dependent upon age In social sciences, it guides researchers and helps them support theories and models that cannot stand on rationale alone. Ex. Empirical studies are using statistics to obtain socio-economic profile of the middle class to form new socio-political theories
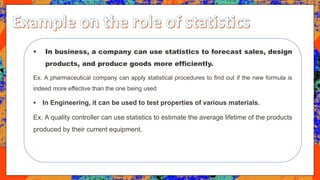
- 8. In business, a company can use statistics to forecast sales, design products, and produce goods more efficiently. Ex. A pharmaceutical company can apply statistical procedures to find out if the new formula is indeed more effective than the one being used In Engineering, it can be used to test properties of various materials. Ex. A quality controller can use statistics to estimate the average lifetime of the products produced by their current equipment.
- 9. is a group of statistical measurements that aims to provide the basic characteristics of a data set through tables and graphs and other descriptive measures such as measure of central tendency, measures of position and measures of variation.
- 10. aims to infer or to make interpretations by making a concluding statement about the population based on the results derived from the data set. Measures commonly used inferential statistics include analysis of variance, t-test, chi square test, correlation and regression analysis.
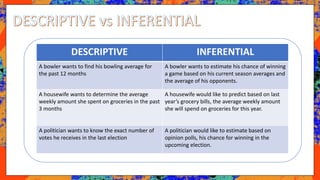
- 11. DESCRIPTIVE INFERENTIAL A bowler wants to find his bowling average for the past 12 months A bowler wants to estimate his chance of winning a game based on his current season averages and the average of his opponents. A housewife wants to determine the average weekly amount she spent on groceries in the past 3 months A housewife would like to predict based on last year’s grocery bills, the average weekly amount she will spend on groceries for this year. A politician wants to know the exact number of votes he receives in the last election A politician would like to estimate based on opinion polls, his chance for winning in the upcoming election.
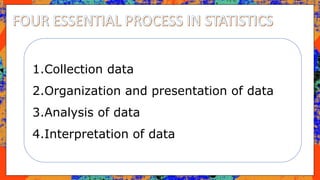
- 12. 1.Collection data 2.Organization and presentation of data 3.Analysis of data 4.Interpretation of data
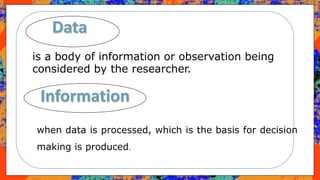
- 13. is a body of information or observation being considered by the researcher. when data is processed, which is the basis for decision making is produced.
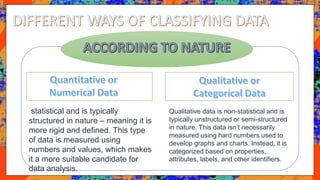
- 14. statistical and is typically structured in nature – meaning it is more rigid and defined. This type of data is measured using numbers and values, which makes it a more suitable candidate for data analysis. Qualitative data is non-statistical and is typically unstructured or semi-structured in nature. This data isn’t necessarily measured using hard numbers used to develop graphs and charts. Instead, it is categorized based on properties, attributes, labels, and other identifiers.
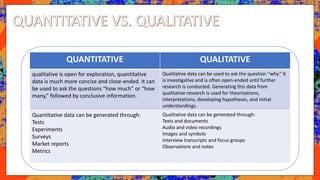
- 15. QUANTITATIVE QUALITATIVE qualitative is open for exploration, quantitative data is much more concise and close-ended. It can be used to ask the questions “how much” or “how many,” followed by conclusive information. Qualitative data can be used to ask the question “why.” It is investigative and is often open-ended until further research is conducted. Generating this data from qualitative research is used for theorizations, interpretations, developing hypotheses, and initial understandings. Quantitative data can be generated through: Tests Experiments Surveys Market reports Metrics Qualitative data can be generated through: Texts and documents Audio and video recordings Images and symbols Interview transcripts and focus groups Observations and notes
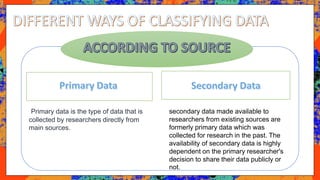
- 16. Primary data is the type of data that is collected by researchers directly from main sources. secondary data made available to researchers from existing sources are formerly primary data which was collected for research in the past. The availability of secondary data is highly dependent on the primary researcher's decision to share their data publicly or not.
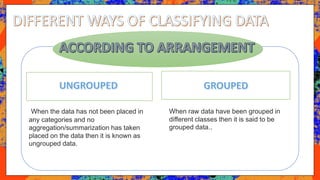
- 17. When the data has not been placed in any categories and no aggregation/summarization has taken placed on the data then it is known as ungrouped data. When raw data have been grouped in different classes then it is said to be grouped data..
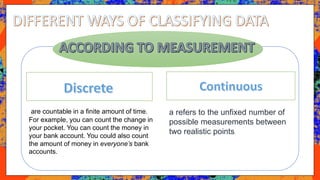
- 18. are countable in a finite amount of time. For example, you can count the change in your pocket. You can count the money in your bank account. You could also count the amount of money in everyone’s bank accounts. a refers to the unfixed number of possible measurements between two realistic points.
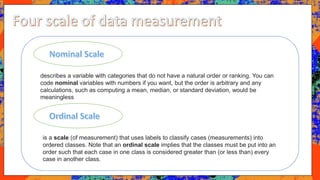
- 19. describes a variable with categories that do not have a natural order or ranking. You can code nominal variables with numbers if you want, but the order is arbitrary and any calculations, such as computing a mean, median, or standard deviation, would be meaningless is a scale (of measurement) that uses labels to classify cases (measurements) into ordered classes. Note that an ordinal scale implies that the classes must be put into an order such that each case in one class is considered greater than (or less than) every case in another class.
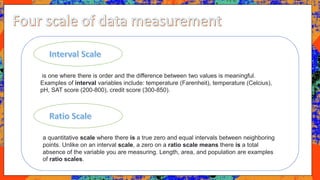
- 20. is one where there is order and the difference between two values is meaningful. Examples of interval variables include: temperature (Farenheit), temperature (Celcius), pH, SAT score (200-800), credit score (300-850). a quantitative scale where there is a true zero and equal intervals between neighboring points. Unlike on an interval scale, a zero on a ratio scale means there is a total absence of the variable you are measuring. Length, area, and population are examples of ratio scales.