SlideShare a Scribd company logo
STATISTICS
PRESENTATION
PRESENTED BY:
AREEBA SULTAN, AMMARA MANZOOR, GHAYUR KHALID WERYAH,
ALI HUSSAIN, AYESHA SHAFQAT.
DEFINATION OF STATISTICS
• The practice or science of collecting and
analysing numerical data in large quantities.
• A branch of mathematics dealing with the
collection, analysis, interpretation, and
presentation of masses of numerical data.
• A collection of quantitative data.
EXAMPLE OF STATISTICS
• In a class, the collection of marks obtained by 50 students is the
description of data. Now when we take out the mean of the data, the
result is the average of marks of 50 students. If the average mark
obtained by 50 students is 88 out of 100, then we can reach to a
conclusion or give a judgment on the basis of the result.
STATISTICAL DATA LAYOUT WITH
CHART
4.3
2.5
3.5
4.5
2.4
4.4
1.8
2.8
2 2
3
5
0
1
2
3
4
5
6
BUDGET 1ST YEAR BUDGET 2ND YEAR BUDGET 3RD YEAR BUDGET 4TH YEAR
INFLATION PROFITS CURRENT ACCOUNT DEFICITS
TYPES OF STATISTICS
Statistics have majorly categorised into two types:
1. Descriptive Statistics.
2. Inferential Statistics.
DESCRIPTIVE STATISTICS
• In this type of statistics, the data is summarised through the given
observations. The summarisation is one from a sample of population
using parameters such as the mean or standard deviation.
• Descriptive statistics is a way to organise, represent and describe a
collection of data using tables, graphs, and summary measures.
• For Example, the collection of people in a city using the internet or using
Television.
DESCRIPTIVE STATISTICS
Descriptive statistics are also categorised into four different
categories:
• Measure of frequency.
• Measure of dispersion.
• Measure of central tendency.
• Measure of position.
The frequency measurement displays the number of times a particular data
occurs. Range, Variance, Standard Deviation are measures of dispersion. It
identifies the spread of data.
INFERENTIAL STATISTICS
• This type of statistics is used to interpret the meaning of Descriptive
statistics. That means once the data has been collected, analysed and
summarised then we use these stats to describe the meaning of the
collected data.
• It is used to draw conclusions from the data that depends on random
variations such as observational errors, sampling variation, etc.
• Inferential Statistics is a method that allows us to use information
collected from a sample to make decisions, predictions or inferences from
a population.
• For Example, deriving estimates from hypothetical research.
IMPORTANCE OF STATISTICS
 Statistics executes the work simply and gives a transparent picture of the
work we do regularly.
 The statistical methods help us to examine different areas such as
medicine, business, economics, social science and others.
 Statistics equips us with different kinds of organised data with the help
of graphs, tables, diagrams and charts.
IMPORTANCE OF STATISTICS
 Statistics helps to understand the variability of the data pattern in a
quantitative way.
 Statistics makes us understand the bulk of data in a simple way.
 Statistics is the way to collecting accurate quantitative data.
USE OF STATISTICS IN REAL LIFE
• Statistics play an important role in real life,
especially in large industries, where data is
computed in bulk. It helps to collect, analyse
and interpret the data. Also, with the help of
statistical graphs, charts and tables we can
easily present the data.
APPLICATIONS OF STATISTICS IN
DIFFERENT FIELDS
• Statistics plays a vital role in every field of human activity. Statistics
helps in determining the existing position of per capita income,
unemployment, population growth rates, housing, schooling medical
facilities, etc., in a country.
• statistics holds a central position in almost every field, including industry,
commerce, trade, physics, chemistry, economics, mathematics, biology,
botany, psychology, astronomy, etc., so the application of statistics is very
wide.
• “Now we shall discuss some important fields in which statistics is
commonly applied in the next slides.”
APPLICATIONS OF STATISTICS
BUSINESS
• Statistics plays an important role in business. A successful businessman
must be very quick and accurate in decision making. He knows what his
customers want; he should therefore know what to produce and sell and
in what quantities.
• Statistics helps businessmen to plan production according to the taste of
the customers, and the quality of the products can also be checked more
efficiently by using statistical methods. Thus, it can be seen that all
business activities are based on statistical information.
APPLICATIONS OF STATISTICS
ECNOMICS
• Economics largely depends upon statistics. National income accounts are
multipurpose indicators for economists and administrators, and
statistical methods are used to prepare these accounts.
• In economics research, statistical methods are used to collect and analyse
the data and test hypotheses. The relationship between supply and
demand is studied by statistical methods; imports and exports, inflation
rates, and per capita income are problems which require a good
knowledge of statistics.
APPLICATIONS OF STATISTICS
SOCIAL SCIENCES
• Statistics plays a vital role in almost all the social sciences.
• Statistical methods are commonly used for analysing experiments results,
and testing their significance in biology, physics, chemistry, mathematics,
meteorology, research, chambers of commerce, sociology, business, public
administration, communications and information technology, etc.
ADVANTAGES AND DISADVANTAGES OF
STATISTICS
ADVANTAGES
• The bulk data can be presented
in a precise and definite form.
• The comparison and conclusions
of data becomes easy.
• Forecasting the trends becomes
easy with statistics.
DISADVANTAGES
• The statistical data can lead to
misuse.
• There are chances of errors
becomes easy when the
statistical methods are not done
by the experts.
• For the comparison of the data,
the data should be homogeneous
and uniform.
SAMPLING
• Sampling is a statistical procedure that is concerned with the selection of
the individual observation; it helps us to make statistical inferences about
the population.
• Quality assurance, and survey methodology, sampling is the selection of a
subset of individuals from within a statistical population to estimate
characteristics of the whole population. Statisticians attempt to collect
samples that are representative of the population in question.
EXAMPLE OF SAMPLING
• if a drug manufacturer would like to research the adverse side effects of a
drug on the country’s population, it is almost impossible to conduct a
research study that involves everyone.
• In this case, the researcher decides a sample of people from each
demographic and then researches them, giving him/her indicative
feedback on the drug’s behaviour.
CHARACTERISTICS OF SAMPLING
•In sampling, we assume that samples are drawn from the population
and sample means and population means are equal. A population can be
defined as a whole that includes all items and characteristics of the
research taken into study. However, gathering all this information is time
consuming and costly. We therefore make inferences about the population
with the help of samples.
TYPES OF SAMPLING
TYPES OF SAMPLING ARE AS FOLLOWS:
• Probability Sampling.
• Non-Probability Sampling.
“Let’s take a closer look at these two methods of sampling”.
PROBABILITY SAMPLING
• Probability sampling is a sampling technique where a researcher sets a
selection of a few criteria and chooses members of a population randomly.
All the members have an equal opportunity to be a part of the sample
with this selection parameter.
• Sampling technique in which researchers choose samples from a larger
population using a method based on the theory of probability. This
sampling method considers every member of the population and forms
samples based on a fixed process.
• FOR EXAMPLE, In a population of 1000 members, every member will
have a 1/1000 chance of being selected to be a part of a sample.
Probability sampling eliminates bias in the population and gives all
members a fair chance to be included in the sample.
TYPES OF PROBABILITY
There are four types of probability sampling techniques:
1. SIMPLE RANDOM SAMPLING.
2. CLUSTER SAMPLING.
3. SYSTEMATIC SAMPLING.
4. STARTIFIED RANDOM SAMPLING.
USES OF PROBABILITY STATISTICS
• Reduce Sample Bias: Using the probability sampling method, the
bias in the sample derived from a population is negligible to non-existent.
The selection of the sample mainly depicts the understanding and the
inference of the researcher. Probability sampling leads to higher quality
data collection as the sample appropriately represents the population.
• Diverse Population: When the population is vast and diverse, it is
essential to have adequate representation so that the data is not skewed
towards one demographic. For example, if Square would like to
understand the people that could make their point-of-sale devices, a
survey conducted from a sample of people across the US from different
industries and socio-economic backgrounds helps.
NON-PROBABILITY STATISTICS
• The non-probability method is a sampling method that involves a
collection of feedback based on a researcher or statistician’s sample
selection capabilities and not on a fixed selection process.
• The output of a survey conducted with a non-probable sample leads to
skewed results, which may not represent the desired target population.
But, there are situations such as the preliminary stages of research or
cost constraints for conducting research, where non-probability sampling
will be much more useful than the other type.
TYPES OF NON-PROBABILITY
STATISTICS
1. CONVINCING SAMPLING
2. JUDGMENTAL SAMPLING.
3. SNOWBALL SAMPLING.
4. QOUTA SAMPLING.
USES OF NON-PROBABILITY SAMPLING
• Create a hypothesis: Researchers use the non-probability sampling
method to create an assumption when limited to no prior information is
available. This method helps with the immediate return of data and
builds a base for further research.
• Exploratory research: Researchers use this sampling technique widely
when conducting qualitative research, pilot studies, or exploratory
research.
• Budget and time constraints: The non-probability method when there are
budget and time constraints, and some preliminary data must be
collected. Since the survey design is not rigid, it is easier to pick
respondents at random and have them take the survey or questionnaire.
DIFFERENCE BETWEEN PROBABILITY AND
NON-PROBABILITY SAMPLING
PROBABILITY SAMPLING
• Probability Sampling is a
sampling technique in which
samples from a larger population
are chosen using a method based
on the theory of probability.
• Random sampling method.
• The population is selected
randomly.
• Since there is a method for
deciding the sample, the
population demographics are
conclusively represented.
NON-PROBABILITY
SAMPLING
• Non-probability sampling is a
sampling technique in which the
researcher selects samples based
on the researcher’s subjective
judgment rather than random
selection.
• Non-Random sampling method.
• The population is selected
arbitrarily.
• Since the sampling method is
arbitrary, the population
demographics representation is
almost always skewed.
THANKYOU
MADE BY:
GHAYUR KHALID WERYAH (053)
GREY SECTION
Ad

More Related Content

What's hot (20)

sampling
samplingsampling
sampling
Deepshree Sharma
 
Logistic regression
Logistic regressionLogistic regression
Logistic regression
VARUN KUMAR
 
Multivariate analysis
Multivariate analysisMultivariate analysis
Multivariate analysis
Subodh Khanal
 
Independent sample t test
Independent sample t testIndependent sample t test
Independent sample t test
Shajar Khan
 
1.1 statistical and critical thinking
1.1 statistical and critical thinking1.1 statistical and critical thinking
1.1 statistical and critical thinking
Long Beach City College
 
Sampling Distribution
Sampling DistributionSampling Distribution
Sampling Distribution
Cumberland County Schools
 
Pearson Product Moment Correlation - Thiyagu
Pearson Product Moment Correlation - ThiyaguPearson Product Moment Correlation - Thiyagu
Pearson Product Moment Correlation - Thiyagu
Thiyagu K
 
Linear models for data science
Linear models for data scienceLinear models for data science
Linear models for data science
Brad Klingenberg
 
Chi-square distribution
Chi-square distribution Chi-square distribution
Chi-square distribution
Habibullah Bahar University College
 
Confidence Intervals
Confidence IntervalsConfidence Intervals
Confidence Intervals
mandalina landy
 
Anova single factor
Anova single factorAnova single factor
Anova single factor
Dhruv Patel
 
Testing Hypothesis
Testing HypothesisTesting Hypothesis
Testing Hypothesis
Azmi Mohd Tamil
 
Estimation in statistics
Estimation in statisticsEstimation in statistics
Estimation in statistics
Rabea Jamal
 
Introduction to Probability and Probability Distributions
Introduction to Probability and Probability DistributionsIntroduction to Probability and Probability Distributions
Introduction to Probability and Probability Distributions
Jezhabeth Villegas
 
INFERENTIAL STATISTICS: AN INTRODUCTION
INFERENTIAL STATISTICS: AN INTRODUCTIONINFERENTIAL STATISTICS: AN INTRODUCTION
INFERENTIAL STATISTICS: AN INTRODUCTION
John Labrador
 
Hypothesis testing ppt final
Hypothesis testing ppt finalHypothesis testing ppt final
Hypothesis testing ppt final
piyushdhaker
 
Descriptive Statistics
Descriptive StatisticsDescriptive Statistics
Descriptive Statistics
Neny Isharyanti
 
Simple linear regression
Simple linear regressionSimple linear regression
Simple linear regression
RekhaChoudhary24
 
Estimation and hypothesis
Estimation and hypothesisEstimation and hypothesis
Estimation and hypothesis
Junaid Ijaz
 
Multiple Linear Regression II and ANOVA I
Multiple Linear Regression II and ANOVA IMultiple Linear Regression II and ANOVA I
Multiple Linear Regression II and ANOVA I
James Neill
 
Logistic regression
Logistic regressionLogistic regression
Logistic regression
VARUN KUMAR
 
Multivariate analysis
Multivariate analysisMultivariate analysis
Multivariate analysis
Subodh Khanal
 
Independent sample t test
Independent sample t testIndependent sample t test
Independent sample t test
Shajar Khan
 
Pearson Product Moment Correlation - Thiyagu
Pearson Product Moment Correlation - ThiyaguPearson Product Moment Correlation - Thiyagu
Pearson Product Moment Correlation - Thiyagu
Thiyagu K
 
Linear models for data science
Linear models for data scienceLinear models for data science
Linear models for data science
Brad Klingenberg
 
Anova single factor
Anova single factorAnova single factor
Anova single factor
Dhruv Patel
 
Estimation in statistics
Estimation in statisticsEstimation in statistics
Estimation in statistics
Rabea Jamal
 
Introduction to Probability and Probability Distributions
Introduction to Probability and Probability DistributionsIntroduction to Probability and Probability Distributions
Introduction to Probability and Probability Distributions
Jezhabeth Villegas
 
INFERENTIAL STATISTICS: AN INTRODUCTION
INFERENTIAL STATISTICS: AN INTRODUCTIONINFERENTIAL STATISTICS: AN INTRODUCTION
INFERENTIAL STATISTICS: AN INTRODUCTION
John Labrador
 
Hypothesis testing ppt final
Hypothesis testing ppt finalHypothesis testing ppt final
Hypothesis testing ppt final
piyushdhaker
 
Estimation and hypothesis
Estimation and hypothesisEstimation and hypothesis
Estimation and hypothesis
Junaid Ijaz
 
Multiple Linear Regression II and ANOVA I
Multiple Linear Regression II and ANOVA IMultiple Linear Regression II and ANOVA I
Multiple Linear Regression II and ANOVA I
James Neill
 

Similar to Introduction to Statistics (20)

chapter one business mathematical statistics.pptx
chapter one business mathematical statistics.pptxchapter one business mathematical statistics.pptx
chapter one business mathematical statistics.pptx
sadiqfarhan2
 
presentaion-ni-owel.pptx
presentaion-ni-owel.pptxpresentaion-ni-owel.pptx
presentaion-ni-owel.pptx
JareezRobios
 
STATISTICS-E.pdf
STATISTICS-E.pdfSTATISTICS-E.pdf
STATISTICS-E.pdf
ssuser86252c
 
presentaion ni owel iwiw.pptx
presentaion ni owel iwiw.pptxpresentaion ni owel iwiw.pptx
presentaion ni owel iwiw.pptx
JocundBrewDelaCernaA
 
Biostatistics notes for Masters in Public Health
Biostatistics notes for Masters in Public HealthBiostatistics notes for Masters in Public Health
Biostatistics notes for Masters in Public Health
PituaIvaan1
 
INTRODUCTION TO STATISTICS.pptx
INTRODUCTION TO STATISTICS.pptxINTRODUCTION TO STATISTICS.pptx
INTRODUCTION TO STATISTICS.pptx
AvilosErgelaKram
 
CHAPONE edited Stat.pptx
CHAPONE edited Stat.pptxCHAPONE edited Stat.pptx
CHAPONE edited Stat.pptx
BereketDesalegn5
 
Biostatistics
BiostatisticsBiostatistics
Biostatistics
anju mathew
 
Introduction to statistics in health care
Introduction to statistics in health care Introduction to statistics in health care
Introduction to statistics in health care
Dhasarathi Kumar
 
1statistics (2).ppt and probabilty for grade 11
1statistics (2).ppt and probabilty for grade 111statistics (2).ppt and probabilty for grade 11
1statistics (2).ppt and probabilty for grade 11
LigayaRLasquero
 
Research and Statistics Report- Estonio, Ryan.pptx
Research  and Statistics Report- Estonio, Ryan.pptxResearch  and Statistics Report- Estonio, Ryan.pptx
Research and Statistics Report- Estonio, Ryan.pptx
RyanEstonio
 
Chapter 1: Introduction to Statistics.pptx
Chapter 1: Introduction to Statistics.pptxChapter 1: Introduction to Statistics.pptx
Chapter 1: Introduction to Statistics.pptx
RaviSinghMahatra
 
WEEK-1-IS-20022023-094301am.pdf
WEEK-1-IS-20022023-094301am.pdfWEEK-1-IS-20022023-094301am.pdf
WEEK-1-IS-20022023-094301am.pdf
MdDahri
 
data analysis in Statistics-2023 guide 2023
data analysis in Statistics-2023 guide 2023data analysis in Statistics-2023 guide 2023
data analysis in Statistics-2023 guide 2023
ayesha455941
 
1.Introduction to Statistics - its types
1.Introduction to Statistics - its types1.Introduction to Statistics - its types
1.Introduction to Statistics - its types
bharath321164
 
Statistics of engineer’s with basic concepts in statistics
Statistics of engineer’s with basic concepts in statisticsStatistics of engineer’s with basic concepts in statistics
Statistics of engineer’s with basic concepts in statistics
Java267874
 
Branches of statistics
Branches of statisticsBranches of statistics
Branches of statistics
calltutors
 
biostatistics-210618023858.pptx bbbbbbbbbb
biostatistics-210618023858.pptx bbbbbbbbbbbiostatistics-210618023858.pptx bbbbbbbbbb
biostatistics-210618023858.pptx bbbbbbbbbb
RAMJIBANYADAV2
 
statistics and prabability.ppt for grade 11
statistics and prabability.ppt for grade 11statistics and prabability.ppt for grade 11
statistics and prabability.ppt for grade 11
LigayaRLasquero
 
Module-7-Descriptive Research-survey.pdf
Module-7-Descriptive Research-survey.pdfModule-7-Descriptive Research-survey.pdf
Module-7-Descriptive Research-survey.pdf
Vikramjit Singh
 
chapter one business mathematical statistics.pptx
chapter one business mathematical statistics.pptxchapter one business mathematical statistics.pptx
chapter one business mathematical statistics.pptx
sadiqfarhan2
 
presentaion-ni-owel.pptx
presentaion-ni-owel.pptxpresentaion-ni-owel.pptx
presentaion-ni-owel.pptx
JareezRobios
 
Biostatistics notes for Masters in Public Health
Biostatistics notes for Masters in Public HealthBiostatistics notes for Masters in Public Health
Biostatistics notes for Masters in Public Health
PituaIvaan1
 
INTRODUCTION TO STATISTICS.pptx
INTRODUCTION TO STATISTICS.pptxINTRODUCTION TO STATISTICS.pptx
INTRODUCTION TO STATISTICS.pptx
AvilosErgelaKram
 
Introduction to statistics in health care
Introduction to statistics in health care Introduction to statistics in health care
Introduction to statistics in health care
Dhasarathi Kumar
 
1statistics (2).ppt and probabilty for grade 11
1statistics (2).ppt and probabilty for grade 111statistics (2).ppt and probabilty for grade 11
1statistics (2).ppt and probabilty for grade 11
LigayaRLasquero
 
Research and Statistics Report- Estonio, Ryan.pptx
Research  and Statistics Report- Estonio, Ryan.pptxResearch  and Statistics Report- Estonio, Ryan.pptx
Research and Statistics Report- Estonio, Ryan.pptx
RyanEstonio
 
Chapter 1: Introduction to Statistics.pptx
Chapter 1: Introduction to Statistics.pptxChapter 1: Introduction to Statistics.pptx
Chapter 1: Introduction to Statistics.pptx
RaviSinghMahatra
 
WEEK-1-IS-20022023-094301am.pdf
WEEK-1-IS-20022023-094301am.pdfWEEK-1-IS-20022023-094301am.pdf
WEEK-1-IS-20022023-094301am.pdf
MdDahri
 
data analysis in Statistics-2023 guide 2023
data analysis in Statistics-2023 guide 2023data analysis in Statistics-2023 guide 2023
data analysis in Statistics-2023 guide 2023
ayesha455941
 
1.Introduction to Statistics - its types
1.Introduction to Statistics - its types1.Introduction to Statistics - its types
1.Introduction to Statistics - its types
bharath321164
 
Statistics of engineer’s with basic concepts in statistics
Statistics of engineer’s with basic concepts in statisticsStatistics of engineer’s with basic concepts in statistics
Statistics of engineer’s with basic concepts in statistics
Java267874
 
Branches of statistics
Branches of statisticsBranches of statistics
Branches of statistics
calltutors
 
biostatistics-210618023858.pptx bbbbbbbbbb
biostatistics-210618023858.pptx bbbbbbbbbbbiostatistics-210618023858.pptx bbbbbbbbbb
biostatistics-210618023858.pptx bbbbbbbbbb
RAMJIBANYADAV2
 
statistics and prabability.ppt for grade 11
statistics and prabability.ppt for grade 11statistics and prabability.ppt for grade 11
statistics and prabability.ppt for grade 11
LigayaRLasquero
 
Module-7-Descriptive Research-survey.pdf
Module-7-Descriptive Research-survey.pdfModule-7-Descriptive Research-survey.pdf
Module-7-Descriptive Research-survey.pdf
Vikramjit Singh
 
Ad

Recently uploaded (20)

Welcome to Mining RACE - Program - english
Welcome to Mining RACE - Program - englishWelcome to Mining RACE - Program - english
Welcome to Mining RACE - Program - english
Mining RACE
 
Chapters 7- 8 on Precis Writing for middle level
Chapters 7- 8 on Precis Writing for middle levelChapters 7- 8 on Precis Writing for middle level
Chapters 7- 8 on Precis Writing for middle level
Olusegun Mosugu
 
Guiding the Behavior of Young Children.ppt
Guiding the Behavior of Young Children.pptGuiding the Behavior of Young Children.ppt
Guiding the Behavior of Young Children.ppt
FelixOlalekanBabalol
 
Thyrocardiac syndrome, diagnosis and treatment
Thyrocardiac syndrome,  diagnosis and treatmentThyrocardiac syndrome,  diagnosis and treatment
Thyrocardiac syndrome, diagnosis and treatment
Mohammed Ahmed Bamashmos
 
stackconf 2025 | From SBOM to Software Architecture Documentation by Philip A...
stackconf 2025 | From SBOM to Software Architecture Documentation by Philip A...stackconf 2025 | From SBOM to Software Architecture Documentation by Philip A...
stackconf 2025 | From SBOM to Software Architecture Documentation by Philip A...
NETWAYS
 
stackconf 2025 | IP Authentication: A Tale of Performance Pitfalls and Challe...
stackconf 2025 | IP Authentication: A Tale of Performance Pitfalls and Challe...stackconf 2025 | IP Authentication: A Tale of Performance Pitfalls and Challe...
stackconf 2025 | IP Authentication: A Tale of Performance Pitfalls and Challe...
NETWAYS
 
Mining RACE CORES - Racing-Mode - Presentation - english
Mining RACE CORES - Racing-Mode - Presentation - englishMining RACE CORES - Racing-Mode - Presentation - english
Mining RACE CORES - Racing-Mode - Presentation - english
Mining RACE
 
stackconf 2025 | The Sustainable Infrastructure of the future by Alessandro V...
stackconf 2025 | The Sustainable Infrastructure of the future by Alessandro V...stackconf 2025 | The Sustainable Infrastructure of the future by Alessandro V...
stackconf 2025 | The Sustainable Infrastructure of the future by Alessandro V...
NETWAYS
 
A Bot Identification Model and Tool Based on GitHub Activity Sequences
A Bot Identification Model and Tool Based on GitHub Activity SequencesA Bot Identification Model and Tool Based on GitHub Activity Sequences
A Bot Identification Model and Tool Based on GitHub Activity Sequences
natarajan8993
 
ICONX - Mining RACE - Compensation Plan - english
ICONX - Mining RACE - Compensation Plan - englishICONX - Mining RACE - Compensation Plan - english
ICONX - Mining RACE - Compensation Plan - english
Mining RACE
 
We Are The World-USA for Africa : Written By Lionel Richie And Michael Jackso...
We Are The World-USA for Africa : Written By Lionel Richie And Michael Jackso...We Are The World-USA for Africa : Written By Lionel Richie And Michael Jackso...
We Are The World-USA for Africa : Written By Lionel Richie And Michael Jackso...
hershtara1
 
criminal law kajsgdasn cakjsbciaYSVC aschaios
criminal law kajsgdasn cakjsbciaYSVC aschaioscriminal law kajsgdasn cakjsbciaYSVC aschaios
criminal law kajsgdasn cakjsbciaYSVC aschaios
eleazaranghel023
 
stackconf 2025 | Snakes are my new favourite by Felix Frank.pdf
stackconf 2025 | Snakes are my new favourite by Felix Frank.pdfstackconf 2025 | Snakes are my new favourite by Felix Frank.pdf
stackconf 2025 | Snakes are my new favourite by Felix Frank.pdf
NETWAYS
 
Platform Engineering >> Platform Product Management.pptx
Platform Engineering  >>  Platform Product Management.pptxPlatform Engineering  >>  Platform Product Management.pptx
Platform Engineering >> Platform Product Management.pptx
noelorona
 
2. Asexual propagation of fruit crops and .pptx
2. Asexual propagation of fruit crops and .pptx2. Asexual propagation of fruit crops and .pptx
2. Asexual propagation of fruit crops and .pptx
aschenakidawit1
 
Modernization of Parliaments: The Way Forward
Modernization of Parliaments: The Way ForwardModernization of Parliaments: The Way Forward
Modernization of Parliaments: The Way Forward
Dr. Fotios Fitsilis
 
stackconf 2025 | Abstract It: The Higher, The Faster! by Engin Diri.pdf
stackconf 2025 | Abstract It: The Higher, The Faster! by Engin Diri.pdfstackconf 2025 | Abstract It: The Higher, The Faster! by Engin Diri.pdf
stackconf 2025 | Abstract It: The Higher, The Faster! by Engin Diri.pdf
NETWAYS
 
All_India_Situation_Presentation. by Dr Jesmina Khatun
All_India_Situation_Presentation. by Dr Jesmina KhatunAll_India_Situation_Presentation. by Dr Jesmina Khatun
All_India_Situation_Presentation. by Dr Jesmina Khatun
DRJESMINAKHATUN
 
stackconf 2025 | How NVMe over TCP runs PostgreSQL in Quicksilver mode! by Sa...
stackconf 2025 | How NVMe over TCP runs PostgreSQL in Quicksilver mode! by Sa...stackconf 2025 | How NVMe over TCP runs PostgreSQL in Quicksilver mode! by Sa...
stackconf 2025 | How NVMe over TCP runs PostgreSQL in Quicksilver mode! by Sa...
NETWAYS
 
Approach to diabetes Mellitus, diagnosis
Approach to diabetes Mellitus,  diagnosisApproach to diabetes Mellitus,  diagnosis
Approach to diabetes Mellitus, diagnosis
Mohammed Ahmed Bamashmos
 
Welcome to Mining RACE - Program - english
Welcome to Mining RACE - Program - englishWelcome to Mining RACE - Program - english
Welcome to Mining RACE - Program - english
Mining RACE
 
Chapters 7- 8 on Precis Writing for middle level
Chapters 7- 8 on Precis Writing for middle levelChapters 7- 8 on Precis Writing for middle level
Chapters 7- 8 on Precis Writing for middle level
Olusegun Mosugu
 
Guiding the Behavior of Young Children.ppt
Guiding the Behavior of Young Children.pptGuiding the Behavior of Young Children.ppt
Guiding the Behavior of Young Children.ppt
FelixOlalekanBabalol
 
Thyrocardiac syndrome, diagnosis and treatment
Thyrocardiac syndrome,  diagnosis and treatmentThyrocardiac syndrome,  diagnosis and treatment
Thyrocardiac syndrome, diagnosis and treatment
Mohammed Ahmed Bamashmos
 
stackconf 2025 | From SBOM to Software Architecture Documentation by Philip A...
stackconf 2025 | From SBOM to Software Architecture Documentation by Philip A...stackconf 2025 | From SBOM to Software Architecture Documentation by Philip A...
stackconf 2025 | From SBOM to Software Architecture Documentation by Philip A...
NETWAYS
 
stackconf 2025 | IP Authentication: A Tale of Performance Pitfalls and Challe...
stackconf 2025 | IP Authentication: A Tale of Performance Pitfalls and Challe...stackconf 2025 | IP Authentication: A Tale of Performance Pitfalls and Challe...
stackconf 2025 | IP Authentication: A Tale of Performance Pitfalls and Challe...
NETWAYS
 
Mining RACE CORES - Racing-Mode - Presentation - english
Mining RACE CORES - Racing-Mode - Presentation - englishMining RACE CORES - Racing-Mode - Presentation - english
Mining RACE CORES - Racing-Mode - Presentation - english
Mining RACE
 
stackconf 2025 | The Sustainable Infrastructure of the future by Alessandro V...
stackconf 2025 | The Sustainable Infrastructure of the future by Alessandro V...stackconf 2025 | The Sustainable Infrastructure of the future by Alessandro V...
stackconf 2025 | The Sustainable Infrastructure of the future by Alessandro V...
NETWAYS
 
A Bot Identification Model and Tool Based on GitHub Activity Sequences
A Bot Identification Model and Tool Based on GitHub Activity SequencesA Bot Identification Model and Tool Based on GitHub Activity Sequences
A Bot Identification Model and Tool Based on GitHub Activity Sequences
natarajan8993
 
ICONX - Mining RACE - Compensation Plan - english
ICONX - Mining RACE - Compensation Plan - englishICONX - Mining RACE - Compensation Plan - english
ICONX - Mining RACE - Compensation Plan - english
Mining RACE
 
We Are The World-USA for Africa : Written By Lionel Richie And Michael Jackso...
We Are The World-USA for Africa : Written By Lionel Richie And Michael Jackso...We Are The World-USA for Africa : Written By Lionel Richie And Michael Jackso...
We Are The World-USA for Africa : Written By Lionel Richie And Michael Jackso...
hershtara1
 
criminal law kajsgdasn cakjsbciaYSVC aschaios
criminal law kajsgdasn cakjsbciaYSVC aschaioscriminal law kajsgdasn cakjsbciaYSVC aschaios
criminal law kajsgdasn cakjsbciaYSVC aschaios
eleazaranghel023
 
stackconf 2025 | Snakes are my new favourite by Felix Frank.pdf
stackconf 2025 | Snakes are my new favourite by Felix Frank.pdfstackconf 2025 | Snakes are my new favourite by Felix Frank.pdf
stackconf 2025 | Snakes are my new favourite by Felix Frank.pdf
NETWAYS
 
Platform Engineering >> Platform Product Management.pptx
Platform Engineering  >>  Platform Product Management.pptxPlatform Engineering  >>  Platform Product Management.pptx
Platform Engineering >> Platform Product Management.pptx
noelorona
 
2. Asexual propagation of fruit crops and .pptx
2. Asexual propagation of fruit crops and .pptx2. Asexual propagation of fruit crops and .pptx
2. Asexual propagation of fruit crops and .pptx
aschenakidawit1
 
Modernization of Parliaments: The Way Forward
Modernization of Parliaments: The Way ForwardModernization of Parliaments: The Way Forward
Modernization of Parliaments: The Way Forward
Dr. Fotios Fitsilis
 
stackconf 2025 | Abstract It: The Higher, The Faster! by Engin Diri.pdf
stackconf 2025 | Abstract It: The Higher, The Faster! by Engin Diri.pdfstackconf 2025 | Abstract It: The Higher, The Faster! by Engin Diri.pdf
stackconf 2025 | Abstract It: The Higher, The Faster! by Engin Diri.pdf
NETWAYS
 
All_India_Situation_Presentation. by Dr Jesmina Khatun
All_India_Situation_Presentation. by Dr Jesmina KhatunAll_India_Situation_Presentation. by Dr Jesmina Khatun
All_India_Situation_Presentation. by Dr Jesmina Khatun
DRJESMINAKHATUN
 
stackconf 2025 | How NVMe over TCP runs PostgreSQL in Quicksilver mode! by Sa...
stackconf 2025 | How NVMe over TCP runs PostgreSQL in Quicksilver mode! by Sa...stackconf 2025 | How NVMe over TCP runs PostgreSQL in Quicksilver mode! by Sa...
stackconf 2025 | How NVMe over TCP runs PostgreSQL in Quicksilver mode! by Sa...
NETWAYS
 
Ad

Introduction to Statistics

  • 1. STATISTICS PRESENTATION PRESENTED BY: AREEBA SULTAN, AMMARA MANZOOR, GHAYUR KHALID WERYAH, ALI HUSSAIN, AYESHA SHAFQAT.
  • 2. DEFINATION OF STATISTICS • The practice or science of collecting and analysing numerical data in large quantities. • A branch of mathematics dealing with the collection, analysis, interpretation, and presentation of masses of numerical data. • A collection of quantitative data.
  • 3. EXAMPLE OF STATISTICS • In a class, the collection of marks obtained by 50 students is the description of data. Now when we take out the mean of the data, the result is the average of marks of 50 students. If the average mark obtained by 50 students is 88 out of 100, then we can reach to a conclusion or give a judgment on the basis of the result.
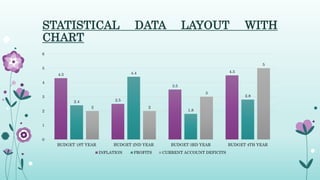
  • 4. STATISTICAL DATA LAYOUT WITH CHART 4.3 2.5 3.5 4.5 2.4 4.4 1.8 2.8 2 2 3 5 0 1 2 3 4 5 6 BUDGET 1ST YEAR BUDGET 2ND YEAR BUDGET 3RD YEAR BUDGET 4TH YEAR INFLATION PROFITS CURRENT ACCOUNT DEFICITS
  • 5. TYPES OF STATISTICS Statistics have majorly categorised into two types: 1. Descriptive Statistics. 2. Inferential Statistics.
  • 6. DESCRIPTIVE STATISTICS • In this type of statistics, the data is summarised through the given observations. The summarisation is one from a sample of population using parameters such as the mean or standard deviation. • Descriptive statistics is a way to organise, represent and describe a collection of data using tables, graphs, and summary measures. • For Example, the collection of people in a city using the internet or using Television.
  • 7. DESCRIPTIVE STATISTICS Descriptive statistics are also categorised into four different categories: • Measure of frequency. • Measure of dispersion. • Measure of central tendency. • Measure of position. The frequency measurement displays the number of times a particular data occurs. Range, Variance, Standard Deviation are measures of dispersion. It identifies the spread of data.
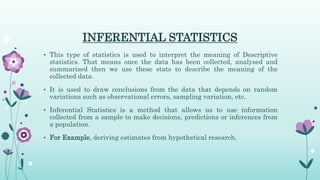
  • 8. INFERENTIAL STATISTICS • This type of statistics is used to interpret the meaning of Descriptive statistics. That means once the data has been collected, analysed and summarised then we use these stats to describe the meaning of the collected data. • It is used to draw conclusions from the data that depends on random variations such as observational errors, sampling variation, etc. • Inferential Statistics is a method that allows us to use information collected from a sample to make decisions, predictions or inferences from a population. • For Example, deriving estimates from hypothetical research.
  • 9. IMPORTANCE OF STATISTICS  Statistics executes the work simply and gives a transparent picture of the work we do regularly.  The statistical methods help us to examine different areas such as medicine, business, economics, social science and others.  Statistics equips us with different kinds of organised data with the help of graphs, tables, diagrams and charts.
  • 10. IMPORTANCE OF STATISTICS  Statistics helps to understand the variability of the data pattern in a quantitative way.  Statistics makes us understand the bulk of data in a simple way.  Statistics is the way to collecting accurate quantitative data.
  • 11. USE OF STATISTICS IN REAL LIFE • Statistics play an important role in real life, especially in large industries, where data is computed in bulk. It helps to collect, analyse and interpret the data. Also, with the help of statistical graphs, charts and tables we can easily present the data.
  • 12. APPLICATIONS OF STATISTICS IN DIFFERENT FIELDS • Statistics plays a vital role in every field of human activity. Statistics helps in determining the existing position of per capita income, unemployment, population growth rates, housing, schooling medical facilities, etc., in a country. • statistics holds a central position in almost every field, including industry, commerce, trade, physics, chemistry, economics, mathematics, biology, botany, psychology, astronomy, etc., so the application of statistics is very wide. • “Now we shall discuss some important fields in which statistics is commonly applied in the next slides.”
  • 13. APPLICATIONS OF STATISTICS BUSINESS • Statistics plays an important role in business. A successful businessman must be very quick and accurate in decision making. He knows what his customers want; he should therefore know what to produce and sell and in what quantities. • Statistics helps businessmen to plan production according to the taste of the customers, and the quality of the products can also be checked more efficiently by using statistical methods. Thus, it can be seen that all business activities are based on statistical information.
  • 14. APPLICATIONS OF STATISTICS ECNOMICS • Economics largely depends upon statistics. National income accounts are multipurpose indicators for economists and administrators, and statistical methods are used to prepare these accounts. • In economics research, statistical methods are used to collect and analyse the data and test hypotheses. The relationship between supply and demand is studied by statistical methods; imports and exports, inflation rates, and per capita income are problems which require a good knowledge of statistics.
  • 15. APPLICATIONS OF STATISTICS SOCIAL SCIENCES • Statistics plays a vital role in almost all the social sciences. • Statistical methods are commonly used for analysing experiments results, and testing their significance in biology, physics, chemistry, mathematics, meteorology, research, chambers of commerce, sociology, business, public administration, communications and information technology, etc.
  • 16. ADVANTAGES AND DISADVANTAGES OF STATISTICS ADVANTAGES • The bulk data can be presented in a precise and definite form. • The comparison and conclusions of data becomes easy. • Forecasting the trends becomes easy with statistics. DISADVANTAGES • The statistical data can lead to misuse. • There are chances of errors becomes easy when the statistical methods are not done by the experts. • For the comparison of the data, the data should be homogeneous and uniform.
  • 17. SAMPLING • Sampling is a statistical procedure that is concerned with the selection of the individual observation; it helps us to make statistical inferences about the population. • Quality assurance, and survey methodology, sampling is the selection of a subset of individuals from within a statistical population to estimate characteristics of the whole population. Statisticians attempt to collect samples that are representative of the population in question.
  • 18. EXAMPLE OF SAMPLING • if a drug manufacturer would like to research the adverse side effects of a drug on the country’s population, it is almost impossible to conduct a research study that involves everyone. • In this case, the researcher decides a sample of people from each demographic and then researches them, giving him/her indicative feedback on the drug’s behaviour.
  • 19. CHARACTERISTICS OF SAMPLING •In sampling, we assume that samples are drawn from the population and sample means and population means are equal. A population can be defined as a whole that includes all items and characteristics of the research taken into study. However, gathering all this information is time consuming and costly. We therefore make inferences about the population with the help of samples.
  • 20. TYPES OF SAMPLING TYPES OF SAMPLING ARE AS FOLLOWS: • Probability Sampling. • Non-Probability Sampling. “Let’s take a closer look at these two methods of sampling”.
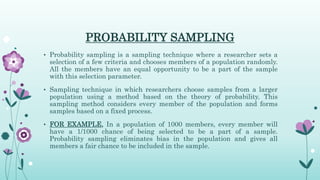
  • 21. PROBABILITY SAMPLING • Probability sampling is a sampling technique where a researcher sets a selection of a few criteria and chooses members of a population randomly. All the members have an equal opportunity to be a part of the sample with this selection parameter. • Sampling technique in which researchers choose samples from a larger population using a method based on the theory of probability. This sampling method considers every member of the population and forms samples based on a fixed process. • FOR EXAMPLE, In a population of 1000 members, every member will have a 1/1000 chance of being selected to be a part of a sample. Probability sampling eliminates bias in the population and gives all members a fair chance to be included in the sample.
  • 22. TYPES OF PROBABILITY There are four types of probability sampling techniques: 1. SIMPLE RANDOM SAMPLING. 2. CLUSTER SAMPLING. 3. SYSTEMATIC SAMPLING. 4. STARTIFIED RANDOM SAMPLING.
  • 23. USES OF PROBABILITY STATISTICS • Reduce Sample Bias: Using the probability sampling method, the bias in the sample derived from a population is negligible to non-existent. The selection of the sample mainly depicts the understanding and the inference of the researcher. Probability sampling leads to higher quality data collection as the sample appropriately represents the population. • Diverse Population: When the population is vast and diverse, it is essential to have adequate representation so that the data is not skewed towards one demographic. For example, if Square would like to understand the people that could make their point-of-sale devices, a survey conducted from a sample of people across the US from different industries and socio-economic backgrounds helps.
  • 24. NON-PROBABILITY STATISTICS • The non-probability method is a sampling method that involves a collection of feedback based on a researcher or statistician’s sample selection capabilities and not on a fixed selection process. • The output of a survey conducted with a non-probable sample leads to skewed results, which may not represent the desired target population. But, there are situations such as the preliminary stages of research or cost constraints for conducting research, where non-probability sampling will be much more useful than the other type.
  • 25. TYPES OF NON-PROBABILITY STATISTICS 1. CONVINCING SAMPLING 2. JUDGMENTAL SAMPLING. 3. SNOWBALL SAMPLING. 4. QOUTA SAMPLING.
  • 26. USES OF NON-PROBABILITY SAMPLING • Create a hypothesis: Researchers use the non-probability sampling method to create an assumption when limited to no prior information is available. This method helps with the immediate return of data and builds a base for further research. • Exploratory research: Researchers use this sampling technique widely when conducting qualitative research, pilot studies, or exploratory research. • Budget and time constraints: The non-probability method when there are budget and time constraints, and some preliminary data must be collected. Since the survey design is not rigid, it is easier to pick respondents at random and have them take the survey or questionnaire.
  • 27. DIFFERENCE BETWEEN PROBABILITY AND NON-PROBABILITY SAMPLING PROBABILITY SAMPLING • Probability Sampling is a sampling technique in which samples from a larger population are chosen using a method based on the theory of probability. • Random sampling method. • The population is selected randomly. • Since there is a method for deciding the sample, the population demographics are conclusively represented. NON-PROBABILITY SAMPLING • Non-probability sampling is a sampling technique in which the researcher selects samples based on the researcher’s subjective judgment rather than random selection. • Non-Random sampling method. • The population is selected arbitrarily. • Since the sampling method is arbitrary, the population demographics representation is almost always skewed.
  • 28. THANKYOU MADE BY: GHAYUR KHALID WERYAH (053) GREY SECTION