SlideShare a Scribd company logo
Lecture 1
Introduction of Statistics
• Statistics as Singular (Subject)
Statistics is the science of conducting
studies to collect, organize, summarize,
analyze, and draw conclusions from data.
Statistic (Singular Without s )
Characteristics of Sample
e.g mean ҧ
𝑥 & Standard deviation 𝑠 of sample
• Statistics as Plural (Data)
means Data (Facts and Figures)
e.g
No. of students in 18 Batch
No. of Covid 19 Patient in Pak
No of universities Teaching online
Applications of Statistics
• Statistics is used in almost all fields of human endeavor.
• In other areas, such as public health, an administrator might be concerned with the
number of residents who contract a new strain of flu virus during a certain year.
• In education, a researcher might want to know if new methods of teaching are
better than old ones.
• Statistics is used to analyze the results of surveys and as a tool in scientific research
to make decisions based on controlled experiments.
• Other uses of statistics include operations research, quality control, estimation, and
prediction.
Why Do We Study Statistics?
Like professional people to understand professional data
To understand statistical studies performed in your fields.
to conduct research or survey
Statistics helps you to become better consumers and citizens.
Branches of Statistics
Descriptive Statistics
• Descriptive statistics consists of the
collection, organization,
summarization, and presentation of
data.
Inferential Statistics
• Inferential statistics consists of
generalizing from samples to
populations, performing
estimations and hypothesis tests,
determining relationships among
variables, and making predictions.
Example: Determine whether descriptive or inferential statistics were used.
• a. The average jackpot for the top five lottery winners was $367.6 million.
• b. A study done by the American Academy of Neurology suggests that older
people who had a high caloric diet more than doubled their risk of memory
loss.
• c. Scientists at the University of Oxford in England found that a good laugh
significantly raises a person’s pain level tolerance.
• d. Forty-four percent of the people in the United States have type O blood.
• e. In 2011, there were 34 deaths from the avian flu.
Terminology
• A variable is a characteristic or attribute that can assume different
values.
• Data are the values (measurements or observations) that the variables
can assume.
• Each value in the data set is called a data value or a datum.
• A population consists of all subjects (human or otherwise) that are
being studied.
• A sample is a group of subjects selected from a population.
Read the following on attendance and grades, and answer the questions.
A study conducted at Manatee Community College revealed that students who
attended class 95 to 100% of the time usually received an A in the class. Students
who attended class 80 to 90% of the time usually received a B or C in the class.
Students who attended class less than 80% of the time usually received a D or an
F or eventually withdrew from the class.
Based on this information, attendance and grades are related. The more you attend
class, the more likely it is you will receive a higher grade. If you improve your
attendance, your grades will probably improve. Many factors affect your grade in a
course. One factor that you have considerable control over is attendance. You can
increase your opportunities for learning by attending class more often.
1. What are the variables under study?
2. What are the data in the study?
3. Are descriptive, inferential, or both types of statistics used?
4. What is the population under study?
5. Was a sample collected? If so, from where?
6. From the information given, comment on the relationship between the
variables.
The variables are grades and attendance.
2. The data consist of specific grades and attendance numbers.
3. These are descriptive statistics; however, if an inference were made to all students, then that would
be inferential statistics.
4. The population under study is students at Manatee Community College (MCC).
5. While not specified, we probably have data from a sample of MCC students.
6. Based on the data, it appears that, in general, the better your attendance, the higher your grade.
The classification of variables
Variables
Qualitative
Quantitative
Variables can be classified as qualitative or quantitative.
Qualitative variables are variables that have distinct categories according to some
characteristic or attribute.
gender , grades , religious preference , geographic locations etc
Quantitative variables are variables that can be counted or measured.
If Counted Discrete random Variable ( No. of heads , dots on a die)
If measured continuous random variable (eg temperature , current , lenth etc)
Classify each variable as a discrete variable or a continuous variable.
a. The highest wind speed of a hurricane
b. The weight of baggage on an airplane
c. The number of pages in a statistics book
d. The amount of money a person spends per year for online purchases
a. Continuous, since wind speed must be measured
b. Continuous, since weight is measured
c. Discrete, since the number of pages is countable
d. Discrete, since the smallest value that money can assume is in
cents
Answers 1. The variables are transportation industry and fatal injuries.
2. Transportation industry is a qualitative variable, and the number of fatal injuries is a
quantitative variable. 3. The number of fatalities is discrete.
Misuse of Statistics
The misuse of statistical techniques is used to sell products
To get our attention by using statistics to evoke fear, shock, and outrage.
“Three out of four doctors surveyed recommend brand such and such.”
suspected sample
“During my administration, expenditures increased a mere 3%.”
“Brand A aspirin works four times faster.” Detached Statistics
“Studies suggest that using our exercise machine will reduce your weight.”
“Taking calcium will lower blood pressure in some people.”
Two sayings that
have been
around for a
long time
illustrate this
point:
“There are three
types of lies—lies,
damn lies, and
statistics.”
“Figures don’t
lie, but liars
figure.”
Ad

More Related Content

Similar to Lect 1 Introduction Statistics.pdf (20)

Sqqs1013 ch1-a122
Sqqs1013 ch1-a122Sqqs1013 ch1-a122
Sqqs1013 ch1-a122
kim rae KI
 
Practical Research 2 - Quantitative Research (Nature of Inquiry & Research)
Practical Research 2 - Quantitative Research (Nature of Inquiry & Research)Practical Research 2 - Quantitative Research (Nature of Inquiry & Research)
Practical Research 2 - Quantitative Research (Nature of Inquiry & Research)
Cristy Ann Subala
 
research2-190704042106.pdf
research2-190704042106.pdfresearch2-190704042106.pdf
research2-190704042106.pdf
JovManalili1
 
Data collection
Data collectionData collection
Data collection
manayer otb
 
The role of statistics and the data analysis process.ppt
The role of statistics and the data analysis process.pptThe role of statistics and the data analysis process.ppt
The role of statistics and the data analysis process.ppt
JakeCuenca10
 
Stat11t Chapter1
Stat11t Chapter1Stat11t Chapter1
Stat11t Chapter1
gueste87a4f
 
Stat11t chapter1
Stat11t chapter1Stat11t chapter1
Stat11t chapter1
raylenepotter
 
STATISTICS its measures of central tendency.pptx
STATISTICS its measures of central tendency.pptxSTATISTICS its measures of central tendency.pptx
STATISTICS its measures of central tendency.pptx
DaCelEndoma
 
Statistics Exericse 29
Statistics Exericse 29Statistics Exericse 29
Statistics Exericse 29
Melanie Erickson
 
2_54248135948895858599595585887869437 2.pdf
2_54248135948895858599595585887869437 2.pdf2_54248135948895858599595585887869437 2.pdf
2_54248135948895858599595585887869437 2.pdf
Saad49687
 
1. week 1
1. week 11. week 1
1. week 1
renz50
 
1. Introdution to Biostatistics.ppt
1. Introdution to Biostatistics.ppt1. Introdution to Biostatistics.ppt
1. Introdution to Biostatistics.ppt
Fatima117039
 
Survey procedures in dentistry
Survey procedures in dentistrySurvey procedures in dentistry
Survey procedures in dentistry
deepthiRagasree
 
Statistics 1
Statistics 1Statistics 1
Statistics 1
Saed Jama
 
Basics stat ppt-types of data
Basics stat ppt-types of dataBasics stat ppt-types of data
Basics stat ppt-types of data
Farhana Shaheen
 
introduction to statistical theory
introduction to statistical theoryintroduction to statistical theory
introduction to statistical theory
Unsa Shakir
 
Assignment 01
Assignment 01Assignment 01
Assignment 01
IIUM
 
Quantitative Methods for Lawyers - Class #2 - Research Design Part II + Intro...
Quantitative Methods for Lawyers - Class #2 - Research Design Part II + Intro...Quantitative Methods for Lawyers - Class #2 - Research Design Part II + Intro...
Quantitative Methods for Lawyers - Class #2 - Research Design Part II + Intro...
Daniel Katz
 
Introduction to Medical Statistics - Master.Eman Khashabapptx.pdf
Introduction to Medical Statistics - Master.Eman Khashabapptx.pdfIntroduction to Medical Statistics - Master.Eman Khashabapptx.pdf
Introduction to Medical Statistics - Master.Eman Khashabapptx.pdf
merehanroos44
 
Day 1 - Introduction-To-Statistics.pptx
Day 1 - Introduction-To-Statistics.pptxDay 1 - Introduction-To-Statistics.pptx
Day 1 - Introduction-To-Statistics.pptx
MJGamboa2
 
Sqqs1013 ch1-a122
Sqqs1013 ch1-a122Sqqs1013 ch1-a122
Sqqs1013 ch1-a122
kim rae KI
 
Practical Research 2 - Quantitative Research (Nature of Inquiry & Research)
Practical Research 2 - Quantitative Research (Nature of Inquiry & Research)Practical Research 2 - Quantitative Research (Nature of Inquiry & Research)
Practical Research 2 - Quantitative Research (Nature of Inquiry & Research)
Cristy Ann Subala
 
research2-190704042106.pdf
research2-190704042106.pdfresearch2-190704042106.pdf
research2-190704042106.pdf
JovManalili1
 
The role of statistics and the data analysis process.ppt
The role of statistics and the data analysis process.pptThe role of statistics and the data analysis process.ppt
The role of statistics and the data analysis process.ppt
JakeCuenca10
 
Stat11t Chapter1
Stat11t Chapter1Stat11t Chapter1
Stat11t Chapter1
gueste87a4f
 
STATISTICS its measures of central tendency.pptx
STATISTICS its measures of central tendency.pptxSTATISTICS its measures of central tendency.pptx
STATISTICS its measures of central tendency.pptx
DaCelEndoma
 
2_54248135948895858599595585887869437 2.pdf
2_54248135948895858599595585887869437 2.pdf2_54248135948895858599595585887869437 2.pdf
2_54248135948895858599595585887869437 2.pdf
Saad49687
 
1. week 1
1. week 11. week 1
1. week 1
renz50
 
1. Introdution to Biostatistics.ppt
1. Introdution to Biostatistics.ppt1. Introdution to Biostatistics.ppt
1. Introdution to Biostatistics.ppt
Fatima117039
 
Survey procedures in dentistry
Survey procedures in dentistrySurvey procedures in dentistry
Survey procedures in dentistry
deepthiRagasree
 
Statistics 1
Statistics 1Statistics 1
Statistics 1
Saed Jama
 
Basics stat ppt-types of data
Basics stat ppt-types of dataBasics stat ppt-types of data
Basics stat ppt-types of data
Farhana Shaheen
 
introduction to statistical theory
introduction to statistical theoryintroduction to statistical theory
introduction to statistical theory
Unsa Shakir
 
Assignment 01
Assignment 01Assignment 01
Assignment 01
IIUM
 
Quantitative Methods for Lawyers - Class #2 - Research Design Part II + Intro...
Quantitative Methods for Lawyers - Class #2 - Research Design Part II + Intro...Quantitative Methods for Lawyers - Class #2 - Research Design Part II + Intro...
Quantitative Methods for Lawyers - Class #2 - Research Design Part II + Intro...
Daniel Katz
 
Introduction to Medical Statistics - Master.Eman Khashabapptx.pdf
Introduction to Medical Statistics - Master.Eman Khashabapptx.pdfIntroduction to Medical Statistics - Master.Eman Khashabapptx.pdf
Introduction to Medical Statistics - Master.Eman Khashabapptx.pdf
merehanroos44
 
Day 1 - Introduction-To-Statistics.pptx
Day 1 - Introduction-To-Statistics.pptxDay 1 - Introduction-To-Statistics.pptx
Day 1 - Introduction-To-Statistics.pptx
MJGamboa2
 

Recently uploaded (20)

Preclinical Advances in Nuclear Neurology.pptx
Preclinical Advances in Nuclear Neurology.pptxPreclinical Advances in Nuclear Neurology.pptx
Preclinical Advances in Nuclear Neurology.pptx
MahitaLaveti
 
Drug transport model in Advance Biopharmaceutics
Drug transport model in Advance BiopharmaceuticsDrug transport model in Advance Biopharmaceutics
Drug transport model in Advance Biopharmaceutics
RushiBharti
 
Presantation investigation new drug new.pdf
Presantation investigation new drug new.pdfPresantation investigation new drug new.pdf
Presantation investigation new drug new.pdf
091HarshikaModi
 
Nutritional Management of Heat Stress in broiler and layers
Nutritional Management of Heat Stress in broiler and layersNutritional Management of Heat Stress in broiler and layers
Nutritional Management of Heat Stress in broiler and layers
Bihar Veterinary College, Bihar Animal Sciences University, Patna, Bihar, India
 
Data Structures Stack and Queue Data Structures
Data Structures Stack and Queue Data StructuresData Structures Stack and Queue Data Structures
Data Structures Stack and Queue Data Structures
poongothai11
 
Seminary Administration - Class Roll - Report.pdf
Seminary Administration - Class Roll - Report.pdfSeminary Administration - Class Roll - Report.pdf
Seminary Administration - Class Roll - Report.pdf
CludioGomesdaSilva
 
Sb- and Sn-based materials in Na-ion batteries
Sb- and Sn-based materials in Na-ion batteriesSb- and Sn-based materials in Na-ion batteries
Sb- and Sn-based materials in Na-ion batteries
MichouRatisou
 
Introduction to Black Hole and how its formed
Introduction to Black Hole and how its formedIntroduction to Black Hole and how its formed
Introduction to Black Hole and how its formed
MSafiullahALawi
 
Examining Visual Attention in Gaze-Driven VR Learning: An Eye-Tracking Study ...
Examining Visual Attention in Gaze-Driven VR Learning: An Eye-Tracking Study ...Examining Visual Attention in Gaze-Driven VR Learning: An Eye-Tracking Study ...
Examining Visual Attention in Gaze-Driven VR Learning: An Eye-Tracking Study ...
Yasasi Abeysinghe
 
MITOSIS PRESENTATION FOR BIOLOGY AND HSB.pptx
MITOSIS PRESENTATION FOR BIOLOGY AND HSB.pptxMITOSIS PRESENTATION FOR BIOLOGY AND HSB.pptx
MITOSIS PRESENTATION FOR BIOLOGY AND HSB.pptx
shereneramdon1109
 
Artificial Intelligence_in_Chemistry_Presentation.pptx
Artificial Intelligence_in_Chemistry_Presentation.pptxArtificial Intelligence_in_Chemistry_Presentation.pptx
Artificial Intelligence_in_Chemistry_Presentation.pptx
sridevimotupalli
 
Keynote presentation at DeepTest Workshop 2025
Keynote presentation at DeepTest Workshop 2025Keynote presentation at DeepTest Workshop 2025
Keynote presentation at DeepTest Workshop 2025
Shiva Nejati
 
Subject name: Introduction to psychology
Subject name: Introduction to psychologySubject name: Introduction to psychology
Subject name: Introduction to psychology
beebussy155
 
Share THE SENSORY SYSTEMS (Auditory sense).pptx
Share THE SENSORY SYSTEMS (Auditory sense).pptxShare THE SENSORY SYSTEMS (Auditory sense).pptx
Share THE SENSORY SYSTEMS (Auditory sense).pptx
CHUsman65
 
Antliff, Allan . - Anarchist Modernism. Art, Politics, and the First American...
Antliff, Allan . - Anarchist Modernism. Art, Politics, and the First American...Antliff, Allan . - Anarchist Modernism. Art, Politics, and the First American...
Antliff, Allan . - Anarchist Modernism. Art, Politics, and the First American...
Francisco Sandoval Martínez
 
Understanding Quantitative Research.pptx
Understanding Quantitative Research.pptxUnderstanding Quantitative Research.pptx
Understanding Quantitative Research.pptx
AzkaRao2
 
Antliff, Mark. - Avant-Garde Fascism. The Mobilization of Myth, Art, and Cult...
Antliff, Mark. - Avant-Garde Fascism. The Mobilization of Myth, Art, and Cult...Antliff, Mark. - Avant-Garde Fascism. The Mobilization of Myth, Art, and Cult...
Antliff, Mark. - Avant-Garde Fascism. The Mobilization of Myth, Art, and Cult...
Francisco Sandoval Martínez
 
AT-03992-BRO-Aspen Plus.pdf se re quiere
AT-03992-BRO-Aspen Plus.pdf se re quiereAT-03992-BRO-Aspen Plus.pdf se re quiere
AT-03992-BRO-Aspen Plus.pdf se re quiere
LiangChenXu1
 
Lower_Limb_mcqs_copy.pdfkrrrrkrkeoeleenekspeke
Lower_Limb_mcqs_copy.pdfkrrrrkrkeoeleenekspekeLower_Limb_mcqs_copy.pdfkrrrrkrkeoeleenekspeke
Lower_Limb_mcqs_copy.pdfkrrrrkrkeoeleenekspeke
ParamiVihanga
 
A tale of two Lucies: talk at the maths dept, Free University of Amsterdam
A tale of two Lucies: talk at the maths dept, Free University of AmsterdamA tale of two Lucies: talk at the maths dept, Free University of Amsterdam
A tale of two Lucies: talk at the maths dept, Free University of Amsterdam
Richard Gill
 
Preclinical Advances in Nuclear Neurology.pptx
Preclinical Advances in Nuclear Neurology.pptxPreclinical Advances in Nuclear Neurology.pptx
Preclinical Advances in Nuclear Neurology.pptx
MahitaLaveti
 
Drug transport model in Advance Biopharmaceutics
Drug transport model in Advance BiopharmaceuticsDrug transport model in Advance Biopharmaceutics
Drug transport model in Advance Biopharmaceutics
RushiBharti
 
Presantation investigation new drug new.pdf
Presantation investigation new drug new.pdfPresantation investigation new drug new.pdf
Presantation investigation new drug new.pdf
091HarshikaModi
 
Data Structures Stack and Queue Data Structures
Data Structures Stack and Queue Data StructuresData Structures Stack and Queue Data Structures
Data Structures Stack and Queue Data Structures
poongothai11
 
Seminary Administration - Class Roll - Report.pdf
Seminary Administration - Class Roll - Report.pdfSeminary Administration - Class Roll - Report.pdf
Seminary Administration - Class Roll - Report.pdf
CludioGomesdaSilva
 
Sb- and Sn-based materials in Na-ion batteries
Sb- and Sn-based materials in Na-ion batteriesSb- and Sn-based materials in Na-ion batteries
Sb- and Sn-based materials in Na-ion batteries
MichouRatisou
 
Introduction to Black Hole and how its formed
Introduction to Black Hole and how its formedIntroduction to Black Hole and how its formed
Introduction to Black Hole and how its formed
MSafiullahALawi
 
Examining Visual Attention in Gaze-Driven VR Learning: An Eye-Tracking Study ...
Examining Visual Attention in Gaze-Driven VR Learning: An Eye-Tracking Study ...Examining Visual Attention in Gaze-Driven VR Learning: An Eye-Tracking Study ...
Examining Visual Attention in Gaze-Driven VR Learning: An Eye-Tracking Study ...
Yasasi Abeysinghe
 
MITOSIS PRESENTATION FOR BIOLOGY AND HSB.pptx
MITOSIS PRESENTATION FOR BIOLOGY AND HSB.pptxMITOSIS PRESENTATION FOR BIOLOGY AND HSB.pptx
MITOSIS PRESENTATION FOR BIOLOGY AND HSB.pptx
shereneramdon1109
 
Artificial Intelligence_in_Chemistry_Presentation.pptx
Artificial Intelligence_in_Chemistry_Presentation.pptxArtificial Intelligence_in_Chemistry_Presentation.pptx
Artificial Intelligence_in_Chemistry_Presentation.pptx
sridevimotupalli
 
Keynote presentation at DeepTest Workshop 2025
Keynote presentation at DeepTest Workshop 2025Keynote presentation at DeepTest Workshop 2025
Keynote presentation at DeepTest Workshop 2025
Shiva Nejati
 
Subject name: Introduction to psychology
Subject name: Introduction to psychologySubject name: Introduction to psychology
Subject name: Introduction to psychology
beebussy155
 
Share THE SENSORY SYSTEMS (Auditory sense).pptx
Share THE SENSORY SYSTEMS (Auditory sense).pptxShare THE SENSORY SYSTEMS (Auditory sense).pptx
Share THE SENSORY SYSTEMS (Auditory sense).pptx
CHUsman65
 
Antliff, Allan . - Anarchist Modernism. Art, Politics, and the First American...
Antliff, Allan . - Anarchist Modernism. Art, Politics, and the First American...Antliff, Allan . - Anarchist Modernism. Art, Politics, and the First American...
Antliff, Allan . - Anarchist Modernism. Art, Politics, and the First American...
Francisco Sandoval Martínez
 
Understanding Quantitative Research.pptx
Understanding Quantitative Research.pptxUnderstanding Quantitative Research.pptx
Understanding Quantitative Research.pptx
AzkaRao2
 
Antliff, Mark. - Avant-Garde Fascism. The Mobilization of Myth, Art, and Cult...
Antliff, Mark. - Avant-Garde Fascism. The Mobilization of Myth, Art, and Cult...Antliff, Mark. - Avant-Garde Fascism. The Mobilization of Myth, Art, and Cult...
Antliff, Mark. - Avant-Garde Fascism. The Mobilization of Myth, Art, and Cult...
Francisco Sandoval Martínez
 
AT-03992-BRO-Aspen Plus.pdf se re quiere
AT-03992-BRO-Aspen Plus.pdf se re quiereAT-03992-BRO-Aspen Plus.pdf se re quiere
AT-03992-BRO-Aspen Plus.pdf se re quiere
LiangChenXu1
 
Lower_Limb_mcqs_copy.pdfkrrrrkrkeoeleenekspeke
Lower_Limb_mcqs_copy.pdfkrrrrkrkeoeleenekspekeLower_Limb_mcqs_copy.pdfkrrrrkrkeoeleenekspeke
Lower_Limb_mcqs_copy.pdfkrrrrkrkeoeleenekspeke
ParamiVihanga
 
A tale of two Lucies: talk at the maths dept, Free University of Amsterdam
A tale of two Lucies: talk at the maths dept, Free University of AmsterdamA tale of two Lucies: talk at the maths dept, Free University of Amsterdam
A tale of two Lucies: talk at the maths dept, Free University of Amsterdam
Richard Gill
 
Ad

Lect 1 Introduction Statistics.pdf

  • 2. Introduction of Statistics • Statistics as Singular (Subject) Statistics is the science of conducting studies to collect, organize, summarize, analyze, and draw conclusions from data. Statistic (Singular Without s ) Characteristics of Sample e.g mean ҧ 𝑥 & Standard deviation 𝑠 of sample • Statistics as Plural (Data) means Data (Facts and Figures) e.g No. of students in 18 Batch No. of Covid 19 Patient in Pak No of universities Teaching online
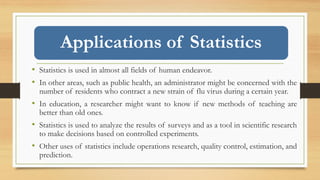
  • 3. Applications of Statistics • Statistics is used in almost all fields of human endeavor. • In other areas, such as public health, an administrator might be concerned with the number of residents who contract a new strain of flu virus during a certain year. • In education, a researcher might want to know if new methods of teaching are better than old ones. • Statistics is used to analyze the results of surveys and as a tool in scientific research to make decisions based on controlled experiments. • Other uses of statistics include operations research, quality control, estimation, and prediction.
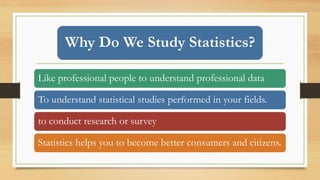
  • 4. Why Do We Study Statistics? Like professional people to understand professional data To understand statistical studies performed in your fields. to conduct research or survey Statistics helps you to become better consumers and citizens.
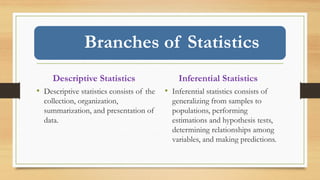
  • 5. Branches of Statistics Descriptive Statistics • Descriptive statistics consists of the collection, organization, summarization, and presentation of data. Inferential Statistics • Inferential statistics consists of generalizing from samples to populations, performing estimations and hypothesis tests, determining relationships among variables, and making predictions.
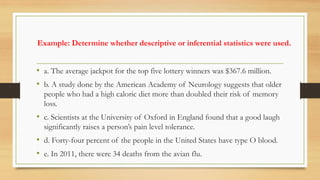
  • 6. Example: Determine whether descriptive or inferential statistics were used. • a. The average jackpot for the top five lottery winners was $367.6 million. • b. A study done by the American Academy of Neurology suggests that older people who had a high caloric diet more than doubled their risk of memory loss. • c. Scientists at the University of Oxford in England found that a good laugh significantly raises a person’s pain level tolerance. • d. Forty-four percent of the people in the United States have type O blood. • e. In 2011, there were 34 deaths from the avian flu.
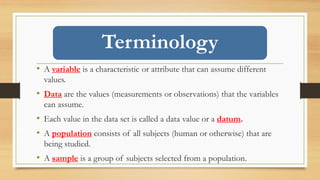
  • 7. Terminology • A variable is a characteristic or attribute that can assume different values. • Data are the values (measurements or observations) that the variables can assume. • Each value in the data set is called a data value or a datum. • A population consists of all subjects (human or otherwise) that are being studied. • A sample is a group of subjects selected from a population.
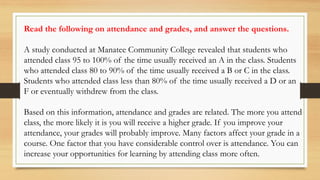
  • 8. Read the following on attendance and grades, and answer the questions. A study conducted at Manatee Community College revealed that students who attended class 95 to 100% of the time usually received an A in the class. Students who attended class 80 to 90% of the time usually received a B or C in the class. Students who attended class less than 80% of the time usually received a D or an F or eventually withdrew from the class. Based on this information, attendance and grades are related. The more you attend class, the more likely it is you will receive a higher grade. If you improve your attendance, your grades will probably improve. Many factors affect your grade in a course. One factor that you have considerable control over is attendance. You can increase your opportunities for learning by attending class more often.
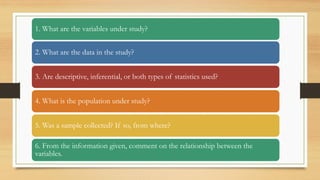
  • 9. 1. What are the variables under study? 2. What are the data in the study? 3. Are descriptive, inferential, or both types of statistics used? 4. What is the population under study? 5. Was a sample collected? If so, from where? 6. From the information given, comment on the relationship between the variables.
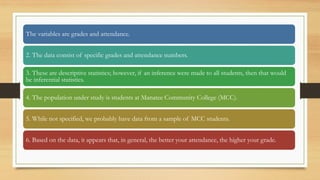
  • 10. The variables are grades and attendance. 2. The data consist of specific grades and attendance numbers. 3. These are descriptive statistics; however, if an inference were made to all students, then that would be inferential statistics. 4. The population under study is students at Manatee Community College (MCC). 5. While not specified, we probably have data from a sample of MCC students. 6. Based on the data, it appears that, in general, the better your attendance, the higher your grade.
  • 11. The classification of variables Variables Qualitative Quantitative
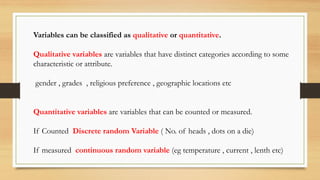
  • 12. Variables can be classified as qualitative or quantitative. Qualitative variables are variables that have distinct categories according to some characteristic or attribute. gender , grades , religious preference , geographic locations etc Quantitative variables are variables that can be counted or measured. If Counted Discrete random Variable ( No. of heads , dots on a die) If measured continuous random variable (eg temperature , current , lenth etc)
  • 13. Classify each variable as a discrete variable or a continuous variable. a. The highest wind speed of a hurricane b. The weight of baggage on an airplane c. The number of pages in a statistics book d. The amount of money a person spends per year for online purchases
  • 14. a. Continuous, since wind speed must be measured b. Continuous, since weight is measured c. Discrete, since the number of pages is countable d. Discrete, since the smallest value that money can assume is in cents
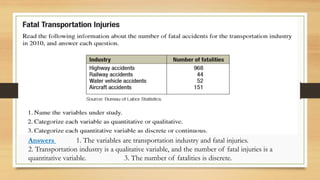
  • 15. Answers 1. The variables are transportation industry and fatal injuries. 2. Transportation industry is a qualitative variable, and the number of fatal injuries is a quantitative variable. 3. The number of fatalities is discrete.
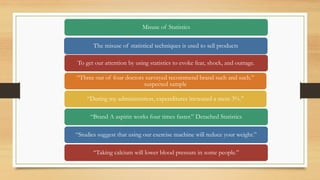
  • 16. Misuse of Statistics The misuse of statistical techniques is used to sell products To get our attention by using statistics to evoke fear, shock, and outrage. “Three out of four doctors surveyed recommend brand such and such.” suspected sample “During my administration, expenditures increased a mere 3%.” “Brand A aspirin works four times faster.” Detached Statistics “Studies suggest that using our exercise machine will reduce your weight.” “Taking calcium will lower blood pressure in some people.”
  • 17. Two sayings that have been around for a long time illustrate this point: “There are three types of lies—lies, damn lies, and statistics.” “Figures don’t lie, but liars figure.”