SlideShare a Scribd company logo
SAS DIPLOMA IN BUSINESS MANAGEMENT

                      Statistics (Individual Assignment)
                         Date of report submission: 27th April 2009

                           Name of student : Kua Siong Zhuang
                                  NRIC : S8237534D


                                         Synopsis

Statistics are used by all industries and businesses as a standardized unit of measurement for
presenting data in a useful and meaningful format. For managers and leaders, statistics provide
insight into how business units are performing relative to an organizations goals and objectives

Explain and illustrate with examples how statistics is used in organizations and analyse how it
has been able to contribute to Organizational Decision-making.

You may select any organization (public / private sector) or business domain and use it as a
basis for your discussion and reference.
Contents

Introduction of Statistics                                        Page 3

Common Statistical Terminology with Applications                  Page 4 – 6

Overview of American Express                                      Page 7

American Express Total Returns to Shareholder                     Page 8

Pie Chart on American Express cards members                       Page 9

Bar Chart on American Express card holder spending VS Age Group   Page 10

Key Charateristics of Resident Labour Force, 1997 – 2007          Page 11

Most Favorable Spending of Retailer Merchant Categories           Page 12

American Express Road Show Statistic for Year 2008                Page 13

American Express Out-door sales team performance for Year 2008    Page 14

American Express Market review during bad economies               Page 15

List of references                                                Page 16


                                                                               2
Introduction of Statistics
Statistics is the scientific application of mathematical principles to the collection, analysis, and
presentation of numerical data

It is the study of data that includes descriptive statistics the study of methods and tools for
collecting data. Mathematical models to describe and interpret data and inferential statistics the
systems and techniques for making probability-based decisions and accurate predictions based on
incomplete sample ot data.

Statistics is a discipline which is concerned with:

      •    Use data to solve a wide variety of fields
      •    Designing experiments and other data collection,
      •    Summarizing information to aid understanding,
      •    Drawing conclusions from data, and
      •    Estimating the present or predicting the future.

In making predictions, Statistics uses the companion subject of Probability, which models chance
mathematically and enables calculations of chance in complicated cases.

Data are not just numbers, but numbers that carry information about a specific setting and need to
be interpreted in that setting. With the growth in the use of data comes a growing demand for the
services of statisticians, who are experts in the following:

  •       Producing trustworthy data
  •       Analyzing data to make their meaning clear
  •       Drawing practical conclusions from data

The main objective of Business Statistics is to make inferences (e.g., prediction, making decisions)
about certain characteristics of a population based on information contained in a random sample
from the entire population. The condition for randomness is essential to make sure the sample is
representative of the population.

Business Statistics is the science of good decision making in the face of uncertainty and is used in
many disciplines, such as financial analysis, econometrics, auditing, production and operations,
and marketing research. It provides knowledge and skills to interpret and use statistical techniques
in a variety of business applications.

Just like weather, if you cannot control something, you should learn how to measure and analyze
it, in order to predict it, effectively.


                                                                                                       3
Common Statistical Terminology with Applications

Like all profession, also statisticians have their own keywords and phrases to ease a precise
communication. However, one must interpret the results of any decision making in a language that
is easy for the decision-maker to understand. Otherwise, he/she does not believe in what you
recommend, and therefore does not go into the implementation phase. This lack of communication
between statisticians and the managers is the major roadblock for using statistics.

Population: A population is any entire collection of people, animals, plants or things on which we
may collect data. It is the entire group of interest, which we wish to describe or about which we
wish to draw conclusions. In the above figure the life of the light bulbs manufactured say by GE, is
the concerned population.

Qualitative and Quantitative Variables: Any object or event, which can vary in successive
observations either in quantity or quality is called a"variable." Variables are classified accordingly
as quantitative or qualitative. A qualitative variable, unlike a quantitative variable does not vary in
magnitude in successive observations. The values of quantitative and qualitative variables are
called"Variates" and"Attributes", respectively.

Variable: A characteristic or phenomenon, which may take different values, such as weight,
gender since they are different from individual to individual.

Randomness: Randomness means unpredictability. The fascinating fact about inferential statistics
is that, although each random observation may not be predictable when taken alone, collectively
they follow a predictable pattern called its distribution function. For example, it is a fact that the
distribution of a sample average follows a normal distribution for sample size over 30. In other
words, an extreme value of the sample mean is less likely than an extreme value of a few raw data.

Sample: A subset of a population or universe.

An Experiment: An experiment is a process whose outcome is not known in advance with
certainty.

Statistical Experiment: An experiment in general is an operation in which one chooses the values
of some variables and measures the values of other variables, as in physics. A statistical
experiment, in contrast is an operation in which one take a random sample from a population and
infers the values of some variables.

In order to make any generalization about a population, a random sample from the entire
population; that is meant to be representative of the population, is often studied. For each
population, there are many possible samples. A sample statistic gives information about a
corresponding population parameter. For example, the sample mean for a set of data would give
information about the overall population mean m .

It is important that the investigator carefully and completely defines the population before
collecting the sample, including a description of the members to be included.


                                                                                                      4
An experiment is any process or study which results in the collection of data, the outcome of
which is unknown. In statistics, the term is usually restricted to situations in which the researcher
has control over some of the conditions under which the experiment takes place.

Design of experiments is a key tool for increasing the rate of acquiring new knowledge.
Knowledge in turn can be used to gain competitive advantage, shorten the product development
cycle, and produce new products and processes which will meet and exceed your customer's
expectations.

Primary data and Secondary data sets: If the data are from a planned experiment relevant to the
objective(s) of the statistical investigation, collected by the analyst, it is called a Primary Data set.
However, if some condensed records are given to the analyst, it is called a Secondary Data set.

Random Variable: A random variable is a function that assigns a numerical value to each simple
event. For example, in sampling for quality control an item could be defective or non-defective,
therefore, one may assign X=1, and X = 0 for a defective and non-defective item, respectively.
You may assign any other two distinct real numbers, as you wish; however, non-negative integer
random variables are easy to work with. Random variables are needed since one cannot do
arithmetic operations on words; the random variable enables us to compute statistics, such as
average and variance. Any random variable has a distribution of probabilities associated with it.

Probability: Probability (i.e., probing for the unknown) is the tool used for anticipating what the
distribution of data should look like under a given model. Random phenomena are not haphazard:
they display an order that emerges only in the long run and is described by a distribution. The
mathematical description of variation is central to statistics. The probability required for statistical
inference is not primarily axiomatic or combinatorial, but is oriented toward describing data
distributions.

Sampling Unit: A unit is a person, animal, plant or thing which is actually studied by a researcher;
the basic objects upon which the study or experiment is executed. For example, a person; a sample
of soil; a zip code area

Parameter: A parameter is an unknown value, and therefore it has to be estimated. Parameters are
used to represent a certain population characteristic. For example, the population mean m is a
parameter that is often used to indicate the average value of a quantity.

Within a population, a parameter is a fixed value that does not vary. Each sample drawn from the
population has its own value of any statistic that is used to estimate this parameter. For example,
the mean of the data in a sample is used to give information about the overall mean min the
population from which that sample was drawn.

Statistic: A statistic is a quantity that is calculated from a sample of data. It is used to give
information about unknown values in the corresponding population. For example, the average of
the data in a sample is used to give information about the overall average in the population from
which that sample was drawn.

A statistic is a function of an observable random sample. It is therefore an observable random
variable. Notice that, while a statistic is a"function" of observations, unfortunately, it is commonly
called a random"variable" not a function.

                                                                                                        5
It is possible to draw more than one sample from the same population, and the value of a statistic
will in general vary from sample to sample. For example, the average value in a sample is a
statistic. The average values in more than one sample, drawn from the same population, will not
necessarily be equal.

Statistics are often assigned Roman letters (e.g. and s), whereas the equivalent unknown values in
the population (parameters ) are assigned Greek letters (e.g., µ, s).

The word estimate means to esteem, that is giving a value to something. A statistical estimate is an
indication of the value of an unknown quantity based on observed data.

More formally, an estimate is the particular value of an estimator that is obtained from a particular
sample of data and used to indicate the value of a parameter.


                                                                                                     6
Overview of American Express
American Express is a world class prestige brand and well recognizes Multi-National Corporation.
She was established since year 1850 in United States and evolved from a successful express
delivery business into a company that created and sold money orders and travler’s cheques.
American Express is the largest global card issuer by spend volume. One of the to its success has
been offering card members a choice of products designed to meet their spending

In addition to the many cards AMEX issued, they had partnered with more than 100 banks and
other institutions in more than 120 countries to issue cards accepted on the American Express
network.

At year end 2008, American Express had 92.4 million cards-in-force (including cards issuing by
partners), issued in more than 40 currencies with a total billed business of $683 billion.


References: www.americanexpress.com

Top 10 Customer satisfaction (J.D. Power and Associates 2008 Credit Card Satisfaction Study
Rankings)
(Based on a 1,000-point scale)
1. American Express -- 783
2. Discover Card -- 751
3. National City -- 721
4. Chase -- 719
5. U.S. Bank -- 716
6. Washington Mutual -- 712
7. Citi -- 710
8. Wells Fargo -- 709
9. Bank of America -- 692
10. GE Money -- 683
(Source: J.D. Power and Associates, September 2008) – references: www.creditcards.com.sg

                                                                                                 7
American Express Total Returns to Shareholder

This chart compare the cumulative total shareholder return on American Express common shares
with the total return on the S&P 500 Financial index for the last five years. It shoes the growth of a
$100 investment on December 21,2003, including the reinvestment of all diviends.


References: http://www.americanexpress.com


                                                                                                     8
Pie Chart on American Express cards members
Credit cards are personal credit card that gives all segmentation of consumer to enjoy the
benefits discounts and promotions when they pay the bill with American Express merchant.
The following surveys, statistics and analyst reports will show the data of different segments
to help the management and marketing team to identify their most groups of consumer and
which campaign will best reach out to the targeted group.

Sample Data of active American Express card holders in year 2008


                      Year 2008 American Express Active Card Holders


                     40 yrs old & above ,
                           24,000                        21 to 25 yrs old, 3,000

                                                              25 to 30 yrs old , 8,000
                                                    3%
                                            24%       8%


                                                        18%      31 to 35 yrs old , 18,000
                                    25%                                                        21 to 25 yrs old
         40 to 45 yrs old, 25,000                                                              25 to 30 yrs old
                                                  21%
                                                                                               31 to 35 yrs old
                                                    36 to 40 yrs old , 21,000                  36 to 40 yrs old
                                                                                               40 to 45 yrs old
                                                                                               40 yrs old & above


          Age group                               Percentage                    Total no of active card holder

       21 to 25 years old                               3%                               3,000 members

       26 to 30 years old                               9%                               9,000 members

       31 to 25 years old                               18%                              18,000 members

       36 to 40 years old                               21%                              21,000 members

       40 to 45 years old                               25%                              25,000 members

     45 & above years old                               24%                              24,000 members

              Total No. of active card holders                                           100,000 members


                                                                                                                    9
Bar Chart on American Express card holder spending VS Age Group
In this chart, it’s clearly shown that the higher the age group, the spending is higher.
Therefore, the management shall focus their target market more on mature age group from 30
years old has got more spending power or willing to spend more than the younger age group.


                         Year 2008 Spending VS Age Group


   $1,400,000.00
   $1,200,000.00
                                                                           21 to 25 yrs old
   $1,000,000.00                                                           26 to 30 yrs old
     $800,000.00                                                           31 to 35 yrs old
     $600,000.00                                                           36 to 40 yrs old

     $400,000.00                                                           40 to 45 yrs old
                                                                           45 yrs old & above
     $200,000.00
              $-
                                     Age Group


          Age group                   Spending             Total no of active card holder

      21 to 25 years old             $ 450,000.00                  3,000 members

      26 to 30 years old             $ 800,000.00                  9,000 members

      31 to 25 years old            $ 1,192,000.00                 18,000 members

      36 to 40 years old            $ 1,238,000.00                 21,000 members

      40 to 45 years old            $ 1,380,000.00                 25,000 members

     45 & above years old           $ 1,180,000.00                 24,000 members

       Total Spending &
                                    $ 6,240,000.00                100,000 members
           members


                                                                                                10
Key Charateristics of Resident Labour Force, 1997 – 2007
In this tables, we’ll be able to view the analyst between year 1997 to 2007 on the key
characteristics of resident labour force on employment aged between 35 to 64 against the median
monthly income.

The median monthly income shown on recent year 2007 was $ 2,330 on the total. Males median
income was $ 2,500 & Females was $ 2,170.

Based on this report, the conclusions of more males monthly incomes is greater than the females
for a decade. Literally, this report could not conclude the spending of males are higher than
females even though the earnings are greating


References: http://www.mom.gov.sg
Singapore Yearbook of manpower Statistics in Singapore
                                                                                                  11
Most Favorable Spending of Retailer Merchant Categories
The credit cards spending with the retailer merchant is predominately the most revenue based on
records from the number of cards swiped each month.
These data however will need more survey given by card holders as there might be probability of
exploring new or potential merchant categories (e.g. internet purchases) that would be more
favorable & most willingly spend by new and card holders. It can also maximize the spending of
new & existing card holders.

In this questionnaire survey, out of 100,000 new and existing card holders, American Express took
a sample of 60,000 members to give their survey by getting a free pair of movie tickets.
Apparently, only 50,000 samples participated in this survey.

The survey data as follows:


                                                       Age Group & Sex
                                 21 to 30 yrs   31 to 40 yrs   41 to 50 yrs     50 & above yrs
 Flavorite Merchant                  old            old            old                old
 Restaurant / Dining                7312           8421            7120             4260
 Holiday                             850            690            961               795
 Beauty / Spa / fitness centre       902            833            740               425
 Electronics / IT gadget            1002            910            502               382
 Automotive                          563            390            295                55
 Fashion                             800            463            200               104
 Super Market                        984           3284            2063             1252
 Entertainment / Movie /
 Concert                             490            392            300               153
 Internet Purchases                  192            185            120                78
 Others                              462            230            340               500


This survey shows that America Express should focus its promotions on restaurant/dining category
& rewards the existing / new clients.

American Express can also reach out to more dining restaurant to add on the group of their
rewarding merchant.

Secondary will be for electronics / IT Gadget segments. PC show & road shows on IT mall will be
more advantages to bring the awareness that purchases with American Express gives the benefits
& freedom to decide for a wide range of merchant. Shopping will be much fun for AMEX card
holders.


                                                                                                 12
American Express Road Show Statistic for Year 2008

 This Statistics determines & assist management to identify the best location on the road show &
 the sales team effort. The summary will tells the management that which sales team had done the
 best sales performance.

                                                                                                                *No of         No of              % of
                                                                         Sales           No of    No of new    rejected     successful         successful
Road show Venue                                                          Team          Roadshow   sign ups    application    sign ups           Sign ups
In house American
Express Branch                                                             A              24        580             19          561                 97%

Club house or pubs                                                         A              24        440             50          390                 89%
CBD Area Road
show                                                                       B              24        630             53          577                 92%

Door to Door to
offices with free gifts                                                    B              24        560             42          518                 93%

Shopping malls in
town area                                                                  C              24        610           280           330                 54%

Heartlands malls                                                          C               24        320           140           180                 56%

                  Total                                                 3 teams          144        3140          584           2773                80%


                                                                               AMEX Road Show Statistics for Year 2008
     Express house or Road with free town Heartlands
                                                       malls


                                                                C
                            Door to Shopping
     American Club CBD Area offices malls in

                                                       area


                                                                C

                                                                                                                                No of Roadshow
                            Door to


                                                       gifts


                                                                B                                                               No of new sign ups
                                                                                                                                *No of rejected application
                                                       show


                                                                B
                                                       pubs


                                                                A
     In house


                                                       Branch


                                                                A


                                                                    0            200       400       600      800        1000


                                                                                                                                                          13
American Express Out-door sales team performance for Year 2008
Important Notes : Each sales agent will get an incentive of $10 upon signs up with full
application forms filled. It’s a new system implemented on 1st Jan 2008.

Management would like to find out if this rewarding scheme will motivate the drive for each sales
agent.

Conclusions: The management should go into further investigation on sales pitching for Team C as
the % of successful signs up are much lesser compared to the rest of the 2 teams. They might be
abusing the incentive system to convince client to sign up even though the customers’ profile are
not qualify

                                         Total no of           Total no of
                        Total no of                                                % of successful
   Sales Team                             rejected           successful new
                       new sign up                                                     sign up
                                         applicants             sign up
     Team A               1020               69                   951                     93%
     Team B               1190               95                   1095                    92%
     Team C                930              420                   510                     55%
      Total               3140                 584               2556                     80%


                       Sales Team Peformance for Year 2008

                                                                       Total no of new sign up
     1500                                                              Total no of rejected applicants

                                                                       Total no of successful new
     1000                                                              sign up

      500

         0
                                                        new sign up
                                                         Total no of
                                                         successful


              Team B     Team A       Team C
                                                     new sign up
                                                      Total no of


American Express Market review during bad economies


                                                                                                         14
NEW YORK (Fortune) -- In a strange turn of events, American Express is trying to run off
some of the customers it went out of its way to attract earlier this decade.

The credit card company was a major beneficiary of the economic boom earlier this decade.
AmEx (AXP, Fortune 500) card use grew at a remarkable 15% annually on average between
2002 and 2007, as American Express spent heavily to attract new users and customers of all
stripes purchased more. Peers such as Discover (DFS) struggled to grow half as fast.

But with the global economic bust well into its second year and more borrowers slipping
behind on their payments, AmEx's rapid growth is being viewed in a less flattering light.
Shares recently hit a 14-year low, prompting billionaire investor Warren Buffett -- whose
Berkshire Hathaway (BRKA, Fortune 500) owns 13% of the New York-based company -- to
pronounce the stock "a hell of a buy at $10."

"American Express is going to be around forever," Buffett said in an interview with CNBC
Monday. "They've got the cream of cardholders. Unfortunately, they have some cardholders
that aren't the cream, too."

AmEx isn't the only credit card issuer to be reducing credit lines and closing unused accounts,
analysts say.


References: http://www.money.cnn.com
Colin Barr, senior writer
Last Updated: March 16, 2009: 6:40 AM ET


List of references

                                                                                            15
https://myxl0ejxxejyz-a2157.bj.tsgdht.cn/2009/03/09/news/amex.growth.fortune/index.htm

http://www.americanexpress.com

http://www.creditcards.com.sg

http://www.mom.gov.sg

http://www.kellyservices.com.sg


                                                                     16
Ad

More Related Content

What's hot (20)

Tajuk 3 Logik dan Metodologi
Tajuk 3 Logik dan MetodologiTajuk 3 Logik dan Metodologi
Tajuk 3 Logik dan Metodologi
Mahyuddin Khalid
 
Chap 10 MGT162
Chap 10 MGT162Chap 10 MGT162
Chap 10 MGT162
Amirun Khan
 
Business Statistics Chapter 1
Business Statistics Chapter 1Business Statistics Chapter 1
Business Statistics Chapter 1
Lux PP
 
5 non-bank financial intermediaries
5  non-bank financial intermediaries5  non-bank financial intermediaries
5 non-bank financial intermediaries
Hajar Hafizah
 
Business Math Chapter 5
Business Math Chapter 5 Business Math Chapter 5
Business Math Chapter 5
Nazrin Nazdri
 
Financial Account group assignment on Financial statement of Golden Agriculture
Financial Account group assignment on Financial statement of Golden AgricultureFinancial Account group assignment on Financial statement of Golden Agriculture
Financial Account group assignment on Financial statement of Golden Agriculture
amykua
 
Islamic derivatives
Islamic derivativesIslamic derivatives
Islamic derivatives
Alveenarshah
 
Salam
SalamSalam
Salam
Aamir Ayaz
 
Pengenalan kepada falsafah
Pengenalan kepada falsafah Pengenalan kepada falsafah
Pengenalan kepada falsafah
Jairdayatie Saifuddin
 
Islamic banking
Islamic bankingIslamic banking
Islamic banking
Imane SBAI
 
sukuk - islamic bond
sukuk - islamic bondsukuk - islamic bond
sukuk - islamic bond
mandalina landy
 
UiTM - BMC Report (ENT300)
UiTM - BMC Report (ENT300)UiTM - BMC Report (ENT300)
UiTM - BMC Report (ENT300)
UMAIRAH KHAIRI
 
Bay Bithaman Ajil - Housing Financing
Bay Bithaman Ajil - Housing FinancingBay Bithaman Ajil - Housing Financing
Bay Bithaman Ajil - Housing Financing
hafizahjupri
 
MARKETING PLAN: PROTON
MARKETING PLAN: PROTONMARKETING PLAN: PROTON
MARKETING PLAN: PROTON
mandalina landy
 
A sample report on financial analysis
A sample report on financial analysisA sample report on financial analysis
A sample report on financial analysis
www.assignmentdesk.co.uk
 
Digitalization
DigitalizationDigitalization
Digitalization
Quantum Metal Corporate University
 
Black schole
Black scholeBlack schole
Black schole
chintu_thakkar9
 
Basic Accounting Assignment (Ratio Analysis Report)
Basic Accounting Assignment (Ratio Analysis Report)Basic Accounting Assignment (Ratio Analysis Report)
Basic Accounting Assignment (Ratio Analysis Report)
imwenhao
 
Medical And Health Takaful
Medical And Health TakafulMedical And Health Takaful
Medical And Health Takaful
mandalina landy
 
Introduction to CTU351
Introduction to CTU351Introduction to CTU351
Introduction to CTU351
Mahyuddin Khalid
 
Tajuk 3 Logik dan Metodologi
Tajuk 3 Logik dan MetodologiTajuk 3 Logik dan Metodologi
Tajuk 3 Logik dan Metodologi
Mahyuddin Khalid
 
Business Statistics Chapter 1
Business Statistics Chapter 1Business Statistics Chapter 1
Business Statistics Chapter 1
Lux PP
 
5 non-bank financial intermediaries
5  non-bank financial intermediaries5  non-bank financial intermediaries
5 non-bank financial intermediaries
Hajar Hafizah
 
Business Math Chapter 5
Business Math Chapter 5 Business Math Chapter 5
Business Math Chapter 5
Nazrin Nazdri
 
Financial Account group assignment on Financial statement of Golden Agriculture
Financial Account group assignment on Financial statement of Golden AgricultureFinancial Account group assignment on Financial statement of Golden Agriculture
Financial Account group assignment on Financial statement of Golden Agriculture
amykua
 
Islamic derivatives
Islamic derivativesIslamic derivatives
Islamic derivatives
Alveenarshah
 
Islamic banking
Islamic bankingIslamic banking
Islamic banking
Imane SBAI
 
UiTM - BMC Report (ENT300)
UiTM - BMC Report (ENT300)UiTM - BMC Report (ENT300)
UiTM - BMC Report (ENT300)
UMAIRAH KHAIRI
 
Bay Bithaman Ajil - Housing Financing
Bay Bithaman Ajil - Housing FinancingBay Bithaman Ajil - Housing Financing
Bay Bithaman Ajil - Housing Financing
hafizahjupri
 
Basic Accounting Assignment (Ratio Analysis Report)
Basic Accounting Assignment (Ratio Analysis Report)Basic Accounting Assignment (Ratio Analysis Report)
Basic Accounting Assignment (Ratio Analysis Report)
imwenhao
 
Medical And Health Takaful
Medical And Health TakafulMedical And Health Takaful
Medical And Health Takaful
mandalina landy
 

Similar to Statistics Assignments 090427 (20)

1.pdf
1.pdf1.pdf
1.pdf
Department of Economics, Entrepreneurship and Business Administration, SumDU
 
Research and Statistics Report- Estonio, Ryan.pptx
Research  and Statistics Report- Estonio, Ryan.pptxResearch  and Statistics Report- Estonio, Ryan.pptx
Research and Statistics Report- Estonio, Ryan.pptx
RyanEstonio
 
What is the importance of statistics.pdf
What is the importance of statistics.pdfWhat is the importance of statistics.pdf
What is the importance of statistics.pdf
Assignment Help
 
Unit III - Statistical Process Control (SPC)
Unit III - Statistical Process Control (SPC)Unit III - Statistical Process Control (SPC)
Unit III - Statistical Process Control (SPC)
Dr.Raja R
 
Mod 2 -Descriptive Analytics - Final ppt.pdf
Mod 2 -Descriptive Analytics - Final ppt.pdfMod 2 -Descriptive Analytics - Final ppt.pdf
Mod 2 -Descriptive Analytics - Final ppt.pdf
anandchauhan9654
 
Unit 2 -Descriptive Analytics - Final ppt (1).pptx
Unit 2 -Descriptive Analytics - Final ppt (1).pptxUnit 2 -Descriptive Analytics - Final ppt (1).pptx
Unit 2 -Descriptive Analytics - Final ppt (1).pptx
gpb2703
 
What is statistics
What is statisticsWhat is statistics
What is statistics
Raj Teotia
 
Data analysis aug-11
Data analysis aug-11Data analysis aug-11
Data analysis aug-11
DrVinodhiniYallagand
 
What is Descriptive Analytics: Benefits, Tools & Example
What is Descriptive Analytics: Benefits, Tools & ExampleWhat is Descriptive Analytics: Benefits, Tools & Example
What is Descriptive Analytics: Benefits, Tools & Example
GrapesTech Solutions
 
Introduction to Statistics
Introduction to Statistics Introduction to Statistics
Introduction to Statistics
Jahanzaib Shah
 
Introduction to Statistics - Basics Statistics Concepts - Day 1- 8614 - B.Ed ...
Introduction to Statistics - Basics Statistics Concepts - Day 1- 8614 - B.Ed ...Introduction to Statistics - Basics Statistics Concepts - Day 1- 8614 - B.Ed ...
Introduction to Statistics - Basics Statistics Concepts - Day 1- 8614 - B.Ed ...
EqraBaig
 
Research EDU821-1.pptx
Research EDU821-1.pptxResearch EDU821-1.pptx
Research EDU821-1.pptx
SalmaNiazi2
 
Presentation of BRM.pptx
Presentation of BRM.pptxPresentation of BRM.pptx
Presentation of BRM.pptx
Gãurãv Kúmàr
 
BUSINESS STATISTICS AND PROBABILITY Chapter 1 By Arbaminich University
BUSINESS STATISTICS AND PROBABILITY Chapter 1 By Arbaminich UniversityBUSINESS STATISTICS AND PROBABILITY Chapter 1 By Arbaminich University
BUSINESS STATISTICS AND PROBABILITY Chapter 1 By Arbaminich University
kedirh150
 
Introduction to Statistics PPT (1).pptx
Introduction to Statistics PPT (1).pptxIntroduction to Statistics PPT (1).pptx
Introduction to Statistics PPT (1).pptx
Rishabh332761
 
Introduction to statistics
Introduction to statisticsIntroduction to statistics
Introduction to statistics
dvy92010
 
Unit 1 pptx.pptx
Unit 1 pptx.pptxUnit 1 pptx.pptx
Unit 1 pptx.pptx
rekhabawa2
 
INTRODUCTION TO DESCRIPTIVE ANALYTICS.pptx
INTRODUCTION TO DESCRIPTIVE ANALYTICS.pptxINTRODUCTION TO DESCRIPTIVE ANALYTICS.pptx
INTRODUCTION TO DESCRIPTIVE ANALYTICS.pptx
JetSiegbert
 
Statistics in business paper
Statistics in business paperStatistics in business paper
Statistics in business paper
Stacey Troup
 
CHAPTER 1.pdf Probability and Statistics for Engineers
CHAPTER 1.pdf Probability and Statistics for EngineersCHAPTER 1.pdf Probability and Statistics for Engineers
CHAPTER 1.pdf Probability and Statistics for Engineers
braveset14
 
Research and Statistics Report- Estonio, Ryan.pptx
Research  and Statistics Report- Estonio, Ryan.pptxResearch  and Statistics Report- Estonio, Ryan.pptx
Research and Statistics Report- Estonio, Ryan.pptx
RyanEstonio
 
What is the importance of statistics.pdf
What is the importance of statistics.pdfWhat is the importance of statistics.pdf
What is the importance of statistics.pdf
Assignment Help
 
Unit III - Statistical Process Control (SPC)
Unit III - Statistical Process Control (SPC)Unit III - Statistical Process Control (SPC)
Unit III - Statistical Process Control (SPC)
Dr.Raja R
 
Mod 2 -Descriptive Analytics - Final ppt.pdf
Mod 2 -Descriptive Analytics - Final ppt.pdfMod 2 -Descriptive Analytics - Final ppt.pdf
Mod 2 -Descriptive Analytics - Final ppt.pdf
anandchauhan9654
 
Unit 2 -Descriptive Analytics - Final ppt (1).pptx
Unit 2 -Descriptive Analytics - Final ppt (1).pptxUnit 2 -Descriptive Analytics - Final ppt (1).pptx
Unit 2 -Descriptive Analytics - Final ppt (1).pptx
gpb2703
 
What is statistics
What is statisticsWhat is statistics
What is statistics
Raj Teotia
 
What is Descriptive Analytics: Benefits, Tools & Example
What is Descriptive Analytics: Benefits, Tools & ExampleWhat is Descriptive Analytics: Benefits, Tools & Example
What is Descriptive Analytics: Benefits, Tools & Example
GrapesTech Solutions
 
Introduction to Statistics
Introduction to Statistics Introduction to Statistics
Introduction to Statistics
Jahanzaib Shah
 
Introduction to Statistics - Basics Statistics Concepts - Day 1- 8614 - B.Ed ...
Introduction to Statistics - Basics Statistics Concepts - Day 1- 8614 - B.Ed ...Introduction to Statistics - Basics Statistics Concepts - Day 1- 8614 - B.Ed ...
Introduction to Statistics - Basics Statistics Concepts - Day 1- 8614 - B.Ed ...
EqraBaig
 
Research EDU821-1.pptx
Research EDU821-1.pptxResearch EDU821-1.pptx
Research EDU821-1.pptx
SalmaNiazi2
 
BUSINESS STATISTICS AND PROBABILITY Chapter 1 By Arbaminich University
BUSINESS STATISTICS AND PROBABILITY Chapter 1 By Arbaminich UniversityBUSINESS STATISTICS AND PROBABILITY Chapter 1 By Arbaminich University
BUSINESS STATISTICS AND PROBABILITY Chapter 1 By Arbaminich University
kedirh150
 
Introduction to Statistics PPT (1).pptx
Introduction to Statistics PPT (1).pptxIntroduction to Statistics PPT (1).pptx
Introduction to Statistics PPT (1).pptx
Rishabh332761
 
Introduction to statistics
Introduction to statisticsIntroduction to statistics
Introduction to statistics
dvy92010
 
Unit 1 pptx.pptx
Unit 1 pptx.pptxUnit 1 pptx.pptx
Unit 1 pptx.pptx
rekhabawa2
 
INTRODUCTION TO DESCRIPTIVE ANALYTICS.pptx
INTRODUCTION TO DESCRIPTIVE ANALYTICS.pptxINTRODUCTION TO DESCRIPTIVE ANALYTICS.pptx
INTRODUCTION TO DESCRIPTIVE ANALYTICS.pptx
JetSiegbert
 
Statistics in business paper
Statistics in business paperStatistics in business paper
Statistics in business paper
Stacey Troup
 
CHAPTER 1.pdf Probability and Statistics for Engineers
CHAPTER 1.pdf Probability and Statistics for EngineersCHAPTER 1.pdf Probability and Statistics for Engineers
CHAPTER 1.pdf Probability and Statistics for Engineers
braveset14
 
Ad

Recently uploaded (20)

Challenges in Migrating Imperative Deep Learning Programs to Graph Execution:...
Challenges in Migrating Imperative Deep Learning Programs to Graph Execution:...Challenges in Migrating Imperative Deep Learning Programs to Graph Execution:...
Challenges in Migrating Imperative Deep Learning Programs to Graph Execution:...
Raffi Khatchadourian
 
Canadian book publishing: Insights from the latest salary survey - Tech Forum...
Canadian book publishing: Insights from the latest salary survey - Tech Forum...Canadian book publishing: Insights from the latest salary survey - Tech Forum...
Canadian book publishing: Insights from the latest salary survey - Tech Forum...
BookNet Canada
 
The No-Code Way to Build a Marketing Team with One AI Agent (Download the n8n...
The No-Code Way to Build a Marketing Team with One AI Agent (Download the n8n...The No-Code Way to Build a Marketing Team with One AI Agent (Download the n8n...
The No-Code Way to Build a Marketing Team with One AI Agent (Download the n8n...
SOFTTECHHUB
 
UiPath Agentic Automation: Community Developer Opportunities
UiPath Agentic Automation: Community Developer OpportunitiesUiPath Agentic Automation: Community Developer Opportunities
UiPath Agentic Automation: Community Developer Opportunities
DianaGray10
 
TrsLabs - Leverage the Power of UPI Payments
TrsLabs - Leverage the Power of UPI PaymentsTrsLabs - Leverage the Power of UPI Payments
TrsLabs - Leverage the Power of UPI Payments
Trs Labs
 
Webinar - Top 5 Backup Mistakes MSPs and Businesses Make .pptx
Webinar - Top 5 Backup Mistakes MSPs and Businesses Make   .pptxWebinar - Top 5 Backup Mistakes MSPs and Businesses Make   .pptx
Webinar - Top 5 Backup Mistakes MSPs and Businesses Make .pptx
MSP360
 
Unlocking Generative AI in your Web Apps
Unlocking Generative AI in your Web AppsUnlocking Generative AI in your Web Apps
Unlocking Generative AI in your Web Apps
Maximiliano Firtman
 
Transcript: Canadian book publishing: Insights from the latest salary survey ...
Transcript: Canadian book publishing: Insights from the latest salary survey ...Transcript: Canadian book publishing: Insights from the latest salary survey ...
Transcript: Canadian book publishing: Insights from the latest salary survey ...
BookNet Canada
 
AsyncAPI v3 : Streamlining Event-Driven API Design
AsyncAPI v3 : Streamlining Event-Driven API DesignAsyncAPI v3 : Streamlining Event-Driven API Design
AsyncAPI v3 : Streamlining Event-Driven API Design
leonid54
 
How analogue intelligence complements AI
How analogue intelligence complements AIHow analogue intelligence complements AI
How analogue intelligence complements AI
Paul Rowe
 
MINDCTI revenue release Quarter 1 2025 PR
MINDCTI revenue release Quarter 1 2025 PRMINDCTI revenue release Quarter 1 2025 PR
MINDCTI revenue release Quarter 1 2025 PR
MIND CTI
 
TrsLabs - Fintech Product & Business Consulting
TrsLabs - Fintech Product & Business ConsultingTrsLabs - Fintech Product & Business Consulting
TrsLabs - Fintech Product & Business Consulting
Trs Labs
 
Reimagine How You and Your Team Work with Microsoft 365 Copilot.pptx
Reimagine How You and Your Team Work with Microsoft 365 Copilot.pptxReimagine How You and Your Team Work with Microsoft 365 Copilot.pptx
Reimagine How You and Your Team Work with Microsoft 365 Copilot.pptx
John Moore
 
Viam product demo_ Deploying and scaling AI with hardware.pdf
Viam product demo_ Deploying and scaling AI with hardware.pdfViam product demo_ Deploying and scaling AI with hardware.pdf
Viam product demo_ Deploying and scaling AI with hardware.pdf
camilalamoratta
 
Cybersecurity Identity and Access Solutions using Azure AD
Cybersecurity Identity and Access Solutions using Azure ADCybersecurity Identity and Access Solutions using Azure AD
Cybersecurity Identity and Access Solutions using Azure AD
VICTOR MAESTRE RAMIREZ
 
UiPath Automation Suite – Cas d'usage d'une NGO internationale basée à Genève
UiPath Automation Suite – Cas d'usage d'une NGO internationale basée à GenèveUiPath Automation Suite – Cas d'usage d'une NGO internationale basée à Genève
UiPath Automation Suite – Cas d'usage d'une NGO internationale basée à Genève
UiPathCommunity
 
Vibe Coding_ Develop a web application using AI (1).pdf
Vibe Coding_ Develop a web application using AI (1).pdfVibe Coding_ Develop a web application using AI (1).pdf
Vibe Coding_ Develop a web application using AI (1).pdf
Baiju Muthukadan
 
GDG Cloud Southlake #42: Suresh Mathew: Autonomous Resource Optimization: How...
GDG Cloud Southlake #42: Suresh Mathew: Autonomous Resource Optimization: How...GDG Cloud Southlake #42: Suresh Mathew: Autonomous Resource Optimization: How...
GDG Cloud Southlake #42: Suresh Mathew: Autonomous Resource Optimization: How...
James Anderson
 
Connect and Protect: Networks and Network Security
Connect and Protect: Networks and Network SecurityConnect and Protect: Networks and Network Security
Connect and Protect: Networks and Network Security
VICTOR MAESTRE RAMIREZ
 
Vaibhav Gupta BAML: AI work flows without Hallucinations
Vaibhav Gupta BAML: AI work flows without HallucinationsVaibhav Gupta BAML: AI work flows without Hallucinations
Vaibhav Gupta BAML: AI work flows without Hallucinations
john409870
 
Challenges in Migrating Imperative Deep Learning Programs to Graph Execution:...
Challenges in Migrating Imperative Deep Learning Programs to Graph Execution:...Challenges in Migrating Imperative Deep Learning Programs to Graph Execution:...
Challenges in Migrating Imperative Deep Learning Programs to Graph Execution:...
Raffi Khatchadourian
 
Canadian book publishing: Insights from the latest salary survey - Tech Forum...
Canadian book publishing: Insights from the latest salary survey - Tech Forum...Canadian book publishing: Insights from the latest salary survey - Tech Forum...
Canadian book publishing: Insights from the latest salary survey - Tech Forum...
BookNet Canada
 
The No-Code Way to Build a Marketing Team with One AI Agent (Download the n8n...
The No-Code Way to Build a Marketing Team with One AI Agent (Download the n8n...The No-Code Way to Build a Marketing Team with One AI Agent (Download the n8n...
The No-Code Way to Build a Marketing Team with One AI Agent (Download the n8n...
SOFTTECHHUB
 
UiPath Agentic Automation: Community Developer Opportunities
UiPath Agentic Automation: Community Developer OpportunitiesUiPath Agentic Automation: Community Developer Opportunities
UiPath Agentic Automation: Community Developer Opportunities
DianaGray10
 
TrsLabs - Leverage the Power of UPI Payments
TrsLabs - Leverage the Power of UPI PaymentsTrsLabs - Leverage the Power of UPI Payments
TrsLabs - Leverage the Power of UPI Payments
Trs Labs
 
Webinar - Top 5 Backup Mistakes MSPs and Businesses Make .pptx
Webinar - Top 5 Backup Mistakes MSPs and Businesses Make   .pptxWebinar - Top 5 Backup Mistakes MSPs and Businesses Make   .pptx
Webinar - Top 5 Backup Mistakes MSPs and Businesses Make .pptx
MSP360
 
Unlocking Generative AI in your Web Apps
Unlocking Generative AI in your Web AppsUnlocking Generative AI in your Web Apps
Unlocking Generative AI in your Web Apps
Maximiliano Firtman
 
Transcript: Canadian book publishing: Insights from the latest salary survey ...
Transcript: Canadian book publishing: Insights from the latest salary survey ...Transcript: Canadian book publishing: Insights from the latest salary survey ...
Transcript: Canadian book publishing: Insights from the latest salary survey ...
BookNet Canada
 
AsyncAPI v3 : Streamlining Event-Driven API Design
AsyncAPI v3 : Streamlining Event-Driven API DesignAsyncAPI v3 : Streamlining Event-Driven API Design
AsyncAPI v3 : Streamlining Event-Driven API Design
leonid54
 
How analogue intelligence complements AI
How analogue intelligence complements AIHow analogue intelligence complements AI
How analogue intelligence complements AI
Paul Rowe
 
MINDCTI revenue release Quarter 1 2025 PR
MINDCTI revenue release Quarter 1 2025 PRMINDCTI revenue release Quarter 1 2025 PR
MINDCTI revenue release Quarter 1 2025 PR
MIND CTI
 
TrsLabs - Fintech Product & Business Consulting
TrsLabs - Fintech Product & Business ConsultingTrsLabs - Fintech Product & Business Consulting
TrsLabs - Fintech Product & Business Consulting
Trs Labs
 
Reimagine How You and Your Team Work with Microsoft 365 Copilot.pptx
Reimagine How You and Your Team Work with Microsoft 365 Copilot.pptxReimagine How You and Your Team Work with Microsoft 365 Copilot.pptx
Reimagine How You and Your Team Work with Microsoft 365 Copilot.pptx
John Moore
 
Viam product demo_ Deploying and scaling AI with hardware.pdf
Viam product demo_ Deploying and scaling AI with hardware.pdfViam product demo_ Deploying and scaling AI with hardware.pdf
Viam product demo_ Deploying and scaling AI with hardware.pdf
camilalamoratta
 
Cybersecurity Identity and Access Solutions using Azure AD
Cybersecurity Identity and Access Solutions using Azure ADCybersecurity Identity and Access Solutions using Azure AD
Cybersecurity Identity and Access Solutions using Azure AD
VICTOR MAESTRE RAMIREZ
 
UiPath Automation Suite – Cas d'usage d'une NGO internationale basée à Genève
UiPath Automation Suite – Cas d'usage d'une NGO internationale basée à GenèveUiPath Automation Suite – Cas d'usage d'une NGO internationale basée à Genève
UiPath Automation Suite – Cas d'usage d'une NGO internationale basée à Genève
UiPathCommunity
 
Vibe Coding_ Develop a web application using AI (1).pdf
Vibe Coding_ Develop a web application using AI (1).pdfVibe Coding_ Develop a web application using AI (1).pdf
Vibe Coding_ Develop a web application using AI (1).pdf
Baiju Muthukadan
 
GDG Cloud Southlake #42: Suresh Mathew: Autonomous Resource Optimization: How...
GDG Cloud Southlake #42: Suresh Mathew: Autonomous Resource Optimization: How...GDG Cloud Southlake #42: Suresh Mathew: Autonomous Resource Optimization: How...
GDG Cloud Southlake #42: Suresh Mathew: Autonomous Resource Optimization: How...
James Anderson
 
Connect and Protect: Networks and Network Security
Connect and Protect: Networks and Network SecurityConnect and Protect: Networks and Network Security
Connect and Protect: Networks and Network Security
VICTOR MAESTRE RAMIREZ
 
Vaibhav Gupta BAML: AI work flows without Hallucinations
Vaibhav Gupta BAML: AI work flows without HallucinationsVaibhav Gupta BAML: AI work flows without Hallucinations
Vaibhav Gupta BAML: AI work flows without Hallucinations
john409870
 
Ad

Statistics Assignments 090427

  • 1. SAS DIPLOMA IN BUSINESS MANAGEMENT Statistics (Individual Assignment) Date of report submission: 27th April 2009 Name of student : Kua Siong Zhuang NRIC : S8237534D Synopsis Statistics are used by all industries and businesses as a standardized unit of measurement for presenting data in a useful and meaningful format. For managers and leaders, statistics provide insight into how business units are performing relative to an organizations goals and objectives Explain and illustrate with examples how statistics is used in organizations and analyse how it has been able to contribute to Organizational Decision-making. You may select any organization (public / private sector) or business domain and use it as a basis for your discussion and reference.
  • 2. Contents Introduction of Statistics Page 3 Common Statistical Terminology with Applications Page 4 – 6 Overview of American Express Page 7 American Express Total Returns to Shareholder Page 8 Pie Chart on American Express cards members Page 9 Bar Chart on American Express card holder spending VS Age Group Page 10 Key Charateristics of Resident Labour Force, 1997 – 2007 Page 11 Most Favorable Spending of Retailer Merchant Categories Page 12 American Express Road Show Statistic for Year 2008 Page 13 American Express Out-door sales team performance for Year 2008 Page 14 American Express Market review during bad economies Page 15 List of references Page 16 2
  • 3. Introduction of Statistics Statistics is the scientific application of mathematical principles to the collection, analysis, and presentation of numerical data It is the study of data that includes descriptive statistics the study of methods and tools for collecting data. Mathematical models to describe and interpret data and inferential statistics the systems and techniques for making probability-based decisions and accurate predictions based on incomplete sample ot data. Statistics is a discipline which is concerned with: • Use data to solve a wide variety of fields • Designing experiments and other data collection, • Summarizing information to aid understanding, • Drawing conclusions from data, and • Estimating the present or predicting the future. In making predictions, Statistics uses the companion subject of Probability, which models chance mathematically and enables calculations of chance in complicated cases. Data are not just numbers, but numbers that carry information about a specific setting and need to be interpreted in that setting. With the growth in the use of data comes a growing demand for the services of statisticians, who are experts in the following: • Producing trustworthy data • Analyzing data to make their meaning clear • Drawing practical conclusions from data The main objective of Business Statistics is to make inferences (e.g., prediction, making decisions) about certain characteristics of a population based on information contained in a random sample from the entire population. The condition for randomness is essential to make sure the sample is representative of the population. Business Statistics is the science of good decision making in the face of uncertainty and is used in many disciplines, such as financial analysis, econometrics, auditing, production and operations, and marketing research. It provides knowledge and skills to interpret and use statistical techniques in a variety of business applications. Just like weather, if you cannot control something, you should learn how to measure and analyze it, in order to predict it, effectively. 3
  • 4. Common Statistical Terminology with Applications Like all profession, also statisticians have their own keywords and phrases to ease a precise communication. However, one must interpret the results of any decision making in a language that is easy for the decision-maker to understand. Otherwise, he/she does not believe in what you recommend, and therefore does not go into the implementation phase. This lack of communication between statisticians and the managers is the major roadblock for using statistics. Population: A population is any entire collection of people, animals, plants or things on which we may collect data. It is the entire group of interest, which we wish to describe or about which we wish to draw conclusions. In the above figure the life of the light bulbs manufactured say by GE, is the concerned population. Qualitative and Quantitative Variables: Any object or event, which can vary in successive observations either in quantity or quality is called a"variable." Variables are classified accordingly as quantitative or qualitative. A qualitative variable, unlike a quantitative variable does not vary in magnitude in successive observations. The values of quantitative and qualitative variables are called"Variates" and"Attributes", respectively. Variable: A characteristic or phenomenon, which may take different values, such as weight, gender since they are different from individual to individual. Randomness: Randomness means unpredictability. The fascinating fact about inferential statistics is that, although each random observation may not be predictable when taken alone, collectively they follow a predictable pattern called its distribution function. For example, it is a fact that the distribution of a sample average follows a normal distribution for sample size over 30. In other words, an extreme value of the sample mean is less likely than an extreme value of a few raw data. Sample: A subset of a population or universe. An Experiment: An experiment is a process whose outcome is not known in advance with certainty. Statistical Experiment: An experiment in general is an operation in which one chooses the values of some variables and measures the values of other variables, as in physics. A statistical experiment, in contrast is an operation in which one take a random sample from a population and infers the values of some variables. In order to make any generalization about a population, a random sample from the entire population; that is meant to be representative of the population, is often studied. For each population, there are many possible samples. A sample statistic gives information about a corresponding population parameter. For example, the sample mean for a set of data would give information about the overall population mean m . It is important that the investigator carefully and completely defines the population before collecting the sample, including a description of the members to be included. 4
  • 5. An experiment is any process or study which results in the collection of data, the outcome of which is unknown. In statistics, the term is usually restricted to situations in which the researcher has control over some of the conditions under which the experiment takes place. Design of experiments is a key tool for increasing the rate of acquiring new knowledge. Knowledge in turn can be used to gain competitive advantage, shorten the product development cycle, and produce new products and processes which will meet and exceed your customer's expectations. Primary data and Secondary data sets: If the data are from a planned experiment relevant to the objective(s) of the statistical investigation, collected by the analyst, it is called a Primary Data set. However, if some condensed records are given to the analyst, it is called a Secondary Data set. Random Variable: A random variable is a function that assigns a numerical value to each simple event. For example, in sampling for quality control an item could be defective or non-defective, therefore, one may assign X=1, and X = 0 for a defective and non-defective item, respectively. You may assign any other two distinct real numbers, as you wish; however, non-negative integer random variables are easy to work with. Random variables are needed since one cannot do arithmetic operations on words; the random variable enables us to compute statistics, such as average and variance. Any random variable has a distribution of probabilities associated with it. Probability: Probability (i.e., probing for the unknown) is the tool used for anticipating what the distribution of data should look like under a given model. Random phenomena are not haphazard: they display an order that emerges only in the long run and is described by a distribution. The mathematical description of variation is central to statistics. The probability required for statistical inference is not primarily axiomatic or combinatorial, but is oriented toward describing data distributions. Sampling Unit: A unit is a person, animal, plant or thing which is actually studied by a researcher; the basic objects upon which the study or experiment is executed. For example, a person; a sample of soil; a zip code area Parameter: A parameter is an unknown value, and therefore it has to be estimated. Parameters are used to represent a certain population characteristic. For example, the population mean m is a parameter that is often used to indicate the average value of a quantity. Within a population, a parameter is a fixed value that does not vary. Each sample drawn from the population has its own value of any statistic that is used to estimate this parameter. For example, the mean of the data in a sample is used to give information about the overall mean min the population from which that sample was drawn. Statistic: A statistic is a quantity that is calculated from a sample of data. It is used to give information about unknown values in the corresponding population. For example, the average of the data in a sample is used to give information about the overall average in the population from which that sample was drawn. A statistic is a function of an observable random sample. It is therefore an observable random variable. Notice that, while a statistic is a"function" of observations, unfortunately, it is commonly called a random"variable" not a function. 5
  • 6. It is possible to draw more than one sample from the same population, and the value of a statistic will in general vary from sample to sample. For example, the average value in a sample is a statistic. The average values in more than one sample, drawn from the same population, will not necessarily be equal. Statistics are often assigned Roman letters (e.g. and s), whereas the equivalent unknown values in the population (parameters ) are assigned Greek letters (e.g., µ, s). The word estimate means to esteem, that is giving a value to something. A statistical estimate is an indication of the value of an unknown quantity based on observed data. More formally, an estimate is the particular value of an estimator that is obtained from a particular sample of data and used to indicate the value of a parameter. 6
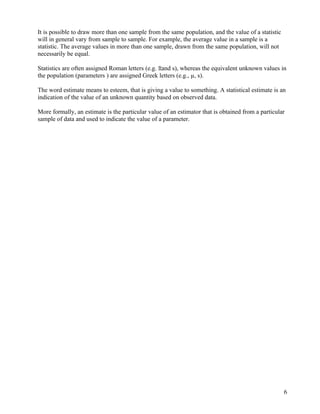
  • 7. Overview of American Express American Express is a world class prestige brand and well recognizes Multi-National Corporation. She was established since year 1850 in United States and evolved from a successful express delivery business into a company that created and sold money orders and travler’s cheques. American Express is the largest global card issuer by spend volume. One of the to its success has been offering card members a choice of products designed to meet their spending In addition to the many cards AMEX issued, they had partnered with more than 100 banks and other institutions in more than 120 countries to issue cards accepted on the American Express network. At year end 2008, American Express had 92.4 million cards-in-force (including cards issuing by partners), issued in more than 40 currencies with a total billed business of $683 billion. References: www.americanexpress.com Top 10 Customer satisfaction (J.D. Power and Associates 2008 Credit Card Satisfaction Study Rankings) (Based on a 1,000-point scale) 1. American Express -- 783 2. Discover Card -- 751 3. National City -- 721 4. Chase -- 719 5. U.S. Bank -- 716 6. Washington Mutual -- 712 7. Citi -- 710 8. Wells Fargo -- 709 9. Bank of America -- 692 10. GE Money -- 683 (Source: J.D. Power and Associates, September 2008) – references: www.creditcards.com.sg 7
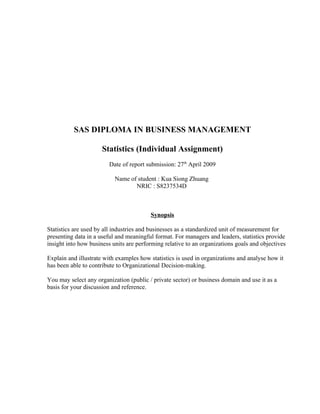
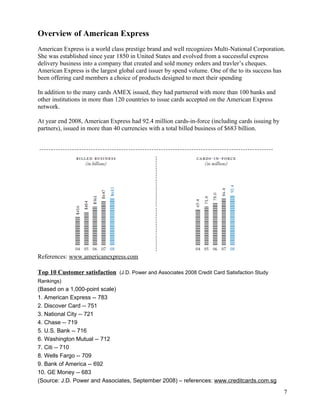
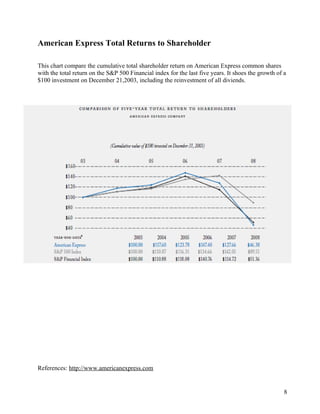
  • 8. American Express Total Returns to Shareholder This chart compare the cumulative total shareholder return on American Express common shares with the total return on the S&P 500 Financial index for the last five years. It shoes the growth of a $100 investment on December 21,2003, including the reinvestment of all diviends. References: http://www.americanexpress.com 8
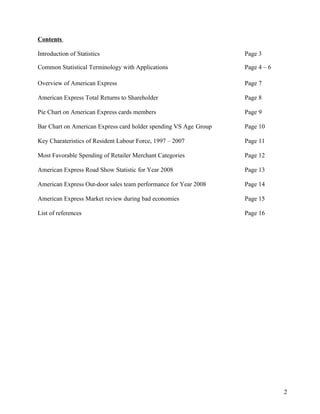
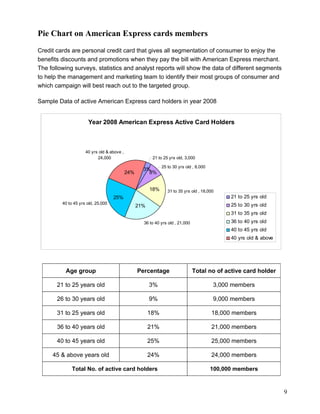
  • 9. Pie Chart on American Express cards members Credit cards are personal credit card that gives all segmentation of consumer to enjoy the benefits discounts and promotions when they pay the bill with American Express merchant. The following surveys, statistics and analyst reports will show the data of different segments to help the management and marketing team to identify their most groups of consumer and which campaign will best reach out to the targeted group. Sample Data of active American Express card holders in year 2008 Year 2008 American Express Active Card Holders 40 yrs old & above , 24,000 21 to 25 yrs old, 3,000 25 to 30 yrs old , 8,000 3% 24% 8% 18% 31 to 35 yrs old , 18,000 25% 21 to 25 yrs old 40 to 45 yrs old, 25,000 25 to 30 yrs old 21% 31 to 35 yrs old 36 to 40 yrs old , 21,000 36 to 40 yrs old 40 to 45 yrs old 40 yrs old & above Age group Percentage Total no of active card holder 21 to 25 years old 3% 3,000 members 26 to 30 years old 9% 9,000 members 31 to 25 years old 18% 18,000 members 36 to 40 years old 21% 21,000 members 40 to 45 years old 25% 25,000 members 45 & above years old 24% 24,000 members Total No. of active card holders 100,000 members 9
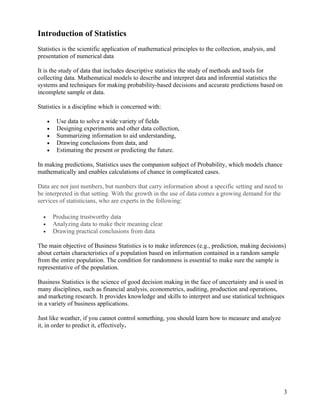
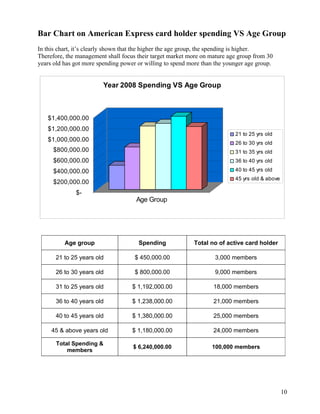
  • 10. Bar Chart on American Express card holder spending VS Age Group In this chart, it’s clearly shown that the higher the age group, the spending is higher. Therefore, the management shall focus their target market more on mature age group from 30 years old has got more spending power or willing to spend more than the younger age group. Year 2008 Spending VS Age Group $1,400,000.00 $1,200,000.00 21 to 25 yrs old $1,000,000.00 26 to 30 yrs old $800,000.00 31 to 35 yrs old $600,000.00 36 to 40 yrs old $400,000.00 40 to 45 yrs old 45 yrs old & above $200,000.00 $- Age Group Age group Spending Total no of active card holder 21 to 25 years old $ 450,000.00 3,000 members 26 to 30 years old $ 800,000.00 9,000 members 31 to 25 years old $ 1,192,000.00 18,000 members 36 to 40 years old $ 1,238,000.00 21,000 members 40 to 45 years old $ 1,380,000.00 25,000 members 45 & above years old $ 1,180,000.00 24,000 members Total Spending & $ 6,240,000.00 100,000 members members 10
  • 11. Key Charateristics of Resident Labour Force, 1997 – 2007 In this tables, we’ll be able to view the analyst between year 1997 to 2007 on the key characteristics of resident labour force on employment aged between 35 to 64 against the median monthly income. The median monthly income shown on recent year 2007 was $ 2,330 on the total. Males median income was $ 2,500 & Females was $ 2,170. Based on this report, the conclusions of more males monthly incomes is greater than the females for a decade. Literally, this report could not conclude the spending of males are higher than females even though the earnings are greating References: http://www.mom.gov.sg Singapore Yearbook of manpower Statistics in Singapore 11
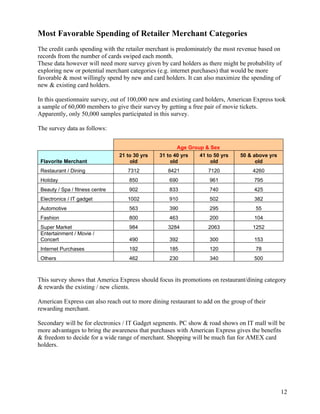
  • 12. Most Favorable Spending of Retailer Merchant Categories The credit cards spending with the retailer merchant is predominately the most revenue based on records from the number of cards swiped each month. These data however will need more survey given by card holders as there might be probability of exploring new or potential merchant categories (e.g. internet purchases) that would be more favorable & most willingly spend by new and card holders. It can also maximize the spending of new & existing card holders. In this questionnaire survey, out of 100,000 new and existing card holders, American Express took a sample of 60,000 members to give their survey by getting a free pair of movie tickets. Apparently, only 50,000 samples participated in this survey. The survey data as follows: Age Group & Sex 21 to 30 yrs 31 to 40 yrs 41 to 50 yrs 50 & above yrs Flavorite Merchant old old old old Restaurant / Dining 7312 8421 7120 4260 Holiday 850 690 961 795 Beauty / Spa / fitness centre 902 833 740 425 Electronics / IT gadget 1002 910 502 382 Automotive 563 390 295 55 Fashion 800 463 200 104 Super Market 984 3284 2063 1252 Entertainment / Movie / Concert 490 392 300 153 Internet Purchases 192 185 120 78 Others 462 230 340 500 This survey shows that America Express should focus its promotions on restaurant/dining category & rewards the existing / new clients. American Express can also reach out to more dining restaurant to add on the group of their rewarding merchant. Secondary will be for electronics / IT Gadget segments. PC show & road shows on IT mall will be more advantages to bring the awareness that purchases with American Express gives the benefits & freedom to decide for a wide range of merchant. Shopping will be much fun for AMEX card holders. 12
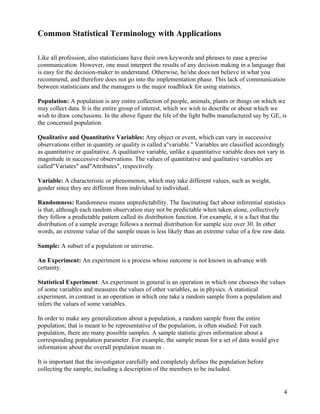
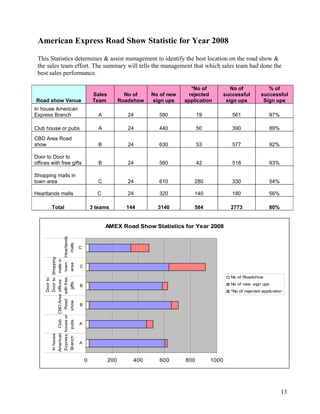
  • 13. American Express Road Show Statistic for Year 2008 This Statistics determines & assist management to identify the best location on the road show & the sales team effort. The summary will tells the management that which sales team had done the best sales performance. *No of No of % of Sales No of No of new rejected successful successful Road show Venue Team Roadshow sign ups application sign ups Sign ups In house American Express Branch A 24 580 19 561 97% Club house or pubs A 24 440 50 390 89% CBD Area Road show B 24 630 53 577 92% Door to Door to offices with free gifts B 24 560 42 518 93% Shopping malls in town area C 24 610 280 330 54% Heartlands malls C 24 320 140 180 56% Total 3 teams 144 3140 584 2773 80% AMEX Road Show Statistics for Year 2008 Express house or Road with free town Heartlands malls C Door to Shopping American Club CBD Area offices malls in area C No of Roadshow Door to gifts B No of new sign ups *No of rejected application show B pubs A In house Branch A 0 200 400 600 800 1000 13
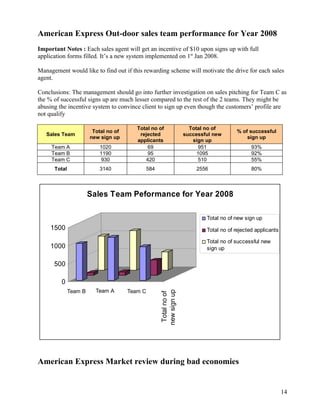
  • 14. American Express Out-door sales team performance for Year 2008 Important Notes : Each sales agent will get an incentive of $10 upon signs up with full application forms filled. It’s a new system implemented on 1st Jan 2008. Management would like to find out if this rewarding scheme will motivate the drive for each sales agent. Conclusions: The management should go into further investigation on sales pitching for Team C as the % of successful signs up are much lesser compared to the rest of the 2 teams. They might be abusing the incentive system to convince client to sign up even though the customers’ profile are not qualify Total no of Total no of Total no of % of successful Sales Team rejected successful new new sign up sign up applicants sign up Team A 1020 69 951 93% Team B 1190 95 1095 92% Team C 930 420 510 55% Total 3140 584 2556 80% Sales Team Peformance for Year 2008 Total no of new sign up 1500 Total no of rejected applicants Total no of successful new 1000 sign up 500 0 new sign up Total no of successful Team B Team A Team C new sign up Total no of American Express Market review during bad economies 14
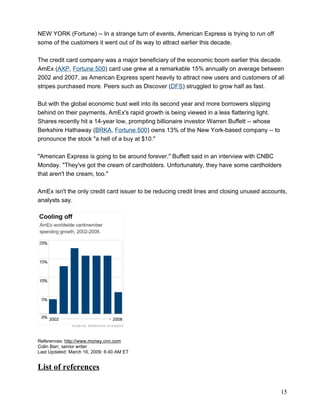
  • 15. NEW YORK (Fortune) -- In a strange turn of events, American Express is trying to run off some of the customers it went out of its way to attract earlier this decade. The credit card company was a major beneficiary of the economic boom earlier this decade. AmEx (AXP, Fortune 500) card use grew at a remarkable 15% annually on average between 2002 and 2007, as American Express spent heavily to attract new users and customers of all stripes purchased more. Peers such as Discover (DFS) struggled to grow half as fast. But with the global economic bust well into its second year and more borrowers slipping behind on their payments, AmEx's rapid growth is being viewed in a less flattering light. Shares recently hit a 14-year low, prompting billionaire investor Warren Buffett -- whose Berkshire Hathaway (BRKA, Fortune 500) owns 13% of the New York-based company -- to pronounce the stock "a hell of a buy at $10." "American Express is going to be around forever," Buffett said in an interview with CNBC Monday. "They've got the cream of cardholders. Unfortunately, they have some cardholders that aren't the cream, too." AmEx isn't the only credit card issuer to be reducing credit lines and closing unused accounts, analysts say. References: http://www.money.cnn.com Colin Barr, senior writer Last Updated: March 16, 2009: 6:40 AM ET List of references 15