Transforming population and migration statistics: Research into developing an alternative approach to producing administrative data-based population stocks and flows
Download as pptx, pdf1 like1,336 views

This slide pack illustrates the Office for National Statistics’ (ONS) research into developing an alternative approach to producing administrative data-based population stocks and flows.


More Related Content
What's hot (20)
Similar to Transforming population and migration statistics: Research into developing an alternative approach to producing administrative data-based population stocks and flows (20)


More from Office for National Statistics (20)


Recently uploaded (20)


Transforming population and migration statistics: Research into developing an alternative approach to producing administrative data-based population stocks and flows
- 1. Transforming population and migration statistics: Research into developing an alternative approach to producing administrative data-based population stocks and flows Published: 30th January 2019 It is important to note that these findings are not Official Statistics. They are based on exploratory research using linked administrative data. These outputs must not be reproduced without this disclaimer and warning note and should not be used for policy- or decision-making. Main messages: • We are investigating an alternative approach to producing population stocks and flows researching the use of ‘single data sources’ combined with ‘signs of activity’ to determine the resident population. • For deriving population stocks, we have looked at various population age groups and considered particular combinations of data to measure the resident population. • This is the first time we’ve considered how we might produce long-term international immigration flows using administrative data. • We will bring these stocks and flows approaches together into one coherent, hybrid model. This slide pack illustrates the Office for National Statistics’ (ONS) research into developing an alternative approach to producing administrative data-based population stocks and flows.
- 2. Population and migration statistics transformation Section Summary Slide number Background to population and migration statistics transformation - Population and migration statistics transformation - How ONS protects data - Understanding data sources and their limitations - Future data sources - Previous research 3 Our research approach: Hybrid model - Stocks-based approach - Flows-based approach - Hybrid model 10 In depth analysis - Case study: HESA student data linked to HMRC Pay As You Earn annual earnings - Case study: HESA non-EU student data linked to Home Office Exit Checks data - Case study: Migrant Worker Scan linked to HMRC/DWP income and benefits data - Case study: Migrant Worker Scan linked to NHS Personal Demographic Service - Using Home Office Exit Checks data to classify migrants - Case study: Using Home Office Exit Checks data to look at circular patterns of movement 26
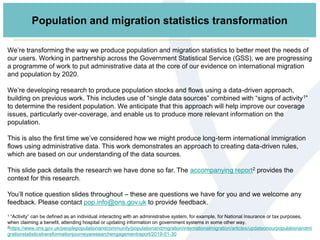
- 3. We’re transforming the way we produce population and migration statistics to better meet the needs of our users. Working in partnership across the Government Statistical Service (GSS), we are progressing a programme of work to put administrative data at the core of our evidence on international migration and population by 2020. We’re developing research to produce population stocks and flows using a data-driven approach, building on previous work. This includes use of “single data sources” combined with “signs of activity1” to determine the resident population. We anticipate that this approach will help improve our coverage issues, particularly over-coverage, and enable us to produce more relevant information on the population. This is also the first time we’ve considered how we might produce long-term international immigration flows using administrative data. This work demonstrates an approach to creating data-driven rules, which are based on our understanding of the data sources. This slide pack details the research we have done so far. The accompanying report2 provides the context for this research. You’ll notice question slides throughout – these are questions we have for you and we welcome any feedback. Please contact pop.info@ons.gov.uk to provide feedback. 1 “Activity” can be defined as an individual interacting with an administrative system, for example, for National Insurance or tax purposes, when claiming a benefit, attending hospital or updating information on government systems in some other way. 2https://www.ons.gov.uk/peoplepopulationandcommunity/populationandmigration/internationalmigration/articles/updateonourpopulationandmi grationstatisticstransformationjourneyaresearchengagementreport/2019-01-30 Population and migration statistics transformation
- 4. How ONS protects data When we bring data together, we are conscious of the importance of data security and privacy, as we are when directly collecting information from the public and businesses through surveys and the census. ONS has a proven track record of protecting data, built over many decades of running the census for England and Wales and the UK’s biggest regular household surveys. In all cases care is taken to ensure that processing of integrated data is in accordance with our legal, data protection and ethical principles and policies. We use the “five safes” framework to safeguard the privacy of individuals. This provides assurance that the data collected from individuals are only used for research and statistical analysis. When we link administrative data sources together, we do this in a way that does not create linked datasets of people nor households with personal identifiers. We use personal records for the purposes of producing aggregate statistics and research only e.g. results for groups of people at a national or regional level. Strong precautions are taken so that any data made available to the public in any form comply with data protection legislation and the confidentiality provisions in the Statistics and Registration Service Act 2007, Digital Economy Act 2017 and the Code of Practice for Statistics. The ONS has recently published a series of revised principles and policies on the use, management and security of data, which can be found here. These set out how we use, manage and secure data, while providing the best standard of statistical information for the public.
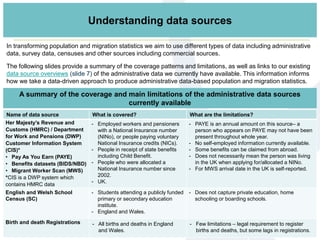
- 5. Understanding data sources In transforming population and migration statistics we aim to use different types of data including administrative data, survey data, censuses and other sources including commercial sources. The following slides provide a summary of the coverage patterns and limitations, as well as links to our existing data source overviews (slide 7) of the administrative data we currently have available. This information informs how we take a data-driven approach to produce administrative data-based population and migration statistics. A summary of the coverage and main limitations of the administrative data sources currently available Name of data source What is covered? What are the limitations? Her Majesty’s Revenue and Customs (HMRC) / Department for Work and Pensions (DWP) Customer Information System (CIS)* • Pay As You Earn (PAYE) • Benefits datasets (BIDS/NBD) • Migrant Worker Scan (MWS) *CIS is a DWP system which contains HMRC data - Employed workers and pensioners with a National Insurance number (NINo), or people paying voluntary National Insurance credits (NICs). - People in receipt of state benefits including Child Benefit. - People who were allocated a National Insurance number since 2002. - UK. - PAYE is an annual amount on this source– a person who appears on PAYE may not have been present throughout whole year. - No self-employed information currently available. - Some benefits can be claimed from abroad. - Does not necessarily mean the person was living in the UK when applying for/allocated a NINo. - For MWS arrival date in the UK is self-reported. English and Welsh School Census (SC) - Students attending a publicly funded primary or secondary education institute. - England and Wales. - Does not capture private education, home schooling or boarding schools. Birth and death Registrations - All births and deaths in England and Wales. - Few limitations – legal requirement to register births and deaths, but some lags in registrations.
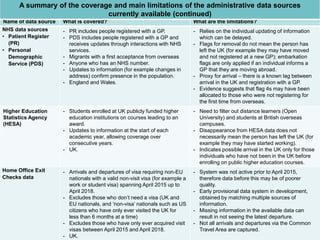
- 6. Name of data source What is covered? What are the limitations? NHS data sources • Patient Register (PR) • Personal Demographic Service (PDS) - PR includes people registered with a GP. - PDS includes people registered with a GP and receives updates through interactions with NHS services. - Migrants with a first acceptance from overseas - Anyone who has an NHS number. - Updates to information (for example changes in address) confirm presence in the population. - England and Wales. - Relies on the individual updating of information which can be delayed. - Flags for removal do not mean the person has left the UK (for example they may have moved and not registered at a new GP); embarkation flags are only applied if an individual informs a GP that they are moving abroad. - Proxy for arrival – there is a known lag between arrival in the UK and registration with a GP. - Evidence suggests that flag 4s may have been allocated to those who were not registering for the first time from overseas. Higher Education Statistics Agency (HESA) - Students enrolled at UK publicly funded higher education institutions on courses leading to an award. - Updates to information at the start of each academic year, allowing coverage over consecutive years. - UK. - Need to filter out distance learners (Open University) and students at British overseas campuses. - Disappearance from HESA data does not necessarily mean the person has left the UK (for example they may have started working). - Indicates possible arrival in the UK only for those individuals who have not been in the UK before enrolling on public higher education courses. Home Office Exit Checks data - Arrivals and departures of visa requiring non-EU nationals with a valid non-visit visa (for example a work or student visa) spanning April 2015 up to April 2018. - Excludes those who don’t need a visa (UK and EU nationals, and ‘non-visa’ nationals such as US citizens who have only ever visited the UK for less than 6 months at a time) - Excludes those who have only ever acquired visit visas between April 2015 and April 2018. - UK. - System was not active prior to April 2015, therefore data before this may be of poorer quality. - Early provisional data system in development, obtained by matching multiple sources of information. - Missing information in the available data can result in not seeing the latest departure. - Not all arrivals and departures via the Common Travel Area are captured. A summary of the coverage and main limitations of the administrative data sources currently available (continued)
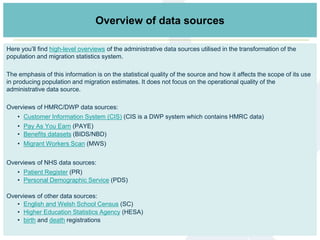
- 7. Here you’ll find high-level overviews of the administrative data sources utilised in the transformation of the population and migration statistics system. The emphasis of this information is on the statistical quality of the source and how it affects the scope of its use in producing population and migration estimates. It does not focus on the operational quality of the administrative data source. Overviews of HMRC/DWP data sources: • Customer Information System (CIS) (CIS is a DWP system which contains HMRC data) • Pay As You Earn (PAYE) • Benefits datasets (BIDS/NBD) • Migrant Workers Scan (MWS) Overviews of NHS data sources: • Patient Register (PR) • Personal Demographic Service (PDS) Overviews of other data sources: • English and Welsh School Census (SC) • Higher Education Statistics Agency (HESA) • birth and death registrations Links to data sources informationOverview of data sources
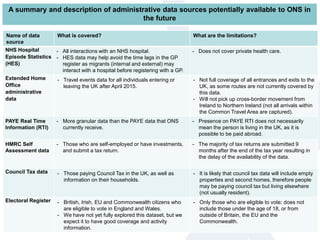
- 8. Name of data source What is covered? What are the limitations? NHS Hospital Episode Statistics (HES) - All interactions with an NHS hospital. - HES data may help avoid the time lags in the GP register as migrants (internal and external) may interact with a hospital before registering with a GP. - Does not cover private health care. Extended Home Office administrative data - Travel events data for all individuals entering or leaving the UK after April 2015. - Not full coverage of all entrances and exits to the UK, as some routes are not currently covered by this data. - Will not pick up cross-border movement from Ireland to Northern Ireland (not all arrivals within the Common Travel Area are captured). PAYE Real Time Information (RTI) - More granular data than the PAYE data that ONS currently receive. - Presence on PAYE RTI does not necessarily mean the person is living in the UK, as it is possible to be paid abroad. HMRC Self Assessment data - Those who are self-employed or have investments, and submit a tax return. - The majority of tax returns are submitted 9 months after the end of the tax year resulting in the delay of the availability of the data. Council Tax data - Those paying Council Tax in the UK, as well as information on their households. - It is likely that council tax data will include empty properties and second homes, therefore people may be paying council tax but living elsewhere (not usually resident). Electoral Register - British, Irish, EU and Commonwealth citizens who are eligible to vote in England and Wales. - We have not yet fully explored this dataset, but we expect it to have good coverage and activity information. - Only those who are eligible to vote; does not include those under the age of 18, or from outside of Britain, the EU and the Commonwealth. A summary and description of administrative data sources potentially available to ONS in the future
- 9. There are known issues with this approach: • by including people purely for being registered in multiple sources, we are incorrectly counting people who have left the country and not de-registered from a data source, resulting in over-coverage • we may miss people that only appear in a single source – this is particularly true for recent migrants who may take weeks, months or years to register on multiple sources (for example 20- to 24-year-old males), resulting in under-coverage Over the last few years we have developed a Statistical Population Dataset (SPD), where we have matched individual records across multiple data sources into a single, coherent dataset that forms the basis for estimating the population. For this approach, any records appearing on two out of the four datasets below were included. This method produced good results at local authority level, but we see some under- and over-coverage when we look at sub- groups of the population (2011). Previous research Comparison of SPD V2.0 with 2011 Census by 5-year age group and sex, England and Wales, 2011
- 10. Our new research approach: bringing stocks and flows together into the hybrid model To build on this previous work we’re currently exploring stocks- and flows-based approaches, which we are bringing together into a hybrid model, to produce administrative data-based population and migration statistics. 1. Stocks-based approach: This involves redesigning the Statistical Population Dataset (SPD) using new data-driven rules for inclusion. Two total stock populations are produced for consecutive years (for example 2015 and 2016) and the difference between the two should account for births, deaths and net migration. 2. Flows-based approach: This uses data-driven rules for inclusion to estimate each of the separate components of change (births, deaths and net migration), which we refer to as population “flows”. These “flows” are then applied to a base stock estimate (for example 2015) to produce a second stock year (for example 2016). 3. Hybrid model: The next step is to bring the stocks- and flows-based approaches together into one coherent hybrid model. This will allow us to compare the strengths and limitations of each approach and triangulate the estimates derived from each to determine the usually resident population. This is an important next step to our work. Our current assumption is that these approaches would be supported by a population coverage survey, which would measure and adjust for coverage patterns in the linked administrative data. Research for this is ongoing.
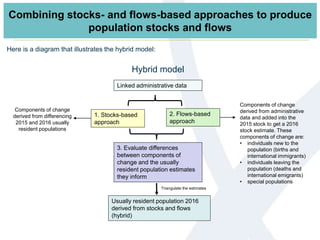
- 11. Combining stocks- and flows-based approaches to produce population stocks and flows Components of change derived from administrative data and added into the 2015 stock to get a 2016 stock estimate. These components of change are: • individuals new to the population (births and international immigrants) • individuals leaving the population (deaths and international emigrants) • special populations Components of change derived from differencing 2015 and 2016 usually resident populations Triangulate the estimates Linked administrative data 2. Flows-based approach 1. Stocks-based approach Usually resident population 2016 derived from stocks and flows (hybrid) 3. Evaluate differences between components of change and the usually resident population estimates they inform Hybrid model Here is a diagram that illustrates the hybrid model:
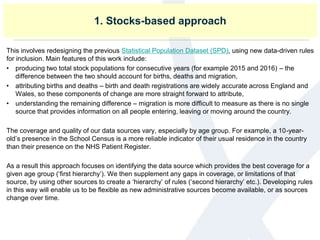
- 12. 1. Stocks-based approach This involves redesigning the previous Statistical Population Dataset (SPD), using new data-driven rules for inclusion. Main features of this work include: • producing two total stock populations for consecutive years (for example 2015 and 2016) – the difference between the two should account for births, deaths and migration, • attributing births and deaths – birth and death registrations are widely accurate across England and Wales, so these components of change are more straight forward to attribute, • understanding the remaining difference – migration is more difficult to measure as there is no single source that provides information on all people entering, leaving or moving around the country. The coverage and quality of our data sources vary, especially by age group. For example, a 10-year- old’s presence in the School Census is a more reliable indicator of their usual residence in the country than their presence on the NHS Patient Register. As a result this approach focuses on identifying the data source which provides the best coverage for a given age group (‘first hierarchy’). We then supplement any gaps in coverage, or limitations of that source, by using other sources to create a ‘hierarchy’ of rules (‘second hierarchy’ etc.). Developing rules in this way will enable us to be flexible as new administrative sources become available, or as sources change over time.
- 13. We’d like your feedback… • What impact will the proposed change in approach have on the way you use population and migration statistics? • Would you be willing to work with us to test the impact of the new approach? Please contact pop.info@ons.gov.uk to provide feedback.
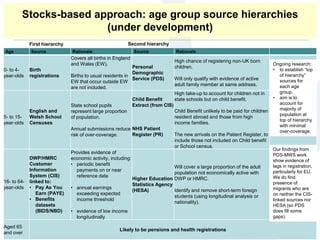
- 14. Stocks-based approach: age group source hierarchies (under development) Age Source Rationale Source Rationale 0- to 4- year-olds Birth registrations Covers all births in England and Wales (EW). Births to usual residents in EW that occur outside EW are not included. Personal Demographic Service (PDS) High chance of registering non-UK born children. Will only qualify with evidence of active adult family member at same address. … 5- to 15- year-olds English and Welsh School Censuses State school pupils represent large proportion of population. Annual submissions reduce risk of over-coverage. Child Benefit Extract (from CIS) NHS Patient Register (PR) High take-up to account for children not in state schools but on child benefit. Child Benefit unlikely to be paid for children resident abroad and those from high income families. The new arrivals on the Patient Register, to include those not included on Child benefit or School census. … 16- to 64- year-olds DWP/HMRC Customer Information System (CIS) linked to: • Pay As You Earn (PAYE) • Benefits datasets (BIDS/NBD) Provides evidence of economic activity, including: • periodic benefit payments on or near reference date • annual earnings exceeding expected income threshold • evidence of low income longitudinally Higher Education Statistics Agency (HESA) Will cover a large proportion of the adult population not economically active with DWP or HMRC. Identify and remove short-term foreign students (using longitudinal analysis or nationality). Aged 65 and over Likely to be pensions and health registrations First hierarchy Ongoing research: • to establish “top of hierarchy” sources for each age group. • aim is to account for majority of population at top of hierarchy with minimal over-coverage. Second hierarchy Our findings from PDS-MWS work show evidence of lags in registration, particularly for EU. We do find presence of migrants who are on neither the CIS- linked sources nor HESA (so PDS does fill some gaps).
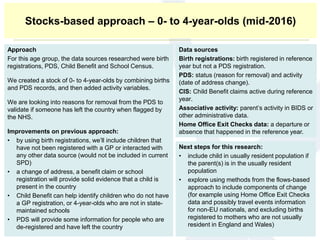
- 15. Stocks-based approach – 0- to 4-year-olds (mid-2016) Approach For this age group, the data sources researched were birth registrations, PDS, Child Benefit and School Census. We created a stock of 0- to 4-year-olds by combining births and PDS records, and then added activity variables. We are looking into reasons for removal from the PDS to validate if someone has left the country when flagged by the NHS. Improvements on previous approach: • by using birth registrations, we’ll include children that have not been registered with a GP or interacted with any other data source (would not be included in current SPD) • a change of address, a benefit claim or school registration will provide solid evidence that a child is present in the country • Child Benefit can help identify children who do not have a GP registration, or 4-year-olds who are not in state- maintained schools • PDS will provide some information for people who are de-registered and have left the country Data sources Birth registrations: birth registered in reference year but not a PDS registration. PDS: status (reason for removal) and activity (date of address change). CIS: Child Benefit claims active during reference year. Associative activity: parent’s activity in BIDS or other administrative data. Home Office Exit Checks data: a departure or absence that happened in the reference year. Next steps for this research: • include child in usually resident population if the parent(s) is in the usually resident population • explore using methods from the flows-based approach to include components of change (for example using Home Office Exit Checks data and possibly travel events information for non-EU nationals, and excluding births registered to mothers who are not usually resident in England and Wales)
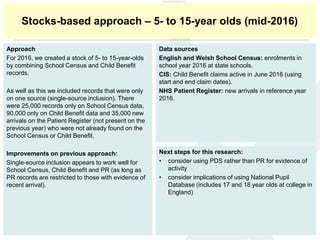
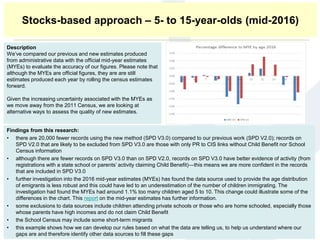
- 16. 2.Stocks based approach – 5-1 year old (mid 2016) Approach For 2016, we created a stock of 5- to 15-year-olds by combining School Census and Child Benefit records. As well as this we included records that were only on one source (single-source inclusion). There were 25,000 records only on School Census data, 90,000 only on Child Benefit data and 35,000 new arrivals on the Patient Register (not present on the previous year) who were not already found on the School Census or Child Benefit. Improvements on previous approach: Single-source inclusion appears to work well for School Census, Child Benefit and PR (as long as PR records are restricted to those with evidence of recent arrival). Data sources English and Welsh School Census: enrolments in school year 2016 at state schools. CIS: Child Benefit claims active in June 2016 (using start and end claim dates). NHS Patient Register: new arrivals in reference year 2016. Next steps for this research: • consider using PDS rather than PR for evidence of activity • consider implications of using National Pupil Database (includes 17 and 18 year olds at college in England) Stocks-based approach – 5- to 15-year olds (mid-2016)
- 17. Findings from this research: • there are 20,000 fewer records using the new method (SPD V3.0) compared to our previous work (SPD V2.0); records on SPD V2.0 that are likely to be excluded from SPD V3.0 are those with only PR to CIS links without Child Benefit nor School Census information • although there are fewer records on SPD V3.0 than on SPD V2.0, records on SPD V3.0 have better evidence of activity (from registrations with a state school or parents’ activity claiming Child Benefit)—this means we are more confident in the records that are included in SPD V3.0 • further investigation into the 2016 mid-year estimates (MYEs) has found the data source used to provide the age distribution of emigrants is less robust and this could have led to an underestimation of the number of children immigrating. The investigation had found the MYEs had around 1.1% too many children aged 5 to 10. This change could illustrate some of the differences in the chart. This report on the mid-year estimates has further information. • some exclusions to data sources include children attending private schools or those who are home schooled, especially those whose parents have high incomes and do not claim Child Benefit • the School Census may include some short-term migrants • this example shows how we can develop our rules based on what the data are telling us, to help us understand where our gaps are and therefore identify other data sources to fill these gaps Description We’ve compared our previous and new estimates produced from administrative data with the official mid-year estimates (MYEs) to evaluate the accuracy of our figures. Please note that although the MYEs are official figures, they are are still estimates produced each year by rolling the census estimates forward. Given the increasing uncertainty associated with the MYEs as we move away from the 2011 Census, we are looking at alternative ways to assess the quality of new estimates. Stocks-based approach – 5- to 15-year-olds (mid-2016)
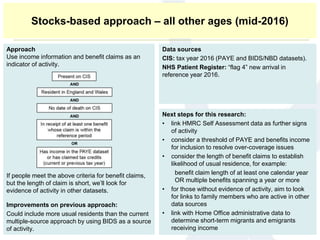
- 18. Approach Use income information and benefit claims as an indicator of activity. If people meet the above criteria for benefit claims, but the length of claim is short, we’ll look for evidence of activity in other datasets. Improvements on previous approach: Could include more usual residents than the current multiple-source approach by using BIDS as a source of activity. Data sources CIS: tax year 2016 (PAYE and BIDS/NBD datasets). NHS Patient Register: “flag 4” new arrival in reference year 2016. Next steps for this research: • link HMRC Self Assessment data as further signs of activity • consider a threshold of PAYE and benefits income for inclusion to resolve over-coverage issues • consider the length of benefit claims to establish likelihood of usual residence, for example: benefit claim length of at least one calendar year OR multiple benefits spanning a year or more • for those without evidence of activity, aim to look for links to family members who are active in other data sources • link with Home Office administrative data to determine short-term migrants and emigrants receiving income Stocks-based approach – all other ages (mid-2016)
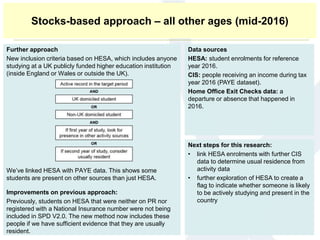
- 19. Further approach New inclusion criteria based on HESA, which includes anyone studying at a UK publicly funded higher education institution (inside England or Wales or outside the UK). We’ve linked HESA with PAYE data. This shows some students are present on other sources than just HESA. Improvements on previous approach: Previously, students on HESA that were neither on PR nor registered with a National Insurance number were not being included in SPD V2.0. The new method now includes these people if we have sufficient evidence that they are usually resident. Data sources HESA: student enrolments for reference year 2016. CIS: people receiving an income during tax year 2016 (PAYE dataset). Home Office Exit Checks data: a departure or absence that happened in 2016. Next steps for this research: • link HESA enrolments with further CIS data to determine usual residence from activity data • further exploration of HESA to create a flag to indicate whether someone is likely to be actively studying and present in the country Stocks-based approach – all other ages (mid-2016)
- 20. 2. Flows-based approach The flows-based approach uses data-driven rules for inclusion to estimate each of the separate components of change (births, deaths and net migration). These flows are applied to a first stock estimate to produce a second stock year. This is similar to the method used in the current population system. This is the first-time we have attempted to produce flows from administrative data.
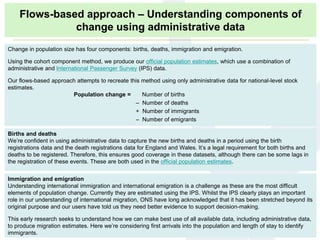
- 21. Births and deaths We’re confident in using administrative data to capture the new births and deaths in a period using the birth registrations data and the death registrations data for England and Wales. It’s a legal requirement for both births and deaths to be registered. Therefore, this ensures good coverage in these datasets, although there can be some lags in the registration of these events. These are both used in the official population estimates. Immigration and emigration Understanding international immigration and international emigration is a challenge as these are the most difficult elements of population change. Currently they are estimated using the IPS. Whilst the IPS clearly plays an important role in our understanding of international migration, ONS have long acknowledged that it has been stretched beyond its original purpose and our users have told us they need better evidence to support decision-making. This early research seeks to understand how we can make best use of all available data, including administrative data, to produce migration estimates. Here we’re considering first arrivals into the population and length of stay to identify immigrants. Change in population size has four components: births, deaths, immigration and emigration. Using the cohort component method, we produce our official population estimates, which use a combination of administrative and International Passenger Survey (IPS) data. Our flows-based approach attempts to recreate this method using only administrative data for national-level stock estimates. Population change = Number of births – Number of deaths + Number of immigrants – Number of emigrants Flows-based approach – Understanding components of change using administrative data
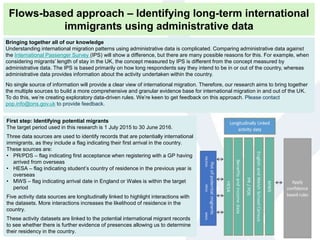
- 22. First step: Identifying potential migrants The target period used in this research is 1 July 2015 to 30 June 2016. Three data sources are used to identify records that are potentially international immigrants, as they include a flag indicating their first arrival in the country. These sources are: • PR/PDS – flag indicating first acceptance when registering with a GP having arrived from overseas • HESA – flag indicating student’s country of residence in the previous year is overseas • MWS – flag indicating arrival date in England or Wales is within the target period Five activity data sources are longitudinally linked to highlight interactions with the datasets. More interactions increases the likelihood of residence in the country. These activity datasets are linked to the potential international migrant records to see whether there is further evidence of presences allowing us to determine their residency in the country. Bringing together all of our knowledge Understanding international migration patterns using administrative data is complicated. Comparing administrative data against the International Passenger Survey (IPS) will show a difference, but there are many possible reasons for this. For example, when considering migrants’ length of stay in the UK, the concept measured by IPS is different from the concept measured by administrative data. The IPS is based primarily on how long respondents say they intend to be in or out of the country, whereas administrative data provides information about the activity undertaken within the country. No single source of information will provide a clear view of international migration. Therefore, our research aims to bring together the multiple sources to build a more comprehensive and granular evidence base for international migration in and out of the UK. To do this, we’re creating exploratory data-driven rules. We’re keen to get feedback on this approach. Please contact pop.info@ons.gov.uk to provide feedback. Flows-based approach – Identifying long-term international immigrants using administrative data
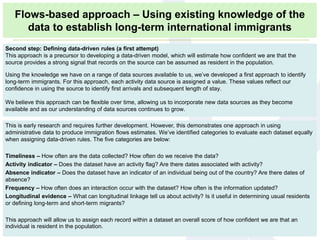
- 23. Second step: Defining data-driven rules (a first attempt) This approach is a precursor to developing a data-driven model, which will estimate how confident we are that the source provides a strong signal that records on the source can be assumed as resident in the population. Using the knowledge we have on a range of data sources available to us, we’ve developed a first approach to identify long-term immigrants. For this approach, each activity data source is assigned a value. These values reflect our confidence in using the source to identify first arrivals and subsequent length of stay. We believe this approach can be flexible over time, allowing us to incorporate new data sources as they become available and as our understanding of data sources continues to grow. This is early research and requires further development. However, this demonstrates one approach in using administrative data to produce immigration flows estimates. We’ve identified categories to evaluate each dataset equally when assigning data-driven rules. The five categories are below: Timeliness – How often are the data collected? How often do we receive the data? Activity indicator – Does the dataset have an activity flag? Are there dates associated with activity? Absence indicator – Does the dataset have an indicator of an individual being out of the country? Are there dates of absence? Frequency – How often does an interaction occur with the dataset? How often is the information updated? Longitudinal evidence – What can longitudinal linkage tell us about activity? Is it useful in determining usual residents or defining long-term and short-term migrants? This approach will allow us to assign each record within a dataset an overall score of how confident we are that an individual is resident in the population. Flows-based approach – Using existing knowledge of the data to establish long-term international immigrants
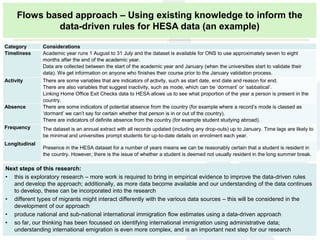
- 24. Category Considerations Timeliness Academic year runs 1 August to 31 July and the dataset is available for ONS to use approximately seven to eight months after the end of the academic year. Data are collected between the start of the academic year and January (when the universities start to validate their data). We get information on anyone who finishes their course prior to the January validation process. Activity There are some variables that are indicators of activity, such as start date, end date and reason for end. There are also variables that suggest inactivity, such as mode, which can be ‘dormant’ or ‘sabbatical’. Linking Home Office Exit Checks data to HESA allows us to see what proportion of the year a person is present in the country. Absence There are some indicators of potential absence from the country (for example where a record’s mode is classed as ‘dormant’ we can’t say for certain whether that person is in or out of the country). There are indicators of definite absence from the country (for example student studying abroad). Frequency The dataset is an annual extract with all records updated (including any drop-outs) up to January. Time lags are likely to be minimal and universities prompt students for up-to-date details on enrolment each year. Longitudinal Presence in the HESA dataset for a number of years means we can be reasonably certain that a student is resident in the country. However, there is the issue of whether a student is deemed not usually resident in the long summer break. Next steps of this research: • this is exploratory research – more work is required to bring in empirical evidence to improve the data-driven rules and develop the approach; additionally, as more data become available and our understanding of the data continues to develop, these can be incorporated into the research • different types of migrants might interact differently with the various data sources – this will be considered in the development of our approach • produce national and sub-national international immigration flow estimates using a data-driven approach • so far, our thinking has been focussed on identifying international immigration using administrative data; understanding international emigration is even more complex, and is an important next step for our research Flows based approach – Using existing knowledge to inform the data-driven rules for HESA data (an example)
- 25. • At what geographic level do you need international migration statistics? How important is it to be able to use these statistics at a regional or local authority level? Please contact pop.info@ons.gov.uk to provide feedback. We’d like your feedback…
- 26. Introduction to case studies We have also produced a series of in-depth case studies, which inform our rules and put a spotlight on what linking together specific data sources – such as immigration, education, health and tax records - can tell us about migration. The following slides provide an overview of these and support the research for putting administrative data at the core of population and migration statistics.
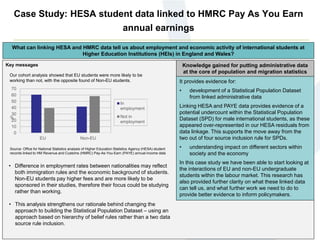
- 27. Case Study: HESA student data linked to HMRC Pay As You Earn annual earnings Key messages What can linking HESA and HMRC data tell us about employment and economic activity of international students at Higher Education Institutions (HEIs) in England and Wales? Our cohort analysis showed that EU students were more likely to be working than not, with the opposite found of Non-EU students. 0 10 20 30 40 50 60 70 EU Non-EU % In employment Not in employment • Difference in employment rates between nationalities may reflect both immigration rules and the economic background of students. Non-EU students pay higher fees and are more likely to be sponsored in their studies, therefore their focus could be studying rather than working. • This analysis strengthens our rationale behind changing the approach to building the Statistical Population Dataset – using an approach based on hierarchy of belief rules rather than a two data source rule inclusion. Source: Office for National Statistics analysis of Higher Education Statistics Agency (HESA) student records linked to HM Revenue and Customs (HMRC) Pay-As-You-Earn (PAYE) annual income data Knowledge gained for putting administrative data at the core of population and migration statistics It provides evidence for: • development of a Statistical Population Dataset from linked administrative data Linking HESA and PAYE data provides evidence of a potential undercount within the Statistical Population Dataset (SPD) for male international students, as these appeared over-represented in our HESA residuals from data linkage. This supports the move away from the two out of four source inclusion rule for SPDs. • understanding impact on different sectors within society and the economy In this case study we have been able to start looking at the interactions of EU and non-EU undergraduate students within the labour market. This research has also provided further clarity on what these linked data can tell us, and what further work we need to do to provide better evidence to inform policymakers.
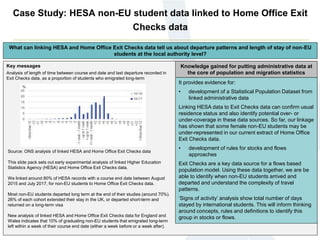
- 28. Case Study: HESA non-EU student data linked to Home Office Exit Checks data Key messages Knowledge gained for putting administrative data at the core of population and migration statistics What can linking HESA and Home Office Exit Checks data tell us about departure patterns and length of stay of non-EU students at the local authority level? Analysis of length of time between course end date and last departure recorded in Exit Checks data, as a proportion of students who emigrated long-term This slide pack sets out early experimental analysis of linked Higher Education Statistics Agency (HESA) and Home Office Exit Checks data. We linked around 80% of HESA records with a course end date between August 2015 and July 2017, for non-EU students to Home Office Exit Checks data. Most non-EU students departed long term at the end of their studies (around 70%). 26% of each cohort extended their stay in the UK, or departed short-term and returned on a long-term visa New analysis of linked HESA and Home Office Exit Checks data for England and Wales indicates that 10% of graduating non-EU students that emigrated long-term left within a week of their course end date (either a week before or a week after). Source: ONS analysis of linked HESA and Home Office Exit Checks data It provides evidence for: • development of a Statistical Population Dataset from linked administrative data Linking HESA data to Exit Checks data can confirm usual residence status and also identify potential over- or under-coverage in these data sources. So far, our linkage has shown that some female non-EU students may be under-represented in our current extract of Home Office Exit Checks data. • development of rules for stocks and flows approaches Exit Checks are a key data source for a flows based population model. Using these data together, we are be able to identify when non-EU students arrived and departed and understand the complexity of travel patterns. ‘Signs of activity’ analysis show total number of days stayed by international students. This will inform thinking around concepts, rules and definitions to identify this group in stocks or flows.
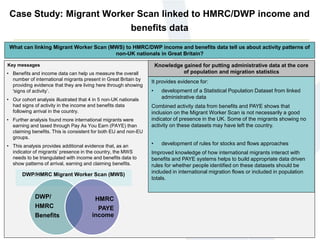
- 29. Case Study: Migrant Worker Scan linked to HMRC/DWP income and benefits data Key messages What can linking Migrant Worker Scan (MWS) to HMRC/DWP income and benefits data tell us about activity patterns of non-UK nationals in Great Britain? • Benefits and income data can help us measure the overall number of international migrants present in Great Britain by providing evidence that they are living here through showing 'signs of activity’. • Our cohort analysis illustrated that 4 in 5 non-UK nationals had signs of activity in the income and benefits data following arrival in the country. • Further analysis found more international migrants were earning and taxed through Pay As You Earn (PAYE) than claiming benefits. This is consistent for both EU and non-EU groups. • This analysis provides additional evidence that, as an indicator of migrants’ presence in the country, the MWS needs to be triangulated with income and benefits data to show patterns of arrival, earning and claiming benefits. DWP/HMRC Migrant Worker Scan (MWS) DWP/ HMRC Benefits HMRC PAYE income Knowledge gained for putting administrative data at the core of population and migration statistics It provides evidence for: • development of a Statistical Population Dataset from linked administrative data Combined activity data from benefits and PAYE shows that inclusion on the Migrant Worker Scan is not necessarily a good indicator of presence in the UK. Some of the migrants showing no activity on these datasets may have left the country. • development of rules for stocks and flows approaches Improved knowledge of how international migrants interact with benefits and PAYE systems helps to build appropriate data driven rules for whether people identified on these datasets should be included in international migration flows or included in population totals.
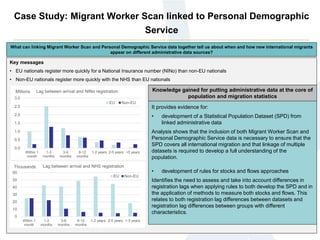
- 30. Case Study: Migrant Worker Scan linked to Personal Demographic Service Key messages • EU nationals register more quickly for a National Insurance number (NINo) than non-EU nationals • Non-EU nationals register more quickly with the NHS than EU nationals What can linking Migrant Worker Scan and Personal Demographic Service data together tell us about when and how new international migrants appear on different administrative data sources? 0.0 0.5 1.0 1.5 2.0 2.5 3.0 Within 1 month 1-3 months 3-6 months 6-12 months 1-2 years 2-5 years >5 years Millions Lag between arrival and NINo registration EU Non-EU 0 10 20 30 40 50 60 Within 1 month 1-3 months 3-6 months 6-12 months 1-2 years 2-5 years > 5 years Thousands Lag between arrival and NHS registration EU Non-EU It provides evidence for: • development of a Statistical Population Dataset (SPD) from linked administrative data Analysis shows that the inclusion of both Migrant Worker Scan and Personal Demographic Service data is necessary to ensure that the SPD covers all international migration and that linkage of multiple datasets is required to develop a full understanding of the population. • development of rules for stocks and flows approaches Identifies the need to assess and take into account differences in registration lags when applying rules to both develop the SPD and in the application of methods to measure both stocks and flows. This relates to both registration lag differences between datasets and registration lag differences between groups with different characteristics. Knowledge gained for putting administrative data at the core of population and migration statistics
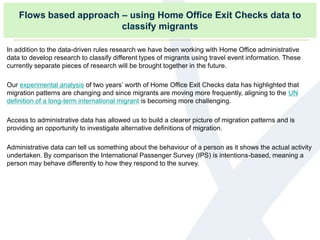
- 31. Flows based approach – using Home Office Exit Checks data to classify migrants In addition to the data-driven rules research we have been working with Home Office administrative data to develop research to classify different types of migrants using travel event information. These currently separate pieces of research will be brought together in the future. Our experimental analysis of two years’ worth of Home Office Exit Checks data has highlighted that migration patterns are changing and since migrants are moving more frequently, aligning to the UN definition of a long-term international migrant is becoming more challenging. Access to administrative data has allowed us to build a clearer picture of migration patterns and is providing an opportunity to investigate alternative definitions of migration. Administrative data can tell us something about the behaviour of a person as it shows the actual activity undertaken. By comparison the International Passenger Survey (IPS) is intentions-based, meaning a person may behave differently to how they respond to the survey.
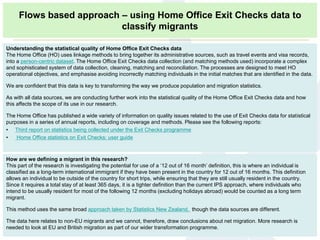
- 32. How are we defining a migrant in this research? This part of the research is investigating the potential for use of a ‘12 out of 16 month’ definition, this is where an individual is classified as a long-term international immigrant if they have been present in the country for 12 out of 16 months. This definition allows an individual to be outside of the country for short trips, while ensuring that they are still usually resident in the country. Since it requires a total stay of at least 365 days, it is a tighter definition than the current IPS approach, where individuals who intend to be usually resident for most of the following 12 months (excluding holidays abroad) would be counted as a long term migrant. This method uses the same broad approach taken by Statistics New Zealand, though the data sources are different. The data here relates to non-EU migrants and we cannot, therefore, draw conclusions about net migration. More research is needed to look at EU and British migration as part of our wider transformation programme. Understanding the statistical quality of Home Office Exit Checks data The Home Office (HO) uses linkage methods to bring together its administrative sources, such as travel events and visa records, into a person-centric dataset. The Home Office Exit Checks data collection (and matching methods used) incorporate a complex and sophisticated system of data collection, cleaning, matching and reconciliation. The processes are designed to meet HO operational objectives, and emphasise avoiding incorrectly matching individuals in the initial matches that are identified in the data. We are confident that this data is key to transforming the way we produce population and migration statistics. As with all data sources, we are conducting further work into the statistical quality of the Home Office Exit Checks data and how this affects the scope of its use in our research. The Home Office has published a wide variety of information on quality issues related to the use of Exit Checks data for statistical purposes in a series of annual reports, including on coverage and methods. Please see the following reports: • Third report on statistics being collected under the Exit Checks programme • Home Office statistics on Exit Checks: user guide Flows based approach – using Home Office Exit Checks data to classify migrants
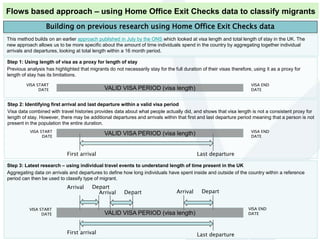
- 33. Step 2: Identifying first arrival and last departure within a valid visa period Visa data combined with travel histories provides data about what people actually did, and shows that visa length is not a consistent proxy for length of stay. However, there may be additional departures and arrivals within that first and last departure period meaning that a person is not present in the population the entire duration. First arrival Last departure Step 1: Using length of visa as a proxy for length of stay Previous analysis has highlighted that migrants do not necessarily stay for the full duration of their visas therefore, using it as a proxy for length of stay has its limitations. VALID VISA PERIOD (visa length) VISA START DATE VISA END DATE Building on previous research using Home Office Exit Checks data VALID VISA PERIOD (visa length)VISA START DATE VISA END DATE This method builds on an earlier approach published in July by the ONS which looked at visa length and total length of stay in the UK. The new approach allows us to be more specific about the amount of time individuals spend in the country by aggregating together individual arrivals and departures, looking at total length within a 16 month period. Step 3: Latest research – using individual travel events to understand length of time present in the UK Aggregating data on arrivals and departures to define how long individuals have spent inside and outside of the country within a reference period can then be used to classify type of migrant. First arrival Last departure Arrival Depart VALID VISA PERIOD (visa length) VISA START DATE VISA END DATE Arrival Depart Arrival Depart Flows based approach – using Home Office Exit Checks data to classify migrants
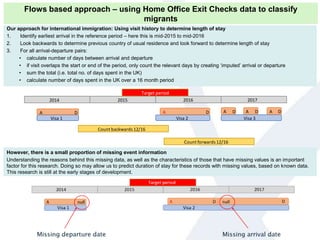
- 34. Our approach for international immigration: Using visit history to determine length of stay 1. Identify earliest arrival in the reference period – here this is mid-2015 to mid-2016 2. Look backwards to determine previous country of usual residence and look forward to determine length of stay 3. For all arrival-departure pairs: • calculate number of days between arrival and departure • if visit overlaps the start or end of the period, only count the relevant days by creating ‘imputed’ arrival or departure • sum the total (i.e. total no. of days spent in the UK) • calculate number of days spent in the UK over a 16 month period However, there is a small proportion of missing event information Understanding the reasons behind this missing data, as well as the characteristics of those that have missing values is an important factor for this research. Doing so may allow us to predict duration of stay for these records with missing values, based on known data. This research is still at the early stages of development. 2014 2015 2016 2017 Visa 1 Visa 2 Visa 3 A D A D A D A D A D Target period Count backwards 12/16 Count forwards 12/16 2014 2015 2016 2017 Visa 1 Visa 2 Visa 3 A D A D A D A D A D Target period Count backwards 12/16 Count forwards 12/16 Flows based approach – using Home Office Exit Checks data to classify migrants
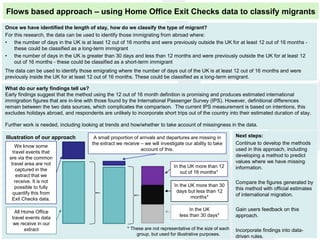
- 35. For international emigration, we use a similar approach, but look at time spent outside of the UK. 1. Identify last departure in the reference period – here this is mid-2015 to mid-2016. 2. Look backwards to determine whether the individual was previously a long-term resident and look forwards to determine time spent outside the country 3. For all departure-arrival pairs: • calculate number of days between departure and arrival • if visit overlaps the start or end of the period, only count the relevant days by creating imputed arrival or departure • sum the total (i.e. total no. of days spent in and out of the UK) • calculate number of days spent out of the UK over a 16 month period As with the international immigration method there is a small proportion of missing event information. We are investigating methods that may allow us to predict duration of stay for these records with missing values. This research is still at the early stages of development. Flows based approach – using Home Office Exit Checks data to classify migrants
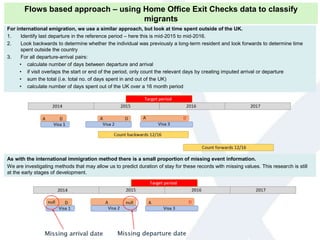
- 36. Next steps: Continue to develop the methods used in this approach, including developing a method to predict values where we have missing information. Compare the figures generated by this method with official estimates of international migration. Gain users feedback on this approach. Incorporate findings into data- driven rules. We know some travel events that are via the common travel area are not captured in the extract that we receive. It is not possible to fully quantify this from Exit Checks data. A small proportion of arrivals and departures are missing in the extract we receive – we will investigate our ability to take account of this. In the UK more than 12 out of 16 months* All Home Office travel events data we receive in our extract * These are not representative of the size of each group, but used for illustrative purposes. In the UK more than 30 days but less than 12 months* In the UK less than 30 days* Illustration of our approach Once we have identified the length of stay, how do we classify the type of migrant? For this research, the data can be used to identify those immigrating from abroad where: • the number of days in the UK is at least 12 out of 16 months and were previously outside the UK for at least 12 out of 16 months - these could be classified as a long-term immigrant • the number of days in the UK is greater than 30 days and less than 12 months and were previously outside the UK for at least 12 out of 16 months - these could be classified as a short-term immigrant The data can be used to identify those emigrating where the number of days out of the UK is at least 12 out of 16 months and were previously inside the UK for at least 12 out of 16 months. These could be classified as a long-term emigrant. What do our early findings tell us? Early findings suggest that the method using the 12 out of 16 month definition is promising and produces estimated international immigration figures that are in-line with those found by the International Passenger Survey (IPS). However, definitional differences remain between the two data sources, which complicates the comparison. The current IPS measurement is based on intentions, this excludes holidays abroad, and respondents are unlikely to incorporate short trips out of the country into their estimated duration of stay. Further work is needed, including looking at trends and how/whether to take account of missingness in the data. Flows based approach – using Home Office Exit Checks data to classify migrants
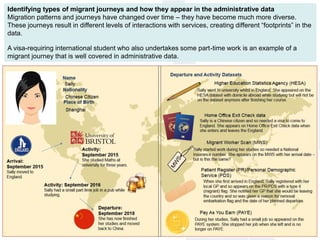
- 37. Identifying types of migrant journeys and how they appear in the administrative data Migration patterns and journeys have changed over time – they have become much more diverse. These journeys result in different levels of interactions with services, creating different “footprints” in the data. A visa-requiring international student who also undertakes some part-time work is an example of a migrant journey that is well covered in administrative data.
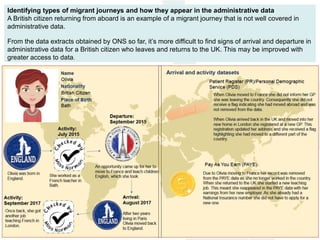
- 38. Identifying types of migrant journeys and how they appear in the administrative data A British citizen returning from aboard is an example of a migrant journey that is not well covered in administrative data. From the data extracts obtained by ONS so far, it’s more difficult to find signs of arrival and departure in administrative data for a British citizen who leaves and returns to the UK. This may be improved with greater access to data.
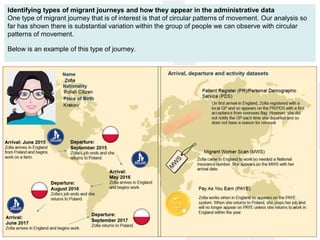
- 39. Identifying types of migrant journeys and how they appear in the administrative data One type of migrant journey that is of interest is that of circular patterns of movement. Our analysis so far has shown there is substantial variation within the group of people we can observe with circular patterns of movement. Below is an example of this type of journey.
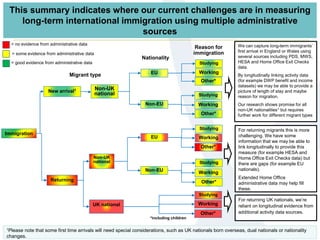
- 40. This summary indicates where our current challenges are in measuring long-term international immigration using multiple administrative sources Studying Working Other* Studying New arrival1 Working Other* Studying Working Other* Studying Working Other* Studying Working Other* UK national Non-UK national Non-UK national Non-EU EU Non-EU EU Immigration Returning Migrant type Nationality Reason for immigration *including children We can capture long-term immigrants’ first arrival in England or Wales using several sources including PDS, MWS, HESA and Home Office Exit Checks data. By longitudinally linking activity data (for example DWP benefit and income datasets) we may be able to provide a picture of length of stay and maybe reason for migration. Our research shows promise for all non-UK nationalities1 but requires further work for different migrant types For returning migrants this is more challenging. We have some information that we may be able to link longitudinally to provide this measure (for example HESA and Home Office Exit Checks data) but there are gaps (for example EU nationals). Extended Home Office administrative data may help fill these. For returning UK nationals, we’re reliant on longitudinal evidence from additional activity data sources. 1Please note that some first time arrivals will need special considerations, such as UK nationals born overseas, dual nationals or nationality changes. = no evidence from administrative data = some evidence from administrative data = good evidence from administrative data
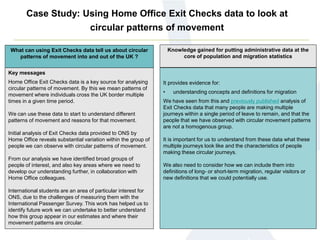
- 41. Case Study: Using Home Office Exit Checks data to look at circular patterns of movement Key messages Home Office Exit Checks data is a key source for analysing circular patterns of movement. By this we mean patterns of movement where individuals cross the UK border multiple times in a given time period. We can use these data to start to understand different patterns of movement and reasons for that movement. Initial analysis of Exit Checks data provided to ONS by Home Office reveals substantial variation within the group of people we can observe with circular patterns of movement. From our analysis we have identified broad groups of people of interest, and also key areas where we need to develop our understanding further, in collaboration with Home Office colleagues. International students are an area of particular interest for ONS, due to the challenges of measuring them with the International Passenger Survey. This work has helped us to identify future work we can undertake to better understand how this group appear in our estimates and where their movement patterns are circular. What can using Exit Checks data tell us about circular patterns of movement into and out of the UK ? Knowledge gained for putting administrative data at the core of population and migration statistics It provides evidence for: • understanding concepts and definitions for migration We have seen from this and previously published analysis of Exit Checks data that many people are making multiple journeys within a single period of leave to remain, and that the people that we have observed with circular movement patterns are not a homogenous group. It is important for us to understand from these data what these multiple journeys look like and the characteristics of people making these circular journeys. We also need to consider how we can include them into definitions of long- or short-term migration, regular visitors or new definitions that we could potentially use.
- 42. • We have demonstrated just a few types of migrant journeys, but this is not an extensive list. We’d like to understand what you think the most important types of journeys are for us to measure? Please contact pop.info@ons.gov.uk to provide feedback. We’d like your feedback…
- 43. What research do we plan to take forward in future? We will: • continue to collaborate closely across the Government Statistical Service (GSS) to build our expertise in the administrative data held across government, and to address key evidence gaps identified by the users of our statistics • improve our processes for linking data together, including carrying out further analysis of the records we could and couldn’t link during our research to date • explore what further breakdowns we can produce from linked administrative data, and what these can tell us more about the characteristics of migrants and the way they interact with public services – including at local level • work with new data sources to address known gaps in coverage • develop our approach to producing population stocks and flows further, based on feedback from our users; a key area of focus will be how we can measure emigration, given there are limited data sources that capture this well • develop an evaluation framework that helps us demonstrate to users our progress towards transforming the population
- 44. Please contact pop.info@ons.gov.uk to provide feedback. • Which aspects of quality (timeliness, frequency, accuracy, coherence, accessibility and interpretability) are most important to you in the production of population and migration statistics? • In the context of the new population and migration statistics system we’ve set out, how would it be helpful to measure and reflect the levels of uncertainty within the outputs? We’d like your feedback…
Editor's Notes
- #15: For slideshare