Unit-X-Data management, types of data and analysis
Download as pptx, pdf0 likes34 views

Lecture on data management


More Related Content
Similar to Unit-X-Data management, types of data and analysis (20)
More from muhammad shahid (20)


Recently uploaded (20)


Unit-X-Data management, types of data and analysis
- 1. Unit-X Data Management Muhammad Shahid MSN,BSN,DCN,RN,BSc Assistant Professor/Principal School of Nursing Kharadar General Hospital
- 2. At the end of this unit, all the students will be able to ◦ Explain the term data ◦ Understand the types of data. ◦ Understand the various methods of data collection. ◦ Discuss the various means and interpretation of data presentation through: Graphs Tables Charts 2
- 3. Data is a collection of factual information (such as measurements or statistics) to be used for a specific purpose such as a survey or analysis as a basis for reasoning, discussion, or calculation Data is a systematic record of particular information Data simply can be described as information It can Be: o Numbers o Words o Measurements o Observations or even just descriptions of things. 3
- 4. Types of Data / Variables DATA Qualitative (Categorical) Quantitativ e (Numerical ) Nominal Discrete Continuous Ordinal 4
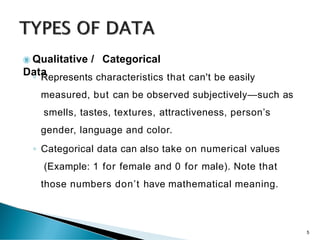
- 5. Qualitative / Categorical Data ◦ Represents characteristics that can't be easily measured, but can be observed subjectively—such as smells, tastes, textures, attractiveness, person’s gender, language and color. ◦ Categorical data can also take on numerical values (Example: 1 for female and 0 for male). Note that those numbers don’t have mathematical meaning. 5
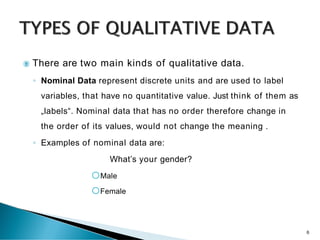
- 6. There are two main kinds of qualitative data. ◦ Nominal Data represent discrete units and are used to label variables, that have no quantitative value. Just think of them as „labels“. Nominal data that has no order therefore change in the order of its values, would not change the meaning . ◦ Examples of nominal data are: What’s your gender? oMale oFemale 6
- 7. Ordinal Data represent discrete and ordered units. It is therefore nearly the same as nominal data, except that it’s ordering matters. For Example: What is your educational background? o Matric oIntermediate oGraduate oMasters 7
- 8. Quantitative / Numerical data ◦ It is the data that is expressed with digits as opposed to letters or words. ◦ It deals with numbers and things you can measure objectively ◦ For example, the weight of a desk or the height of a building is numerical data. dimensions such as height, width, and length. ◦ Temperature and humidity. Prices. Area and volume are also examples. 8
- 9. Numerical data can be broken down into two different categories: Discrete data continuous data ◦ Discrete numerical data is data that has a finite ending or can be counted. By definition, it can only be certain values. For example, the number of pencils in a box represents discrete data. ◦ Continuous numerical data, on the other hand, represents values with infinite possibilities, such as the weight of an elephant. An elephant could weigh any number of pounds. Continuous data is placed within reasonable ranges to make it measurable 9
- 10. Data collection is the process of gathering and measuring information on variables of interest, in an established systematic fashion that enables one to answer stated research questions, test hypotheses, and evaluate outcomes. Data collection is a component of research in all fields of study including physical and social sciences, humanities, and business. 10
- 11. Data integrity issues ◦ The main reason for maintaining data integrity is to support the observation of errors in the data collection process. Those errors may be made Intentionally (deliberate falsification) or Non-intentionally (random or systematic errors). ◦ Two approaches invented by Craddick, Crawford, Rhodes, Redican, Rukenbrod and Laws in 2003: Quality assurance – all actions carried out before data collection Quality control – all actions carried out during and after data collection 11
- 12. How to Collect Data in 5 Steps ◦ Determine What Information You Want to Collect ◦ Set a Timeframe for Data Collection ◦ Determine Your Data Collection Method ◦ Collect the Data ◦ Analyze the Data and Implement Your Findings 12
- 13. 4 Uses of Data Collection ◦ Improving Your Understanding of Your Audience ◦ Identifying Areas for Improvement or Expansion ◦ Predicting Future Patterns ◦ Better Personalizing Your Content and Messaging 13
- 14. The following is a rough and general summary of some ethical principles that various codes address: ◦ Honesty ◦ Objectivity ◦ Integrity ◦ Carefulness ◦ Openness ◦ Respect for Intellectual Property ◦ Confidentiality ◦ Responsible Publication ◦ Responsible Mentoring ◦ Respect for Colleagues ◦ Social Responsibility ◦ Non-Discrimination ◦ Competence ◦ Legality 14
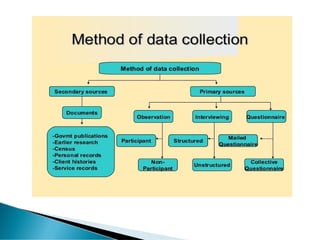
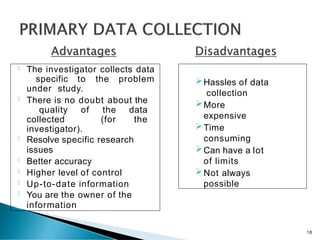
- 16. Data Collection: Depending on the source, it can classify as primary data or secondary data. Primary Data: These are the ‘pure’ data that are collected for the first time by an investigator for a specific purpose. Secondary Data: They are the ‘impure’ data that are sourced from someplace that has originally collected it. This information is impure as statistical operations may have been performed on them already. 16
- 17. Questionnaires Interviews Focus Group Interviews Observation Survey Case-studies Diaries Activity Sampling Technique Memo Motion Study Process Analysis Link Analysis Time and Motion Study Experimental Method Statistical Method etc. Experiments 17
- 18. The investigator collects data specific to the problem under study. There is no doubt about the quality of the data collected (for the investigator). Resolve specific research issues Better accuracy Higher level of control Up-to-date information You are the owner of the information Hassles of data collection More expensive Time consuming Can have a lot of limits Not always possible 18
- 19. Published Printed Sources Books Magazines/Newspapers Published Electronic Sources e-journals General Websites Weblogs Unpublished Personal Records Diaries Letters Government Records Census Data/population statistics Public Sector Records Records Biographies Newspapers Data archives Internet articles Research articles by other researchers (journals) etc. 19
- 20. No hassles of data collection. It is less expensive. The investigator is not personally responsible for the quality of data. Ease of Access Time-saving Generating new insights and understandings from previous analysis Larger sample size Longitudinal analysis Anyone can collect the data The data collected by the third party may not be a reliable party so the reliability and accuracy of data go down. Data collected in one location may not be suitable for the other one due variable environmental factor. With the passage of time data becomes obsolete and very old. It can also raise issues of authenticity and copyright. Not specific to your needs Lack of control over data quality Biasness Not proprietary Information Disadvantages Advantages 20
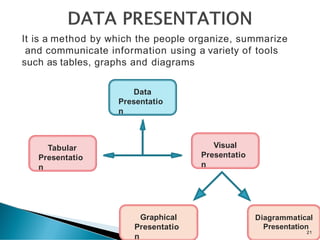
- 21. Data Presentatio n Tabular Presentatio n Graphical Presentatio n Visual Presentatio n Diagrammatical Presentation It is a method by which the people organize, summarize and communicate information using a variety of tools such as tables, graphs and diagrams 21
- 22. Uses of Data Presentation Easy and better understanding of the subject Provides first hand information about data Helpful in future analysis Easy for making comparisons Very attractive Principles of Data presentation Data should be presented in simple form Arose interest in reader Should be concise but without losing important details Facilitate further statistical analysis Define problem and Should suggest its solution 22
- 23. Tabulation is a systematic and logical arrangement of classified data in rows and columns Tables are a useful way to organize information using rows and columns. 23 Tabular Presentation
- 24. Tables are a versatile organization tool and can be used to communicate information on their own, or they can be used to accompany another data representation type (like a graph). A table helps representation of even large amount of data in an engaging, easy to read and coordinated manner. This is one of the most popularly used forms of data presentation i.e. simple to prepare and read 24
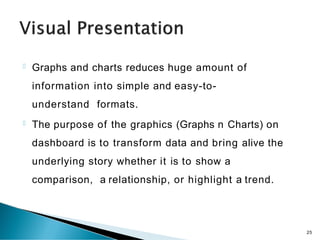
- 25. Graphs and charts reduces huge amount of information into simple and easy-to- understand formats. The purpose of the graphics (Graphs n Charts) on dashboard is to transform data and bring alive the underlying story whether it is to show a comparison, a relationship, or highlight a trend. 25
- 26. Charts and graphs ◦ Bar chart: comparisons, categories of data ◦ Histogram: represents relative frequency of continuous data ◦ Line graph: display trends over time, continuous data (ex. cases per month) ◦ Pie chart: show percentages or proportional share 26
- 27. Bar charts are ideal for information comparison and uses either horizontal or vertical bars (column chart) to show numerical comparison. The bars represent different categories of data. The length of each bar represents its value. Use — To compare data across categories. 10 0 80 60 40 20 27
- 28. Line charts reveal trends or progress over a period of time. It is a good way to visualize continuous data set or a sequence of values. Best suited for trend based data and analyzing the rate of change over a period of time. Values are plotted on line chart and the data points are connected to show a trend. Multiple trends can be highlighted and compared by plotting lines of different colours. Use — To compare data across categories. 28
- 29. Pie charts are used to show a data composition, typically for representing numbers as proportions or percentages of information — A part to whole. The sum total of all proportions being 100%. Use — To Show proportions/percentage 59% 10% 23% 8% 1st Qtr 2nd Qtr 3rd Qtr 4th Qtr 29
- 30. Scatter plots are mostly used in correlation and distribution analysis. This is a type of graph that helps to determine if relationship between two variables exists or not. An effective visual tool to show trends, concentrations and outliers in distribution of data. Use — To investigate the relationship between different variables. 30
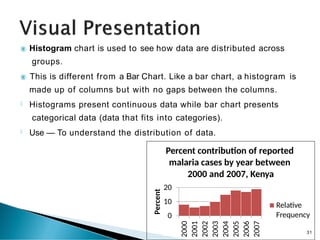
- 31. Histogram chart is used to see how data are distributed across groups. This is different from a Bar Chart. Like a bar chart, a histogram is 20 10 0 2000 2001 2002 2003 2004 2005 2006 2007 Percent made up of columns but with no gaps between the columns. Histograms present continuous data while bar chart presents categorical data (data that fits into categories). Use — To understand the distribution of data. Percent contribution of reported malaria cases by year between 2000 and 2007, Kenya Relative Frequency 31
- 32. Kuzma, J. W., & Bohnenblust, S. E. (1992). Basic statistics for the health sciences (pp. 199- 212). Mountain View, CA: Mayfield https://blog.minitab.com/blog/understanding-statistics https://towardsdatascience.com/data-types-in-statistics https://www.toppr.com/guides/maths/statistics/data https://www.mymarketresearchmethods.com https://ori.hhs.gov/education/products/n_illinois_u/dataman agement/dctopic.html https://www.toppr.com/guides/maths/statistics/data https:// www.lotame.com/what-are-the-methods-of-data- collection https:// www.researchgate.net/publication/325846997_METH ODS_OF_DATA_COLLECTION https://medium.com/datacrat/data-presentation-types- cffc4334dfb6 32
- 33. 33