SlideShare a Scribd company logo
What is Statistics?
Chapter 1
Copyright ©2021 McGraw-Hill Education. All rights reserved. No reproduction or
distribution without the prior written consent of McGraw-Hill Education.
1-1
Learning Objectives
Copyright ©2021 McGraw-Hill Education. All rights reserved. No reproduction or distribution
without the prior written consent of McGraw-Hill Education.
LO1-1Explain why knowledge of statistics is important
LO1-2Define statistics and provide an example of how
statistics is applied
LO1-3Differentiate between descriptive and inferential
statistics
LO1-4Classify variables as qualitative or quantitative, and
discrete or continuous
LO1-5Distinguish between nominal, ordinal, interval, and
ratio levels of measurement
LO1-6List the values associated with the practice of
statistics
1-2
Why Study Statistics
Copyright ©2021 McGraw-Hill Education. All rights reserved. No reproduction or
distribution without the prior written consent of McGraw-Hill Education.
� Data are collected everywhere
and require statistical
knowledge to make the
information useful
� Statistics is used to make valid
comparisons and to predict the
outcomes of decisions
� Statistical knowledge is useful in
any career
1-3
What is Meant by Statistics
Copyright ©2021 McGraw-Hill Education. All rights reserved. No reproduction or
distribution without the prior written consent of McGraw-Hill Education.
� What is statistics?
� It’s more than presenting numerical facts
Example: The inflation rate for the calendar year was 0.7%. By
applying statistics we could compare this year’s inflation rate to
past observations of inflation. Is it higher, lower, or about the
same? Is there a trend of increasing or decreasing inflation? Is
there a relationship between interest rates and government
bonds?
1-4
STATISTICS The science of collecting, organizing, presenting, analyzing,
and interpreting data to assist in making more effective decisions.
Types of Statistics
Copyright ©2021 McGraw-Hill Education. All rights reserved. No reproduction or
distribution without the prior written consent of McGraw-Hill Education.
� There are two types of statistics, descriptive and inferential
� Descriptive statistics can be used to organize data into a
meaningful form
� You can summarize data and provide information that is easy
to understand
� Example: There are a total of 46,837 miles of interstate
highways in the U.S. The interstate system represents 1% of
the nation’s roads, but carries more than 20% of the traffic.
Texas has the most interstate highways and Alaska doesn’t
have any.
1-5
DESCRIPTIVE STATISTICS Methods of organizing, summarizing, and
presenting data in an informative way.
Types of Statistics (2 of 3)
Copyright ©2021 McGraw-Hill Education. All rights reserved. No reproduction or
distribution without the prior written consent of McGraw-Hill Education.
� Inferential statistics can be used to estimate properties of a
population
� You can make decisions based on a limited set of data
� Example: In 2015, a sample of U.S. Internal Revenue Service
tax preparation volunteers were tested with three standard
tax returns. The sample indicated that tax returns were
completed with a 49% accuracy rate. In other words, there
were errors on about half of the returns.
1-6
INFERENTIAL STATISTICS The methods used to estimate a property
of a population on the basis of a sample.
Types of Statistics (3 of 3)
Copyright ©2021 McGraw-Hill Education. All rights reserved. No reproduction or
distribution without the prior written consent of McGraw-Hill Education.
1-7
POPULATION The entire set of individuals or objects of interest or
the measurements obtained from all individuals or objects of interest.
SAMPLE A portion or part of the population of interest.
Types of Variables
Copyright ©2021 McGraw-Hill Education. All rights reserved. No reproduction or
distribution without the prior written consent of McGraw-Hill Education.
� There are two basic types of variables
1-8
QUALITATIVE VARIABLE An object or individual is observed and
recorded as a non-numeric characteristic or attribute.
Examples: gender, state of birth, eye color
QUANTITATIVE VARIABLE A variable that is reported numerically.
Examples: balance in your checking account, the life of a car battery,
the number of people employed by a company
Types of Variables (2 of 2)
Copyright ©2021 McGraw-Hill Education. All rights reserved. No reproduction or
distribution without the prior written consent of McGraw-Hill Education.
� Quantitative variables can be discrete or continuous
� Discrete variables are typically the result of counting
� Values have “gaps” between the values
� Examples: the number of bedrooms in a house (1, 2, 3,
4, etc.), the number of students in a statistics course
(326, 421, etc.)
� Continuous variables are usually the result of measuring
something
� Can assume any value within a specific range
� Examples: Duration of flights from Orlando to San
Diego (5.25 hours), grade point average (3.258)
1-9
Types of Variables Summary
Copyright ©2021 McGraw-Hill Education. All rights reserved. No reproduction or
distribution without the prior written consent of McGraw-Hill Education.
1-10
Levels of Measurement
Copyright ©2021 McGraw-Hill Education. All rights reserved. No reproduction or
distribution without the prior written consent of McGraw-Hill Education.
� There are four levels of measurement
� Nominal, ordinal, interval, and ratio
� The level of measurement determines the type of
statistical analysis that can be performed
� Nominal is the lowest level of measurement
� Examples: classifying M&M candies by color, identifying
students at a football game by gender
1-11
NOMINAL LEVEL OF MEASUREMENT Data recorded at the nominal
level of measurement is represented as labels or names. They have no
order. They can only be classified and counted.
Levels of Measurement (2 of 4)
Copyright ©2021 McGraw-Hill Education. All rights reserved. No reproduction or
distribution without the prior written consent of McGraw-Hill Education.
� The next level of measurement is the ordinal level
� The rankings are known but not the magnitude of
differences between groups
� Examples: the list of top ten states for best business
climate, student ratings of professors
1-12
ORDINAL LEVEL OF MEASUREMENT Data recorded at the ordinal
level of measurement is based on a relative ranking or rating of items
based on a defined attribute or qualitative variable. Variables based on
this level of measurement are only ranked and counted.
Levels of Measurement (3 of 4)
Copyright ©2021 McGraw-Hill Education. All rights reserved. No reproduction or
distribution without the prior written consent of McGraw-Hill Education.
� The next level of measurement is the interval level
� This data has all the characteristics of ordinal level data,
plus the differences between the values are meaningful
� There is no natural 0 point
� Examples: the Fahrenheit temperature scale, dress sizes
1-13
INTERVAL LEVEL OF MEASUREMENT For data recorded at the
interval level of measurement, the interval or the distance between
values is meaningful. The interval level of measurement is based on a
scale with a known unit of measurement.
Levels of Measurement (4 of 4)
Copyright ©2021 McGraw-Hill Education. All rights reserved. No reproduction or
distribution without the prior written consent of McGraw-Hill Education.
� The highest level of measurement is the ratio level
� The data has all the characteristics of the interval scale
and ratios between numbers are meaningful
� The 0 point represents the absence of the characteristic
� Examples: wages, changes in stock prices, and height
1-14
RATIO LEVEL OF MEASUREMENT Data recorded at the ratio level of
measurement are based on a scale with a known unit of measurement
and a meaningful interpretation of zero on the scale.
Levels of Measurement Summary
Copyright ©2021 McGraw-Hill Education. All rights reserved. No reproduction or
distribution without the prior written consent of McGraw-Hill Education.
1-15
Ethics and Statistics
Copyright ©2021 McGraw-Hill Education. All rights reserved. No reproduction or
distribution without the prior written consent of McGraw-Hill Education.
� Practice statistics with integrity and honesty when
collecting, organizing, summarizing, analyzing, and
interpreting numerical information
� Maintain an independent and principled point of view
when analyzing and reporting findings and results
� Question reports that are based on data that
� does not fairly represent the population
� does not include all relevant statistics
� introduces bias in an attempt to mislead or
misrepresent
1-16
Basic Business Analytics
Copyright ©2021 McGraw-Hill Education. All rights reserved. No reproduction or
distribution without the prior written consent of McGraw-Hill Education.
� Business Analytics is used to process and analyze data
and information to support a story or narrative of a
company
� Using computer software to summarize, organize,
analyze, and present the findings of statistical analysis is
essential
1-17
Chapter 1 Practice Problems
Copyright ©2021 McGraw-Hill Education. All rights reserved. No reproduction
or distribution without the prior written consent of McGraw-Hill Education.
1-18
Question 1
Copyright ©2021 McGraw-Hill Education. All rights reserved. No reproduction or
distribution without the prior written consent of McGraw-Hill Education.
1-19
What is the level of measurement for each of the following
variables?
a. Student IQ ratings
b. Distance students travel to class
c. The jersey numbers of a sorority soccer team
d. A student’s state of birth
e. A student’s academic class – that is, freshman,
sophomore, junior, or senior
f. Number of hours students study per week
LO1-5
Question 13
1-20
For each of the following, determine whether the variable is
continuous or discrete, quantitative or qualitative, and level of
measurement
a. Salary
b. Gender
c. Sales volume of MP3 players
d. Soft drink preference
e. Temperature
f. SAT scores
g. Student rank in class
h. Rating of a finance professor
i. Number of home video screens
LO1-4,5
Copyright ©2021 McGraw-Hill Education. All rights reserved. No reproduction or
distribution without the prior written consent of McGraw-Hill Education.

More Related Content

What's hot (16)

PPTX
Consumer Demand
Linda Familusi
 
PPT
microeconomics - princ-ch11-presentation.ppt
PhamThanhVinh1
 
PDF
Risk-Aversion, Risk-Premium and Utility Theory
Ashwin Rao
 
PPTX
Premium Ch 2 Thinking Like an Economist (1).pptx
KEHKASHANNIZAM
 
PPTX
Interactive Ch 16 The Monetary System 9e(1).pptx
MayaAwar1
 
PPTX
Chapter 11 Public Goods and Common Resources.pptx
ssuserbfbda9
 
PPT
The Monetary System
Chris Thomas
 
PPT
The Design of the Tax System
Chris Thomas
 
PPT
001 nickels sppt chap001 taking risks and making profits within the dynamic b...
Prahasta Rhino
 
PPTX
Premium_Ch_15_Monopoly.pptx
NguynChi56
 
PPTX
Premium Ch 5 Elasticity and Its Application.pptx
cadeyare1201
 
PPT
Game theory
Hoang Nguyen
 
PPTX
Basic Economic Questions
Kevin A
 
PPT
Micro_ch21_presentation.ppt
nisaandini13
 
PPTX
Chapter 26 Saving, Investment, and the Financial System.pptx
anisadiandraoktavian
 
PPT
interdependence and the gains from trade
itmamul akwan
 
Consumer Demand
Linda Familusi
 
microeconomics - princ-ch11-presentation.ppt
PhamThanhVinh1
 
Risk-Aversion, Risk-Premium and Utility Theory
Ashwin Rao
 
Premium Ch 2 Thinking Like an Economist (1).pptx
KEHKASHANNIZAM
 
Interactive Ch 16 The Monetary System 9e(1).pptx
MayaAwar1
 
Chapter 11 Public Goods and Common Resources.pptx
ssuserbfbda9
 
The Monetary System
Chris Thomas
 
The Design of the Tax System
Chris Thomas
 
001 nickels sppt chap001 taking risks and making profits within the dynamic b...
Prahasta Rhino
 
Premium_Ch_15_Monopoly.pptx
NguynChi56
 
Premium Ch 5 Elasticity and Its Application.pptx
cadeyare1201
 
Game theory
Hoang Nguyen
 
Basic Economic Questions
Kevin A
 
Micro_ch21_presentation.ppt
nisaandini13
 
Chapter 26 Saving, Investment, and the Financial System.pptx
anisadiandraoktavian
 
interdependence and the gains from trade
itmamul akwan
 

Similar to What is statistics (chapter - 1) PPT.pptx (20)

PPTX
Lind_2024_Release_Chap001_PPT_Accessible.pptx
TimNurja
 
PPTX
Chapter 1 of the book Basic Statistics as described by teacher
karamjit18
 
PPT
Chap1 BStat SemA201 Intro.ppt
najwalyaa
 
PPT
MTH120_Chapter1
Sida Say
 
PPT
what is statistics? Mc Graw Hills/Irwin
Maryam Xahra
 
PPT
Chap001.ppt
ManoloTaquire
 
PPT
What is statistics chapter one class .ppt
XniaBelletNavarro
 
PPT
7jjjjjjjjjjjjjvcxzffghjknbvfhjknbvcduukkk
yeasmin75648
 
PPT
Bab 1.ppt
akhmadakbarsusamto1
 
PDF
SPSS
Abir Hossain
 
PDF
Day1, session i- spss
abir hossain
 
PPTX
Chapter 01 mis
Rong Mohol
 
PDF
Pengertian Statistik.pdf
MuriaZanah
 
PPT
chapter_01_12 Accounting principles 1.ppt
Saleh Abdelraouf Hussien
 
PPT
chapter_01_12.ppt
SaleemBhatti5
 
PPT
Emba502 day 2
Nahid Amin
 
PDF
Statistics: Chapter One
Saed Jama
 
PPTX
Introduction to statistics
ScholarsPoint1
 
PDF
Biostatistics ppt.pdf
AbdulrezakHusein
 
PPTX
Biostatistics ppt.pptx
GammachuuTarrafaa
 
Lind_2024_Release_Chap001_PPT_Accessible.pptx
TimNurja
 
Chapter 1 of the book Basic Statistics as described by teacher
karamjit18
 
Chap1 BStat SemA201 Intro.ppt
najwalyaa
 
MTH120_Chapter1
Sida Say
 
what is statistics? Mc Graw Hills/Irwin
Maryam Xahra
 
Chap001.ppt
ManoloTaquire
 
What is statistics chapter one class .ppt
XniaBelletNavarro
 
7jjjjjjjjjjjjjvcxzffghjknbvfhjknbvcduukkk
yeasmin75648
 
Day1, session i- spss
abir hossain
 
Chapter 01 mis
Rong Mohol
 
Pengertian Statistik.pdf
MuriaZanah
 
chapter_01_12 Accounting principles 1.ppt
Saleh Abdelraouf Hussien
 
chapter_01_12.ppt
SaleemBhatti5
 
Emba502 day 2
Nahid Amin
 
Statistics: Chapter One
Saed Jama
 
Introduction to statistics
ScholarsPoint1
 
Biostatistics ppt.pdf
AbdulrezakHusein
 
Biostatistics ppt.pptx
GammachuuTarrafaa
 
Ad

Recently uploaded (20)

PPTX
Nutrition Quiz bee for elementary 2025 1.pptx
RichellMarianoPugal
 
PPTX
Unlock the Power of Cursor AI: MuleSoft Integrations
Veera Pallapu
 
PDF
FULL DOCUMENT: Read the full Deloitte and Touche audit report on the National...
Kweku Zurek
 
PPTX
Introduction to pediatric nursing in 5th Sem..pptx
AneetaSharma15
 
PDF
Right to Information.pdf by Sapna Maurya XI D
Directorate of Education Delhi
 
PPTX
HERNIA: INGUINAL HERNIA, UMBLICAL HERNIA.pptx
PRADEEP ABOTHU
 
PPTX
Digital Professionalism and Interpersonal Competence
rutvikgediya1
 
PPTX
Cybersecurity: How to Protect your Digital World from Hackers
vaidikpanda4
 
PDF
water conservation .pdf by Nandni Kumari XI C
Directorate of Education Delhi
 
PPTX
HEALTH CARE DELIVERY SYSTEM - UNIT 2 - GNM 3RD YEAR.pptx
Priyanshu Anand
 
PPTX
YSPH VMOC Special Report - Measles Outbreak Southwest US 7-20-2025.pptx
Yale School of Public Health - The Virtual Medical Operations Center (VMOC)
 
PPTX
Various Psychological tests: challenges and contemporary trends in psychologi...
santoshmohalik1
 
PPTX
FAMILY HEALTH NURSING CARE - UNIT 5 - CHN 1 - GNM 1ST YEAR.pptx
Priyanshu Anand
 
PPTX
How to Manage Resupply Subcontracting in Odoo 18
Celine George
 
PPTX
MALABSORPTION SYNDROME: NURSING MANAGEMENT.pptx
PRADEEP ABOTHU
 
PPTX
THE HUMAN INTEGUMENTARY SYSTEM#MLT#BCRAPC.pptx
Subham Panja
 
PPT
DRUGS USED IN THERAPY OF SHOCK, Shock Therapy, Treatment or management of shock
Rajshri Ghogare
 
PPTX
IDEAS AND EARLY STATES Social science pptx
NIRANJANASSURESH
 
PPTX
I INCLUDED THIS TOPIC IS INTELLIGENCE DEFINITION, MEANING, INDIVIDUAL DIFFERE...
parmarjuli1412
 
PPTX
Electrophysiology_of_Heart. Electrophysiology studies in Cardiovascular syste...
Rajshri Ghogare
 
Nutrition Quiz bee for elementary 2025 1.pptx
RichellMarianoPugal
 
Unlock the Power of Cursor AI: MuleSoft Integrations
Veera Pallapu
 
FULL DOCUMENT: Read the full Deloitte and Touche audit report on the National...
Kweku Zurek
 
Introduction to pediatric nursing in 5th Sem..pptx
AneetaSharma15
 
Right to Information.pdf by Sapna Maurya XI D
Directorate of Education Delhi
 
HERNIA: INGUINAL HERNIA, UMBLICAL HERNIA.pptx
PRADEEP ABOTHU
 
Digital Professionalism and Interpersonal Competence
rutvikgediya1
 
Cybersecurity: How to Protect your Digital World from Hackers
vaidikpanda4
 
water conservation .pdf by Nandni Kumari XI C
Directorate of Education Delhi
 
HEALTH CARE DELIVERY SYSTEM - UNIT 2 - GNM 3RD YEAR.pptx
Priyanshu Anand
 
YSPH VMOC Special Report - Measles Outbreak Southwest US 7-20-2025.pptx
Yale School of Public Health - The Virtual Medical Operations Center (VMOC)
 
Various Psychological tests: challenges and contemporary trends in psychologi...
santoshmohalik1
 
FAMILY HEALTH NURSING CARE - UNIT 5 - CHN 1 - GNM 1ST YEAR.pptx
Priyanshu Anand
 
How to Manage Resupply Subcontracting in Odoo 18
Celine George
 
MALABSORPTION SYNDROME: NURSING MANAGEMENT.pptx
PRADEEP ABOTHU
 
THE HUMAN INTEGUMENTARY SYSTEM#MLT#BCRAPC.pptx
Subham Panja
 
DRUGS USED IN THERAPY OF SHOCK, Shock Therapy, Treatment or management of shock
Rajshri Ghogare
 
IDEAS AND EARLY STATES Social science pptx
NIRANJANASSURESH
 
I INCLUDED THIS TOPIC IS INTELLIGENCE DEFINITION, MEANING, INDIVIDUAL DIFFERE...
parmarjuli1412
 
Electrophysiology_of_Heart. Electrophysiology studies in Cardiovascular syste...
Rajshri Ghogare
 
Ad

What is statistics (chapter - 1) PPT.pptx

  • 1. What is Statistics? Chapter 1 Copyright ©2021 McGraw-Hill Education. All rights reserved. No reproduction or distribution without the prior written consent of McGraw-Hill Education. 1-1
  • 2. Learning Objectives Copyright ©2021 McGraw-Hill Education. All rights reserved. No reproduction or distribution without the prior written consent of McGraw-Hill Education. LO1-1Explain why knowledge of statistics is important LO1-2Define statistics and provide an example of how statistics is applied LO1-3Differentiate between descriptive and inferential statistics LO1-4Classify variables as qualitative or quantitative, and discrete or continuous LO1-5Distinguish between nominal, ordinal, interval, and ratio levels of measurement LO1-6List the values associated with the practice of statistics 1-2
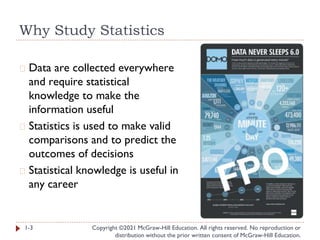
  • 3. Why Study Statistics Copyright ©2021 McGraw-Hill Education. All rights reserved. No reproduction or distribution without the prior written consent of McGraw-Hill Education. � Data are collected everywhere and require statistical knowledge to make the information useful � Statistics is used to make valid comparisons and to predict the outcomes of decisions � Statistical knowledge is useful in any career 1-3
  • 4. What is Meant by Statistics Copyright ©2021 McGraw-Hill Education. All rights reserved. No reproduction or distribution without the prior written consent of McGraw-Hill Education. � What is statistics? � It’s more than presenting numerical facts Example: The inflation rate for the calendar year was 0.7%. By applying statistics we could compare this year’s inflation rate to past observations of inflation. Is it higher, lower, or about the same? Is there a trend of increasing or decreasing inflation? Is there a relationship between interest rates and government bonds? 1-4 STATISTICS The science of collecting, organizing, presenting, analyzing, and interpreting data to assist in making more effective decisions.
  • 5. Types of Statistics Copyright ©2021 McGraw-Hill Education. All rights reserved. No reproduction or distribution without the prior written consent of McGraw-Hill Education. � There are two types of statistics, descriptive and inferential � Descriptive statistics can be used to organize data into a meaningful form � You can summarize data and provide information that is easy to understand � Example: There are a total of 46,837 miles of interstate highways in the U.S. The interstate system represents 1% of the nation’s roads, but carries more than 20% of the traffic. Texas has the most interstate highways and Alaska doesn’t have any. 1-5 DESCRIPTIVE STATISTICS Methods of organizing, summarizing, and presenting data in an informative way.
  • 6. Types of Statistics (2 of 3) Copyright ©2021 McGraw-Hill Education. All rights reserved. No reproduction or distribution without the prior written consent of McGraw-Hill Education. � Inferential statistics can be used to estimate properties of a population � You can make decisions based on a limited set of data � Example: In 2015, a sample of U.S. Internal Revenue Service tax preparation volunteers were tested with three standard tax returns. The sample indicated that tax returns were completed with a 49% accuracy rate. In other words, there were errors on about half of the returns. 1-6 INFERENTIAL STATISTICS The methods used to estimate a property of a population on the basis of a sample.
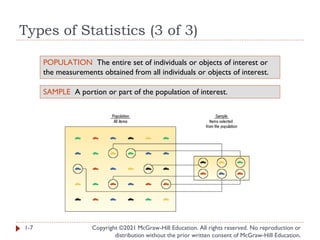
  • 7. Types of Statistics (3 of 3) Copyright ©2021 McGraw-Hill Education. All rights reserved. No reproduction or distribution without the prior written consent of McGraw-Hill Education. 1-7 POPULATION The entire set of individuals or objects of interest or the measurements obtained from all individuals or objects of interest. SAMPLE A portion or part of the population of interest.
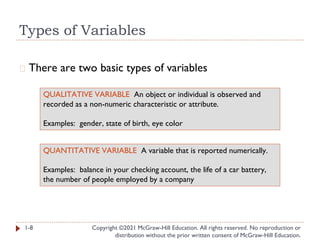
  • 8. Types of Variables Copyright ©2021 McGraw-Hill Education. All rights reserved. No reproduction or distribution without the prior written consent of McGraw-Hill Education. � There are two basic types of variables 1-8 QUALITATIVE VARIABLE An object or individual is observed and recorded as a non-numeric characteristic or attribute. Examples: gender, state of birth, eye color QUANTITATIVE VARIABLE A variable that is reported numerically. Examples: balance in your checking account, the life of a car battery, the number of people employed by a company
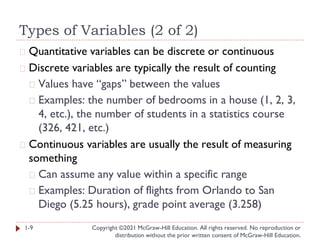
  • 9. Types of Variables (2 of 2) Copyright ©2021 McGraw-Hill Education. All rights reserved. No reproduction or distribution without the prior written consent of McGraw-Hill Education. � Quantitative variables can be discrete or continuous � Discrete variables are typically the result of counting � Values have “gaps” between the values � Examples: the number of bedrooms in a house (1, 2, 3, 4, etc.), the number of students in a statistics course (326, 421, etc.) � Continuous variables are usually the result of measuring something � Can assume any value within a specific range � Examples: Duration of flights from Orlando to San Diego (5.25 hours), grade point average (3.258) 1-9
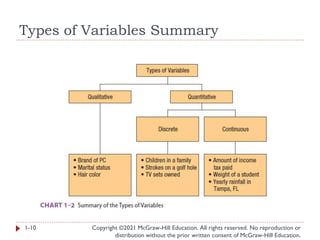
  • 10. Types of Variables Summary Copyright ©2021 McGraw-Hill Education. All rights reserved. No reproduction or distribution without the prior written consent of McGraw-Hill Education. 1-10
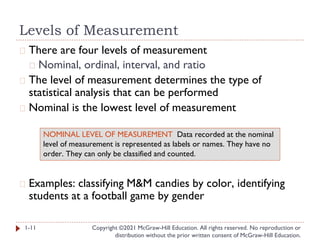
  • 11. Levels of Measurement Copyright ©2021 McGraw-Hill Education. All rights reserved. No reproduction or distribution without the prior written consent of McGraw-Hill Education. � There are four levels of measurement � Nominal, ordinal, interval, and ratio � The level of measurement determines the type of statistical analysis that can be performed � Nominal is the lowest level of measurement � Examples: classifying M&M candies by color, identifying students at a football game by gender 1-11 NOMINAL LEVEL OF MEASUREMENT Data recorded at the nominal level of measurement is represented as labels or names. They have no order. They can only be classified and counted.
  • 12. Levels of Measurement (2 of 4) Copyright ©2021 McGraw-Hill Education. All rights reserved. No reproduction or distribution without the prior written consent of McGraw-Hill Education. � The next level of measurement is the ordinal level � The rankings are known but not the magnitude of differences between groups � Examples: the list of top ten states for best business climate, student ratings of professors 1-12 ORDINAL LEVEL OF MEASUREMENT Data recorded at the ordinal level of measurement is based on a relative ranking or rating of items based on a defined attribute or qualitative variable. Variables based on this level of measurement are only ranked and counted.
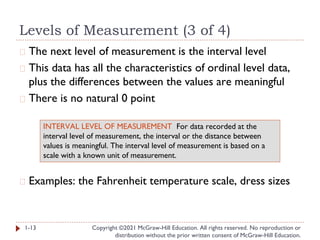
  • 13. Levels of Measurement (3 of 4) Copyright ©2021 McGraw-Hill Education. All rights reserved. No reproduction or distribution without the prior written consent of McGraw-Hill Education. � The next level of measurement is the interval level � This data has all the characteristics of ordinal level data, plus the differences between the values are meaningful � There is no natural 0 point � Examples: the Fahrenheit temperature scale, dress sizes 1-13 INTERVAL LEVEL OF MEASUREMENT For data recorded at the interval level of measurement, the interval or the distance between values is meaningful. The interval level of measurement is based on a scale with a known unit of measurement.
  • 14. Levels of Measurement (4 of 4) Copyright ©2021 McGraw-Hill Education. All rights reserved. No reproduction or distribution without the prior written consent of McGraw-Hill Education. � The highest level of measurement is the ratio level � The data has all the characteristics of the interval scale and ratios between numbers are meaningful � The 0 point represents the absence of the characteristic � Examples: wages, changes in stock prices, and height 1-14 RATIO LEVEL OF MEASUREMENT Data recorded at the ratio level of measurement are based on a scale with a known unit of measurement and a meaningful interpretation of zero on the scale.
  • 15. Levels of Measurement Summary Copyright ©2021 McGraw-Hill Education. All rights reserved. No reproduction or distribution without the prior written consent of McGraw-Hill Education. 1-15
  • 16. Ethics and Statistics Copyright ©2021 McGraw-Hill Education. All rights reserved. No reproduction or distribution without the prior written consent of McGraw-Hill Education. � Practice statistics with integrity and honesty when collecting, organizing, summarizing, analyzing, and interpreting numerical information � Maintain an independent and principled point of view when analyzing and reporting findings and results � Question reports that are based on data that � does not fairly represent the population � does not include all relevant statistics � introduces bias in an attempt to mislead or misrepresent 1-16
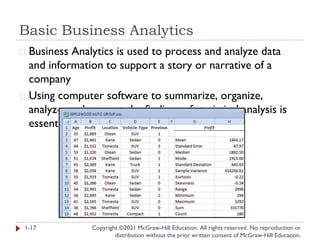
  • 17. Basic Business Analytics Copyright ©2021 McGraw-Hill Education. All rights reserved. No reproduction or distribution without the prior written consent of McGraw-Hill Education. � Business Analytics is used to process and analyze data and information to support a story or narrative of a company � Using computer software to summarize, organize, analyze, and present the findings of statistical analysis is essential 1-17
  • 18. Chapter 1 Practice Problems Copyright ©2021 McGraw-Hill Education. All rights reserved. No reproduction or distribution without the prior written consent of McGraw-Hill Education. 1-18
  • 19. Question 1 Copyright ©2021 McGraw-Hill Education. All rights reserved. No reproduction or distribution without the prior written consent of McGraw-Hill Education. 1-19 What is the level of measurement for each of the following variables? a. Student IQ ratings b. Distance students travel to class c. The jersey numbers of a sorority soccer team d. A student’s state of birth e. A student’s academic class – that is, freshman, sophomore, junior, or senior f. Number of hours students study per week LO1-5
  • 20. Question 13 1-20 For each of the following, determine whether the variable is continuous or discrete, quantitative or qualitative, and level of measurement a. Salary b. Gender c. Sales volume of MP3 players d. Soft drink preference e. Temperature f. SAT scores g. Student rank in class h. Rating of a finance professor i. Number of home video screens LO1-4,5 Copyright ©2021 McGraw-Hill Education. All rights reserved. No reproduction or distribution without the prior written consent of McGraw-Hill Education.