060 techniques of_data_analysis
Download as ppt, pdf5 likes1,169 views

The document discusses various techniques for data analysis. It begins by explaining the concepts of data analysis and categories such as descriptive, statistical/mathematical. Common statistical methods are described including descriptive statistics which use sample data to explain population phenomena, and inferential statistics which use samples to infer population parameters and relationships. Examples of descriptive statistics like mean, median and quartiles are provided. The document concludes by emphasizing the importance of choosing the right technique for the research problem and avoiding common mistakes in data analysis.


More Related Content
What's hot (20)
Viewers also liked (20)


Similar to 060 techniques of_data_analysis (20)


Recently uploaded (20)


060 techniques of_data_analysis
- 1. Techniques of Data Analysis Assoc. Prof. Dr. Abdul Hamid b. Hj. Mar Iman Director Centre for Real Estate Studies Faculty of Engineering and Geoinformation Science Universiti Tekbnologi Malaysia Skudai, Johor
- 2. Objectives Overall: Reinforce your understanding from the main lecture Specific: * Concepts of data analysis * Some data analysis techniques * Some tips for data analysis What I will not do: * To teach every bit and pieces of statistical analysis techniques
- 3. Data analysis – “The Concept” Approach to de-synthesizing data, informational, and/or factual elements to answer research questions Method of putting together facts and figures to solve research problem Systematic process of utilizing data to address research questions Breaking down research issues through utilizing controlled data and factual information
- 4. Categories of data analysis Narrative (e.g. laws, arts) Descriptive (e.g. social sciences) Statistical/mathematical (pure/applied sciences) Audio-Optical (e.g. telecommunication) Others Most research analyses, arguably, adopt the first three. The second and third are, arguably, most popular in pure, applied, and social sciences
- 5. Statistical Methods Something to do with “statistics” Statistics: “meaningful” quantities about a sample of objects, things, persons, events, phenomena, etc. Widely used in social sciences. Simple to complex issues. E.g. * correlation * anova * manova * regression * econometric modelling Two main categories: * Descriptive statistics * Inferential statistics
- 6. Descriptive statistics Use sample information to explain/make abstraction of population “phenomena”. Common “phenomena”: * Association (e.g. σ 1,2.3 = 0.75) * Tendency (left-skew, right-skew) * Causal relationship (e.g. if X, then, Y) * Trend, pattern, dispersion, range Used in non-parametric analysis (e.g. chi-square, t-test, 2-way anova)
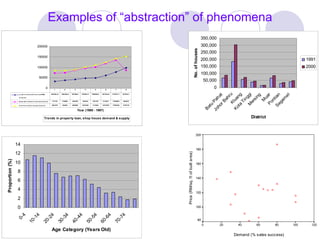
- 7. Examples of “abstraction” of phenomena
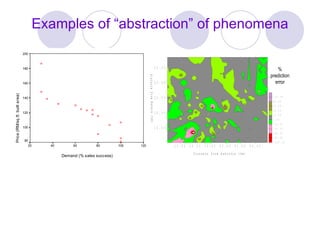
- 8. Examples of “abstraction” of phenomena % prediction error
- 9. Inferential statistics Using sample statistics to infer some “phenomena” of population parameters Common “phenomena”: cause-and-effect * One-way r/ship * Multi-directional r/ship * Recursive Use parametric analysis Y1 = f(Y2, X, e1) Y2 = f(Y1, Z, e2) Y1 = f(X, e1) Y2 = f(Y1, Z, e2) Y = f(X)
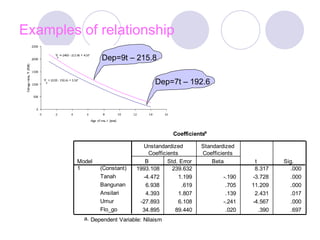
- 10. Examples of relationship Dep=9t – 215.8 Dep=7t – 192.6
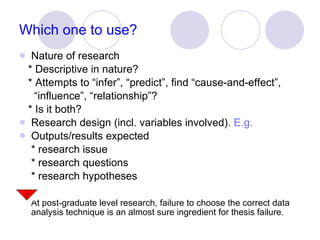
- 11. Which one to use? Nature of research * Descriptive in nature? * Attempts to “infer”, “predict”, find “cause-and-effect”, “ influence”, “relationship”? * Is it both? Research design (incl. variables involved). E.g. Outputs/results expected * research issue * research questions * research hypotheses At post-graduate level research, failure to choose the correct data analysis technique is an almost sure ingredient for thesis failure.
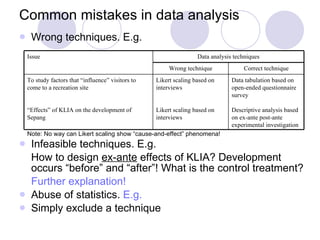
- 12. Common mistakes in data analysis Wrong techniques. E.g. Infeasible techniques. E.g. How to design ex-ante effects of KLIA? Development occurs “before” and “after”! What is the control treatment? Further explanation! Abuse of statistics. E.g. Simply exclude a technique Note: No way can Likert scaling show “cause-and-effect” phenomena! Data tabulation based on open-ended questionnaire survey Descriptive analysis based on ex-ante post-ante experimental investigation Likert scaling based on interviews Likert scaling based on interviews To study factors that “influence” visitors to come to a recreation site “ Effects” of KLIA on the development of Sepang Correct technique Wrong technique Data analysis techniques Issue
- 13. Common mistakes (contd.) – “Abuse of statistics” Many – a.o.t. Box-Cox 2 test for model equivalence Using R 2 To evaluate whether a model fits data better than the other Simple regression coefficient Multi-dimensional scaling, Likert scaling Finding the “relationship” between one variable with another Using a regression parameter Using partial c orrelation (e.g. Spearman coeff.) Measure the “influence” of a variable on another Many – a.o.t. two-way anova, 2 , Z test Multi-dimensional scaling, Likert scaling “ Compare” whether a group is different from another Hold-out sample’s MAPE Using R 2 and/or F-value of a model To evaluate accuracy of “prediction” Many – a.o.t. manova, regression Multi-dimensional scaling, Likert scaling To determine whether a group of factors “significantly influence” the observed phenomenon Correct technique Example of abuse Data analysis techniques Issue
- 14. How to avoid mistakes - Useful tips Crystalize the research problem -> operability of it! Read literature on data analysis techniques. Evaluate various techniques that can do similar things w.r.t. to research problem Know what a technique does and what it doesn’t Consult people, esp. supervisor Pilot-run the data and evaluate results Don’t do research??
- 15. Principles of analysis Goal of an analysis: * To explain cause-and-effect phenomena * To relate research with real-world event * To predict/forecast the real-world phenomena based on research * Finding answers to a particular problem * Making conclusions about real-world event based on the problem * Learning a lesson from the problem
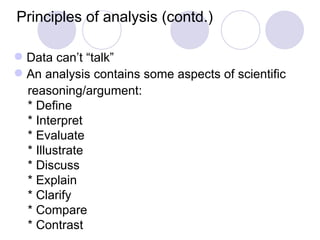
- 16. Principles of analysis (contd.) Data can’t “talk” An analysis contains some aspects of scientific reasoning/argument: * Define * Interpret * Evaluate * Illustrate * Discuss * Explain * Clarify * Compare * Contrast
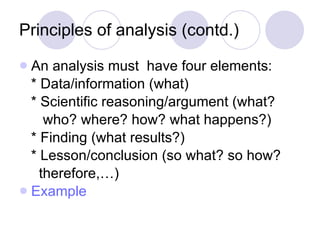
- 17. Principles of analysis (contd.) An analysis must have four elements: * Data/information (what) * Scientific reasoning/argument (what? who? where? how? what happens?) * Finding (what results?) * Lesson/conclusion (so what? so how? therefore,…) Example
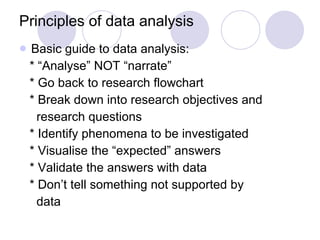
- 18. Principles of data analysis Basic guide to data analysis: * “Analyse” NOT “narrate” * Go back to research flowchart * Break down into research objectives and research questions * Identify phenomena to be investigated * Visualise the “expected” answers * Validate the answers with data * Don’t tell something not supported by data
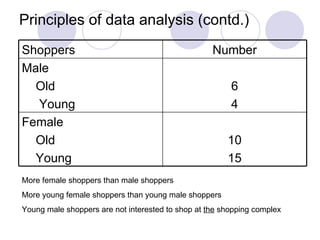
- 19. Principles of data analysis (contd.) More female shoppers than male shoppers More young female shoppers than young male shoppers Young male shoppers are not interested to shop at the shopping complex 10 15 Female Old Young 6 4 Male Old Young Number Shoppers
- 20. Data analysis (contd.) When analysing: * Be objective * Accurate * True Separate facts and opinion Avoid “wrong” reasoning/argument. E.g. mistakes in interpretation.
- 21. Introductory Statistics for Social Sciences Basic concepts Central tendency Variability Probability Statistical Modelling
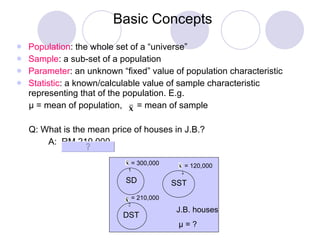
- 22. Basic Concepts Population : the whole set of a “universe” Sample : a sub-set of a population Parameter : an unknown “fixed” value of population characteristic Statistic : a known/calculable value of sample characteristic representing that of the population. E.g. μ = mean of population, = mean of sample Q: What is the mean price of houses in J.B.? A: RM 210,000 J.B. houses μ = ? SST DST SD 1 = 300,000 = 120,000 2 = 210,000 3
- 23. Basic Concepts (contd.) Randomness : Many things occur by pure chances…rainfall, disease, birth, death,.. Variability : Stochastic processes bring in them various different dimensions, characteristics, properties, features, etc., in the population Statistical analysis methods have been developed to deal with these very nature of real world.
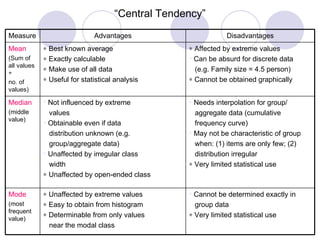
- 24. “ Central Tendency” Cannot be determined exactly in group data Very limited statistical use Unaffected by extreme values Easy to obtain from histogram Determinable from only values near the modal class Mode (most frequent value) Needs interpolation for group/ aggregate data (cumulative frequency curve) May not be characteristic of group when: (1) items are only few; (2) distribution irregular Very limited statistical use Not influenced by extreme values Obtainable even if data distribution unknown (e.g. group/aggregate data) Unaffected by irregular class width Unaffected by open-ended class Median (middle value) Affected by extreme values Can be absurd for discrete data (e.g. Family size = 4.5 person) Cannot be obtained graphically Best known average Exactly calculable Make use of all data Useful for statistical analysis Mean (Sum of all values ÷ no. of values) Disadvantages Advantages Measure
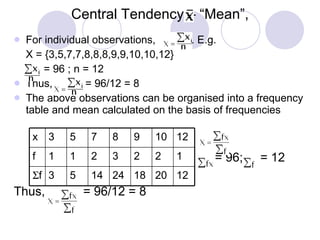
- 25. Central Tendency – “Mean”, For individual observations, . E.g. X = {3,5,7,7,8,8,8,9,9,10,10,12} = 96 ; n = 12 Thus, = 96/12 = 8 The above observations can be organised into a frequency table and mean calculated on the basis of frequencies = 96; = 12 Thus, = 96/12 = 8 12 20 18 24 14 5 3 f 1 2 2 3 2 1 1 f 12 10 9 8 7 5 3 x
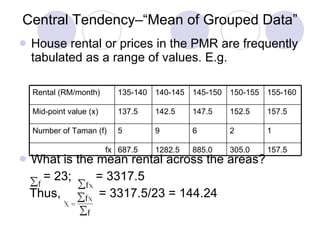
- 26. Central Tendency–“Mean of Grouped Data” House rental or prices in the PMR are frequently tabulated as a range of values. E.g. What is the mean rental across the areas? = 23; = 3317.5 Thus, = 3317.5/23 = 144.24 157.5 305.0 885.0 1282.5 687.5 fx 1 2 6 9 5 Number of Taman (f) 157.5 152.5 147.5 142.5 137.5 Mid-point value (x) 155-160 150-155 145-150 140-145 135-140 Rental (RM/month)
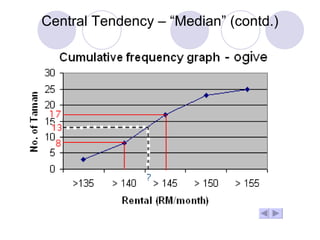
- 27. Central Tendency – “Median” Let say house rentals in a particular town are tabulated as follows: Calculation of “median” rental needs a graphical aids-> Median = (n+1)/2 = (25+1)/2 =13 th . Taman 2. (i.e. between 10 – 15 points on the vertical axis of ogive). 3. Corresponds to RM 140-145/month on the horizontal axis 4. There are (17-8) = 9 Taman in the range of RM 140-145/month 5. Taman 13 th . is 5 th . out of the 9 Taman 6. The interval width is 5 7. Therefore, the median rental can be calculated as: 140 + (5/9 x 5) = RM 142.8 25 23 17 8 3 Cumulative frequency > 155 > 150 > 145 > 140 >135 Rental (RM/month) 2 6 9 5 3 Number of Taman (f) 150-155 155-50 140-145 135-140 130-135 Rental (RM/month)
- 28. Central Tendency – “Median” (contd.)
- 29. Central Tendency – “Quartiles” (contd.) Upper quartile = ¾(n+1) = 19.5 th . Taman UQ = 145 + (3/7 x 5) = RM 147.1/month Lower quartile = (n+1)/4 = 26/4 = 6.5 th. Taman LQ = 135 + (3.5/5 x 5) = RM138.5/month Inter-quartile = UQ – LQ = 147.1 – 138.5 = 8.6 th . Taman IQ = 138.5 + (4/5 x 5) = RM 142.5/month
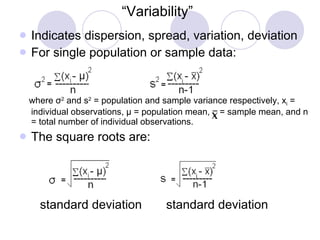
- 30. “ Variability” Indicates dispersion, spread, variation, deviation For single population or sample data: where σ 2 and s 2 = population and sample variance respectively, x i = individual observations, μ = population mean, = sample mean, and n = total number of individual observations. The square roots are: standard deviation standard deviation
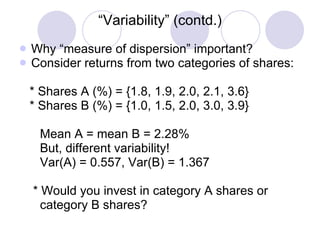
- 31. “ Variability” (contd.) Why “measure of dispersion” important? Consider returns from two categories of shares: * Shares A (%) = {1.8, 1.9, 2.0, 2.1, 3.6} * Shares B (%) = {1.0, 1.5, 2.0, 3.0, 3.9} Mean A = mean B = 2.28% But, different variability! Var(A) = 0.557, Var(B) = 1.367 * Would you invest in category A shares or category B shares?
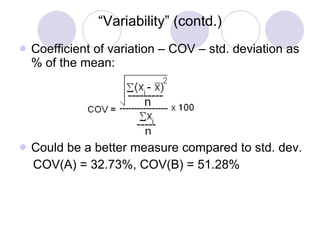
- 32. “ Variability” (contd.) Coefficient of variation – COV – std. deviation as % of the mean: Could be a better measure compared to std. dev. COV(A) = 32.73%, COV(B) = 51.28%
- 33. “ Variability” (contd.) Std. dev. of a frequency distribution The following table shows the age distribution of second-time home buyers: x^
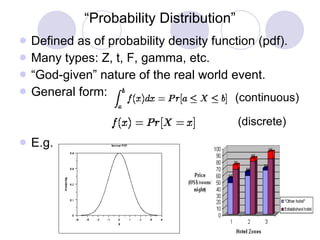
- 34. “ Probability Distribution” Defined as of probability density function (pdf). Many types: Z, t, F, gamma, etc. “ God-given” nature of the real world event. General form: E.g. (continuous) (discrete)
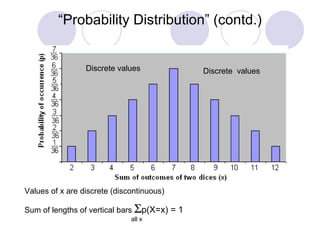
- 35. “ Probability Distribution” (contd.) 12 11 10 9 8 7 6 11 10 9 8 7 6 5 10 9 8 7 6 5 4 9 8 7 6 5 4 3 8 7 6 5 4 3 2 7 6 5 4 3 2 1 6 5 4 3 2 1 Dice1 Dice2
- 36. “ Probability Distribution” (contd.) Values of x are discrete (discontinuous) Sum of lengths of vertical bars p(X=x) = 1 all x Discrete values Discrete values
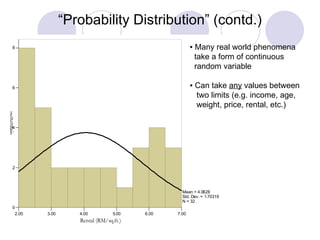
- 37. “ Probability Distribution” (contd.) ▪ Many real world phenomena take a form of continuous random variable ▪ Can take any values between two limits (e.g. income, age, weight, price, rental, etc.)
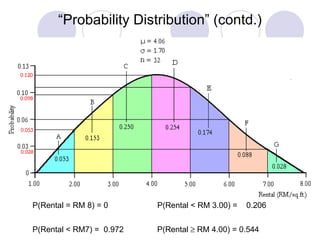
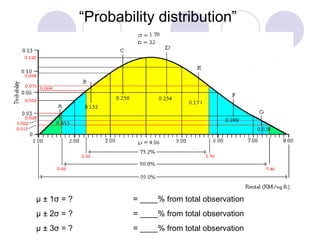
- 38. “ Probability Distribution” (contd.) P(Rental = RM 8) = 0 P(Rental < RM 3.00) = 0.206 P(Rental < RM7) = 0.972 P(Rental RM 4.00) = 0.544 P(Rental 7) = 0.028 P(Rental < RM 2.00) = 0.053
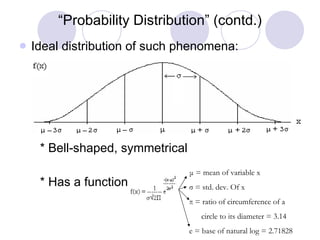
- 39. “ Probability Distribution” (contd.) Ideal distribution of such phenomena: * Bell-shaped, symmetrical * Has a function of μ = mean of variable x σ = std. dev. Of x π = ratio of circumference of a circle to its diameter = 3.14 e = base of natural log = 2.71828
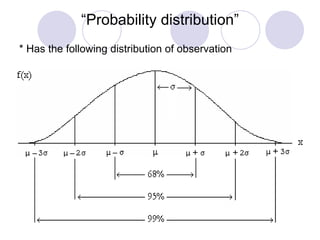
- 40. “ Probability distribution” μ ± 1 σ = ? = ____% from total observation μ ± 2 σ = ? = ____% from total observation μ ± 3 σ = ? = ____% from total observation
- 41. “ Probability distribution” * Has the following distribution of observation
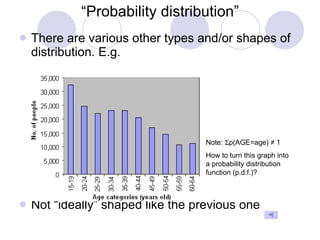
- 42. “ Probability distribution” There are various other types and/or shapes of distribution. E.g. Not “ideally” shaped like the previous one Note: p(AGE=age) ≠ 1 How to turn this graph into a probability distribution function (p.d.f.)?
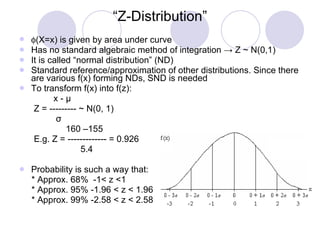
- 43. “ Z-Distribution” (X=x) is given by area under curve Has no standard algebraic method of integration -> Z ~ N(0,1) It is called “normal distribution” (ND) Standard reference/approximation of other distributions. Since there are various f(x) forming NDs, SND is needed To transform f(x) into f(z): x - µ Z = --------- ~ N(0, 1) σ 160 –155 E.g. Z = ------------- = 0.926 5.4 Probability is such a way that: * Approx. 68% -1< z <1 * Approx. 95% -1.96 < z < 1.96 * Approx. 99% -2.58 < z < 2.58
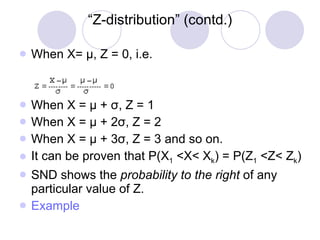
- 44. “ Z-distribution” (contd.) When X= μ , Z = 0, i.e. When X = μ + σ , Z = 1 When X = μ + 2 σ , Z = 2 When X = μ + 3 σ , Z = 3 and so on. It can be proven that P(X 1 <X< X k ) = P(Z 1 <Z< Z k ) SND shows the probability to the right of any particular value of Z. Example
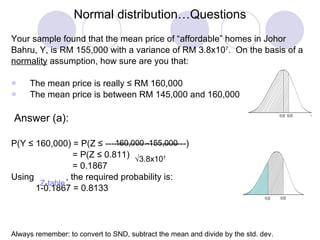
- 45. Normal distribution…Questions Your sample found that the mean price of “affordable” homes in Johor Bahru, Y, is RM 155,000 with a variance of RM 3.8x10 7 . On the basis of a normality assumption, how sure are you that: The mean price is really ≤ RM 160,000 The mean price is between RM 145,000 and 160,000 Answer (a): P(Y ≤ 160,000) = P(Z ≤ ---------------------------) = P(Z ≤ 0.811) = 0.1867 Using , the required probability is: 1-0.1867 = 0.8133 Always remember: to convert to SND, subtract the mean and divide by the std. dev. 160,000 -155,000 3.8x10 7 Z-table
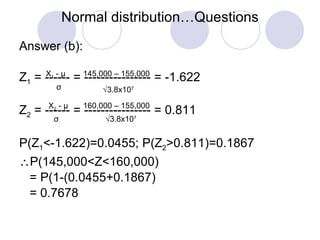
- 46. Normal distribution…Questions Answer (b): Z 1 = ------ = ---------------- = -1.622 Z 2 = ------ = ---------------- = 0.811 P(Z 1 <-1.622)=0.0455; P(Z 2 >0.811)=0.1867 P(145,000<Z<160,000) = P(1-(0.0455+0.1867) = 0.7678 X 1 - μ σ 145,000 – 155,000 3.8x10 7 X 2 - μ σ 160,000 – 155,000 3.8x10 7
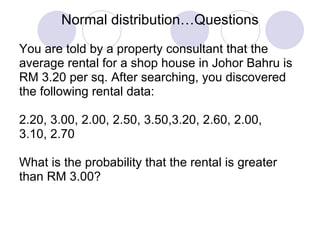
- 47. Normal distribution…Questions You are told by a property consultant that the average rental for a shop house in Johor Bahru is RM 3.20 per sq. After searching, you discovered the following rental data: 2.20, 3.00, 2.00, 2.50, 3.50,3.20, 2.60, 2.00, 3.10, 2.70 What is the probability that the rental is greater than RM 3.00?
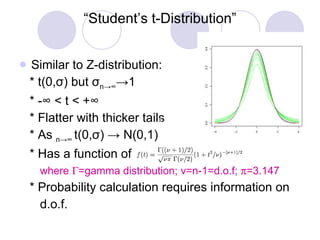
- 48. “ Student’s t-Distribution” Similar to Z-distribution: * t(0, σ ) but σ n->∞ ->1 * -∞ < t < +∞ * Flatter with thicker tails * As n->∞ t(0, σ ) -> N(0,1) * Has a function of where =gamma distribution; v=n-1=d.o.f; =3.147 * Probability calculation requires information on d.o.f.
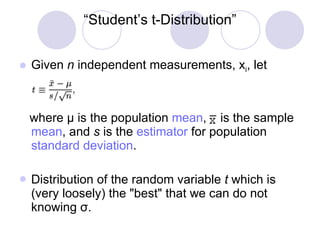
- 49. “ Student’s t-Distribution” Given n independent measurements, x i , let where μ is the population mean , is the sample mean , and s is the estimator for population standard deviation . Distribution of the random variable t which is (very loosely) the "best" that we can do not knowing σ .
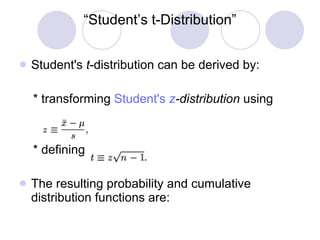
- 50. “ Student’s t-Distribution” Student's t -distribution can be derived by: * transforming Student's z -distribution using * defining The resulting probability and cumulative distribution functions are:
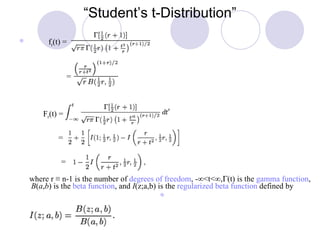
- 51. “ Student’s t-Distribution” where r ≡ n-1 is the number of degrees of freedom , - ∞ <t< ∞ , (t) is the gamma function , B ( a , b ) is the beta function , and I (z;a,b) is the regularized beta function defined by f r (t) = = F r (t) = = =
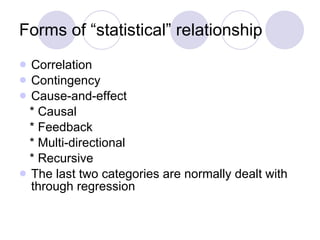
- 52. Forms of “statistical” relationship Correlation Contingency Cause-and-effect * Causal * Feedback * Multi-directional * Recursive The last two categories are normally dealt with through regression
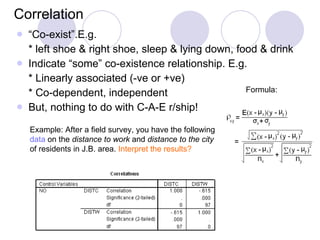
- 53. Correlation “ Co-exist”.E.g. * left shoe & right shoe, sleep & lying down, food & drink Indicate “some” co-existence relationship. E.g. * Linearly associated (-ve or +ve) * Co-dependent, independent But, nothing to do with C-A-E r/ship! Example: After a field survey, you have the following data on the distance to work and distance to the city of residents in J.B. area. Interpret the results? Formula:
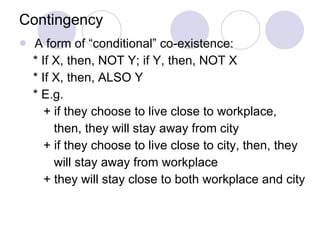
- 54. Contingency A form of “conditional” co-existence: * If X, then, NOT Y; if Y, then, NOT X * If X, then, ALSO Y * E.g. + if they choose to live close to workplace, then, they will stay away from city + if they choose to live close to city, then, they will stay away from workplace + they will stay close to both workplace and city
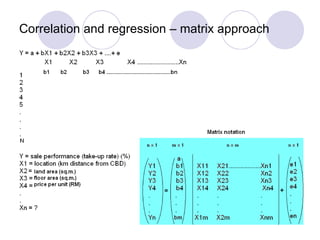
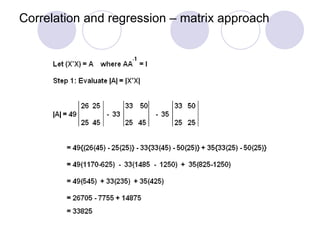
- 55. Correlation and regression – matrix approach
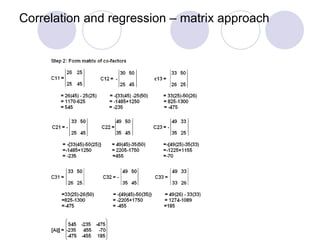
- 56. Correlation and regression – matrix approach
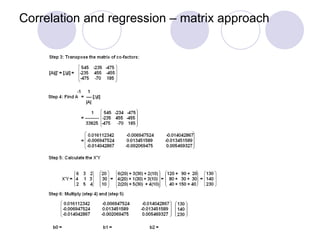
- 57. Correlation and regression – matrix approach
- 58. Correlation and regression – matrix approach
- 59. Correlation and regression – matrix approach
- 60. Test yourselves! Q1: Calculate the min and std. variance of the following data: Q2: Calculate the mean price of the following low-cost houses, in various localities across the country: 170 200 270 175 360 100 140 135 SQ. M OF FLOOR 143 342 241 140 390 128 137 130 PRICE - RM ‘000 17 20 27 73 36 10 14 3 NO. OF LOCALITIES (f) 43 42 41 40 39 38 37 36 PRICE - RM ‘000 (x)
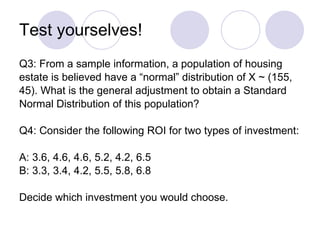
- 61. Test yourselves! Q3: From a sample information, a population of housing estate is believed have a “normal” distribution of X ~ (155, 45). What is the general adjustment to obtain a Standard Normal Distribution of this population? Q4: Consider the following ROI for two types of investment: A: 3.6, 4.6, 4.6, 5.2, 4.2, 6.5 B: 3.3, 3.4, 4.2, 5.5, 5.8, 6.8 Decide which investment you would choose.
- 62. Test yourselves! Q5: Find: (AGE > “30-34”) (AGE ≤ 20-24) ( “35-39”≤ AGE < “50-54”)
- 63. Test yourselves! Q6: You are asked by a property marketing manager to ascertain whether or not distance to work and distance to the city are “equally” important factors influencing people’s choice of house location. You are given the following data for the purpose of testing: Explore the data as follows: Create histograms for both distances . Comment on the shape of the histograms. What is you conclusion? Construct scatter diagram of both distances . Comment on the output. Explore the data and give some analysis. Set a hypothesis that means of both distances are the same. Make your conclusion.
- 64. Test yourselves! (contd.) Q7: From your initial investigation, you belief that tenants of “ low-quality” housing choose to rent particular flat units just to find shelters. In this context ,these groups of people do not pay much attention to pertinent aspects of “quality life” such as accessibility, good surrounding, security, and physical facilities in the living areas. (a) Set your research design and data analysis procedure to address the research issue (b) Test your hypothesis that low-income tenants do not perceive “quality life” to be important in paying their house rentals.
- 65. Thank you