SlideShare a Scribd company logo
Chapter 1 - Introduction to Statistics Part I
Section 6 – Statistics Analysis
Presented By :
This Content is Copyright Reserved Rights Copyright 2025@PTAIndia
Agenda
 Introduction to Statistics Part 1
 Descriptive Versus Inferential Statistics
 Measures of Central Tendency
 Measures of Dispersion
This Content is Copyright Reserved Rights Copyright 2025@PTAIndia
Descriptive vs. Inferential Statistics
Key Facts
1. Definition:
o Descriptive Statistics: Summarizes and presents data meaningfully.
o Inferential Statistics: Uses sample data to make predictions or generalizations about a larger
population.
2. Primary Use:
o Descriptive: Organizing, summarizing, and visualizing data.
o Inferential: Drawing conclusions, hypothesis testing, and making predictions.
3. Techniques Used:
o Descriptive: Measures of central tendency (mean, median, mode), measures of dispersion
(variance, standard deviation), and visualizations (histograms, box plots).
o Inferential: Confidence intervals, hypothesis tests (t-tests, chi-square tests), regression
analysis, and probability distributions.
Descriptive vs. Inferential Statistics
Key Facts
4. Sample vs. Population:
o Descriptive: Works with the entire dataset (if available).
o Inferential: Works with a sample to infer properties of a population.
5. Probability Involvement:
o Descriptive: Does not involve probability; purely summarizes data.
o Inferential: Uses probability theory to make predictions and conclusions.
Descriptive vs. Inferential Statistics
Cheat Sheet.
Feature Descriptive Statistics Inferential Statistics
Purpose Summarizes and describes data
Makes predictions or inferences
about a population
Data Type Raw data or entire dataset
Sample data used to infer about
population
Key Metrics
Mean, median, mode, standard
deviation, range
Hypothesis testing, confidence
intervals, p-values
Probability Use? No Yes
Example Use Case
Calculating the average age of
students in a class
Estimating the average age of all
students in a country from a sample
Graphical Tools Histograms, pie charts, box plots
Regression plots, probability
distributions
Descriptive vs. Inferential Statistics
Comparison: Descriptive vs. Inferential Statistics.
Comparison Aspect Descriptive Statistics Inferential Statistics
Scope Only describes data
Makes conclusions beyond the
data
Use of Samples Not required (uses entire dataset)
Required (uses samples to infer
about population)
Mathematical Methods Basic calculations, charts, graphs
Probability, statistical modeling,
significance testing
Certainty of Results
Certain (as it describes the
dataset)
Uncertain (relies on probability
and estimation)
Application Example
Finding the mean salary of
employees in a company
Predicting national salary trends
from a small survey
Descriptive vs. Inferential Statistics
Interpretation: When to Use Descriptive vs. Inferential Statistics?
Descriptive Statistics:
• Use when you want to summarize or visualize a dataset.
• Example: Finding the average monthly sales of a company from past data.
Inferential Statistics:
• Use when you have a sample and want to make predictions or generalizations
about a population.
• Example: Conducting a survey of 1,000 voters to predict election results.
Measures of Central Tendency – Key Fact
1. Definition: Measures of central tendency summarize a dataset by identifying a single value that represents the
middle or center of the data distribution.
2. Three Main Types:
o Mean (Arithmetic Average) – Sum of all values divided by the number of values.
o Median (Middle Value) – The middle number when data is arranged in order.
o Mode (Most Frequent Value) – The most frequently occurring value(s) in the dataset.
3. Use Cases:
o Mean: Best for normally distributed data.
o Median: Best for skewed data or when there are outliers.
o Mode: Best for categorical data or when identifying the most common value.
4. Sensitivity to Outliers:
o Mean is highly affected by outliers.
o Median is resistant to outliers.
o Mode is not affected by outliers.
Measures of Central Tendency – Cheat Sheet
Measure Formula Best For
Sensitive to
Outliers?
Example
Mean
Mean=∑Values/No.
of Variables
Normally distributed
data
Yes
Average income of
employees
Median
Middle value after
sorting data
Skewed data, data
with outliers
No
Median home
prices in a city
Mode
Most frequently
occurring value(s)
Categorical data,
multimodal
distributions
No
Most common
exam grade in a
class
Measures of Central Tendency
Interpretation of Measures of Central Tendency
1. Mean Interpretation:
o Represents the "typical" value when data is evenly distributed.
o Example: If the average height of students is 170 cm, a randomly selected student is
likely close to this value.
2. Median Interpretation:
o More robust to outliers, representing the central position of ordered data.
o Example: If the median income in a city is $50,000, half of the population earns below
this amount and half earns above.
3. Mode Interpretation:
o Helps identify the most frequent value, useful in categorical data.
o Example: If most students score 85 on an exam, then 85 is the mode, showing the most
common performance level.
Measures of Central Tendency
Comparison of Mean, Median, and Mode
Feature Mean Median Mode
Definition
Sum of values divided by
count
Middle value when sorted
Most frequently occurring
value
Use Case Normally distributed data
Skewed data, income, real
estate prices
Categorical or frequently
occurring values
Affected by Outliers? Yes, significantly No, robust No
Applicability
Continuous & numerical
data
Continuous & numerical
data
Categorical & numerical
data
Example Average test score Median house price Most popular shoe size
Measures of Dispersion
Key Facts
1. Definition: Measures of dispersion describe the spread or variability of data in a dataset.
2. Key Types:
o Range: Difference between the maximum and minimum values.
o Variance: The average squared difference from the mean.
o Standard Deviation (SD): Square root of variance; measures average deviation from the
mean.
o Interquartile Range (IQR): Difference between the 75th percentile (Q3) and 25th
percentile (Q1).
o Coefficient of Variation (CV): Standard deviation relative to the mean, expressed as a
percentage.
Measures of Dispersion
Key Facts
3. Use Cases:
o Range: Quick overview of spread but sensitive to outliers.
o Variance & SD: Best for normally distributed data.
o IQR: Best for skewed data, resistant to outliers.
o CV: Useful for comparing variability across different datasets.
4. Impact of Outliers:
o Variance & SD are highly affected.
o IQR is resistant to outliers.
Measures of Dispersion
Cheat Sheet
Measure Best For
Sensitive to
Outliers?
Example
Range Quick spread estimation Yes
Highest and lowest
salaries in a company
Variance (σ2sigma^2σ2) Normally distributed data Yes Variability in stock prices
Standard Deviation (σ
sigmaσ)
Spread around mean Yes Risk (volatility) in finance
Interquartile Range (IQR) Skewed data No
Income distribution
analysis
Coefficient of Variation (CV)
Comparing variability across
datasets
Yes
Comparing price
fluctuations of different
stocks
Measures of Dispersion
Comparison of Dispersion Measures
Feature Range Variance
Standard
Deviation
IQR CV
Definition Max – Min
Avg. squared
deviations from
the mean
Square root of
variance
Q3 – Q1
SD relative to
mean
Best For
Quick spread
check
Normally
distributed data
General spread
measure
Skewed data
Comparing
different
datasets
Affected by
Outliers?
Yes Yes Yes No Yes
Comparison
Across
Datasets?
No No No No Yes
Measures of Dispersion
Interpretation of Measures of Dispersion
1. Range Interpretation:
o Shows the simplest measure of spread but is unreliable due to sensitivity to outliers.
o Example: If the lowest exam score is 50 and the highest is 98, the range is 48.
2. Standard Deviation Interpretation:
o A low SD means data points are close to the mean.
o A high SD means data is spread out.
o Example: A stock with an SD of $2 is less volatile than one with an SD of $10.
Measures of Dispersion
Interpretation of Measures of Dispersion
3. Interquartile Range (IQR) Interpretation:
o Shows the range of the middle 50% of the data, reducing the effect of
extreme values.
o Example: If Q1 = $40,000 and Q3 = $70,000, then IQR = $30,000,
representing the central salary spread.
o Allows com4. Coefficient of Variation (CV) Interpretation:
parisons across datasets with different units.
o Example: If stock A has a CV of 15% and stock B has a CV of 25%, stock B
is more volatile
Measures of Dispersion
Key Takeaways
✅ Standard deviation is the most common measure of dispersion but is affected
by outliers.
✅ IQR is useful for skewed data since it ignores extreme values.
✅ CV is best when comparing variability across different datasets.
✅ Higher dispersion means more variability in data, which can indicate higher risk
in finance or more diversity in research.
Next Chapter 2 - Introduction to Statistics Part II
Section 6 – Statistics Analysis
Presented By :
This Content is Copyright Reserved Rights Copyright 2025@PTAIndia
Ad

More Related Content

Similar to Section 6 - Chapter 1 - Introduction to Statistics Part I (20)

Introduction to Educational statistics and measurement
Introduction to Educational statistics and measurementIntroduction to Educational statistics and measurement
Introduction to Educational statistics and measurement
matiibugri
 
Review of Basic Statistics and Terminology
Review of Basic Statistics and TerminologyReview of Basic Statistics and Terminology
Review of Basic Statistics and Terminology
aswhite
 
ANALYSIS ANDINTERPRETATION OF DATA Analysis and Interpr.docx
ANALYSIS ANDINTERPRETATION  OF DATA Analysis and Interpr.docxANALYSIS ANDINTERPRETATION  OF DATA Analysis and Interpr.docx
ANALYSIS ANDINTERPRETATION OF DATA Analysis and Interpr.docx
cullenrjzsme
 
Statistics for machine learning shifa noorulain
Statistics for machine learning   shifa noorulainStatistics for machine learning   shifa noorulain
Statistics for machine learning shifa noorulain
ShifaNoorUlAin1
 
050325Online SPSS.pptx spss social science
050325Online SPSS.pptx spss social science050325Online SPSS.pptx spss social science
050325Online SPSS.pptx spss social science
NurFatin805963
 
RM chapter-4 (3).ppt measurements and descriptive
RM chapter-4 (3).ppt measurements and descriptiveRM chapter-4 (3).ppt measurements and descriptive
RM chapter-4 (3).ppt measurements and descriptive
jamsibro140
 
Basic knowledge on statistics
Basic knowledge on statisticsBasic knowledge on statistics
Basic knowledge on statistics
Subodh Khanal
 
Descriptions of data statistics for research
Descriptions of data   statistics for researchDescriptions of data   statistics for research
Descriptions of data statistics for research
Harve Abella
 
RESEARCH II grade 8 descriptive and inferential statistics Fourth Quarter 2025
RESEARCH II grade 8 descriptive and inferential statistics Fourth Quarter 2025RESEARCH II grade 8 descriptive and inferential statistics Fourth Quarter 2025
RESEARCH II grade 8 descriptive and inferential statistics Fourth Quarter 2025
RaellenRegalado
 
CABT Math 8 measures of central tendency and dispersion
CABT Math 8   measures of central tendency and dispersionCABT Math 8   measures of central tendency and dispersion
CABT Math 8 measures of central tendency and dispersion
Gilbert Joseph Abueg
 
Session 1 and 2.pptx
Session 1 and 2.pptxSession 1 and 2.pptx
Session 1 and 2.pptx
AkshitMGoel
 
Data Analysis
Data Analysis Data Analysis
Data Analysis
Dr. Dawit Dibekulu
 
measures of dispersion in mba chapeter two
measures of dispersion in mba chapeter twomeasures of dispersion in mba chapeter two
measures of dispersion in mba chapeter two
SoujanyaLk1
 
Data analysis
Data analysisData analysis
Data analysis
metalkid132
 
Stat11t chapter3
Stat11t chapter3Stat11t chapter3
Stat11t chapter3
raylenepotter
 
Statistics for management
Statistics for managementStatistics for management
Statistics for management
John Prarthan
 
business statistics 1430 important questions 2025.pdf
business statistics 1430 important questions 2025.pdfbusiness statistics 1430 important questions 2025.pdf
business statistics 1430 important questions 2025.pdf
NaveedHussainKhokhar
 
data analysis in Statistics-2023 guide 2023
data analysis in Statistics-2023 guide 2023data analysis in Statistics-2023 guide 2023
data analysis in Statistics-2023 guide 2023
ayesha455941
 
Topic-1-Review-of-Basic-Statistics.pptx
Topic-1-Review-of-Basic-Statistics.pptxTopic-1-Review-of-Basic-Statistics.pptx
Topic-1-Review-of-Basic-Statistics.pptx
JohnLester81
 
0.0 Notes
0.0 Notes0.0 Notes
0.0 Notes
Jacob Cedarbaum
 
Introduction to Educational statistics and measurement
Introduction to Educational statistics and measurementIntroduction to Educational statistics and measurement
Introduction to Educational statistics and measurement
matiibugri
 
Review of Basic Statistics and Terminology
Review of Basic Statistics and TerminologyReview of Basic Statistics and Terminology
Review of Basic Statistics and Terminology
aswhite
 
ANALYSIS ANDINTERPRETATION OF DATA Analysis and Interpr.docx
ANALYSIS ANDINTERPRETATION  OF DATA Analysis and Interpr.docxANALYSIS ANDINTERPRETATION  OF DATA Analysis and Interpr.docx
ANALYSIS ANDINTERPRETATION OF DATA Analysis and Interpr.docx
cullenrjzsme
 
Statistics for machine learning shifa noorulain
Statistics for machine learning   shifa noorulainStatistics for machine learning   shifa noorulain
Statistics for machine learning shifa noorulain
ShifaNoorUlAin1
 
050325Online SPSS.pptx spss social science
050325Online SPSS.pptx spss social science050325Online SPSS.pptx spss social science
050325Online SPSS.pptx spss social science
NurFatin805963
 
RM chapter-4 (3).ppt measurements and descriptive
RM chapter-4 (3).ppt measurements and descriptiveRM chapter-4 (3).ppt measurements and descriptive
RM chapter-4 (3).ppt measurements and descriptive
jamsibro140
 
Basic knowledge on statistics
Basic knowledge on statisticsBasic knowledge on statistics
Basic knowledge on statistics
Subodh Khanal
 
Descriptions of data statistics for research
Descriptions of data   statistics for researchDescriptions of data   statistics for research
Descriptions of data statistics for research
Harve Abella
 
RESEARCH II grade 8 descriptive and inferential statistics Fourth Quarter 2025
RESEARCH II grade 8 descriptive and inferential statistics Fourth Quarter 2025RESEARCH II grade 8 descriptive and inferential statistics Fourth Quarter 2025
RESEARCH II grade 8 descriptive and inferential statistics Fourth Quarter 2025
RaellenRegalado
 
CABT Math 8 measures of central tendency and dispersion
CABT Math 8   measures of central tendency and dispersionCABT Math 8   measures of central tendency and dispersion
CABT Math 8 measures of central tendency and dispersion
Gilbert Joseph Abueg
 
Session 1 and 2.pptx
Session 1 and 2.pptxSession 1 and 2.pptx
Session 1 and 2.pptx
AkshitMGoel
 
measures of dispersion in mba chapeter two
measures of dispersion in mba chapeter twomeasures of dispersion in mba chapeter two
measures of dispersion in mba chapeter two
SoujanyaLk1
 
Statistics for management
Statistics for managementStatistics for management
Statistics for management
John Prarthan
 
business statistics 1430 important questions 2025.pdf
business statistics 1430 important questions 2025.pdfbusiness statistics 1430 important questions 2025.pdf
business statistics 1430 important questions 2025.pdf
NaveedHussainKhokhar
 
data analysis in Statistics-2023 guide 2023
data analysis in Statistics-2023 guide 2023data analysis in Statistics-2023 guide 2023
data analysis in Statistics-2023 guide 2023
ayesha455941
 
Topic-1-Review-of-Basic-Statistics.pptx
Topic-1-Review-of-Basic-Statistics.pptxTopic-1-Review-of-Basic-Statistics.pptx
Topic-1-Review-of-Basic-Statistics.pptx
JohnLester81
 

More from Professional Training Academy (20)

Section 12 - Chapter 1 - Introduction to Quantitative Methods
Section 12 - Chapter 1 - Introduction to Quantitative MethodsSection 12 - Chapter 1 - Introduction to Quantitative Methods
Section 12 - Chapter 1 - Introduction to Quantitative Methods
Professional Training Academy
 
Section 11 - Chapter 3 - Options Derived Volatility
Section 11 - Chapter 3 - Options Derived VolatilitySection 11 - Chapter 3 - Options Derived Volatility
Section 11 - Chapter 3 - Options Derived Volatility
Professional Training Academy
 
Section 11 - Chapter 2 - Measuring Historical Volatility
Section 11 - Chapter 2 - Measuring Historical VolatilitySection 11 - Chapter 2 - Measuring Historical Volatility
Section 11 - Chapter 2 - Measuring Historical Volatility
Professional Training Academy
 
Section 11 - Chapter 1 - Meaning of Volatility to a Technician
Section 11 - Chapter 1 - Meaning of Volatility to a TechnicianSection 11 - Chapter 1 - Meaning of Volatility to a Technician
Section 11 - Chapter 1 - Meaning of Volatility to a Technician
Professional Training Academy
 
Section 9 - Chapter 2 - Common Cycles - CMT Level 1 Short Notes 2025
Section 9 - Chapter 2 - Common Cycles - CMT Level 1 Short Notes 2025Section 9 - Chapter 2 - Common Cycles - CMT Level 1 Short Notes 2025
Section 9 - Chapter 2 - Common Cycles - CMT Level 1 Short Notes 2025
Professional Training Academy
 
Section 9 - Chapter 1 - Foundation of Cycle Theory
Section 9 - Chapter 1 - Foundation of Cycle TheorySection 9 - Chapter 1 - Foundation of Cycle Theory
Section 9 - Chapter 1 - Foundation of Cycle Theory
Professional Training Academy
 
Section 8 - Chapter 3 - Sentiment Measuresfrom External Data
Section 8 - Chapter 3 - Sentiment Measuresfrom External DataSection 8 - Chapter 3 - Sentiment Measuresfrom External Data
Section 8 - Chapter 3 - Sentiment Measuresfrom External Data
Professional Training Academy
 
Section 8 - Chapter 2 - Sentiment Measured From Market Data
Section 8 - Chapter 2 - Sentiment Measured From Market DataSection 8 - Chapter 2 - Sentiment Measured From Market Data
Section 8 - Chapter 2 - Sentiment Measured From Market Data
Professional Training Academy
 
Section 8 - Chapter 1 - Market Sentiment & Technical Analysis
Section 8 - Chapter 1 - Market Sentiment & Technical AnalysisSection 8 - Chapter 1 - Market Sentiment & Technical Analysis
Section 8 - Chapter 1 - Market Sentiment & Technical Analysis
Professional Training Academy
 
Section 7 - Chapter 1 - Behavioral Finance
Section 7 - Chapter 1 - Behavioral FinanceSection 7 - Chapter 1 - Behavioral Finance
Section 7 - Chapter 1 - Behavioral Finance
Professional Training Academy
 
Section 6 - Chapter 3 - Introduction to Probablity
Section 6 - Chapter 3 - Introduction to ProbablitySection 6 - Chapter 3 - Introduction to Probablity
Section 6 - Chapter 3 - Introduction to Probablity
Professional Training Academy
 
Section 6 - Chapter 2 - Introduction to Statistics Part II
Section 6 - Chapter 2 - Introduction to Statistics Part IISection 6 - Chapter 2 - Introduction to Statistics Part II
Section 6 - Chapter 2 - Introduction to Statistics Part II
Professional Training Academy
 
Section 5 - Chapter 3 - Introduction to Bollinger Bands
Section 5 - Chapter 3 - Introduction to Bollinger BandsSection 5 - Chapter 3 - Introduction to Bollinger Bands
Section 5 - Chapter 3 - Introduction to Bollinger Bands
Professional Training Academy
 
Section 5 - Chapter 2 - Technical Indicator Construction
Section 5 - Chapter 2 - Technical Indicator ConstructionSection 5 - Chapter 2 - Technical Indicator Construction
Section 5 - Chapter 2 - Technical Indicator Construction
Professional Training Academy
 
Section 5 - Chapter 1 - Moving Averages - CMT Level 1 2025
Section 5 - Chapter 1 - Moving Averages - CMT Level 1 2025Section 5 - Chapter 1 - Moving Averages - CMT Level 1 2025
Section 5 - Chapter 1 - Moving Averages - CMT Level 1 2025
Professional Training Academy
 
Section 4 - Chapter 4 - Point-and-Figure Patterns
Section 4 - Chapter 4 - Point-and-Figure PatternsSection 4 - Chapter 4 - Point-and-Figure Patterns
Section 4 - Chapter 4 - Point-and-Figure Patterns
Professional Training Academy
 
Section 4 - Chapter 3 - Introduction to Candlestick Patterns
Section 4 - Chapter 3 - Introduction to Candlestick PatternsSection 4 - Chapter 3 - Introduction to Candlestick Patterns
Section 4 - Chapter 3 - Introduction to Candlestick Patterns
Professional Training Academy
 
Section 4 - Chapter 2 - Introduction to candlestick.pptx
Section 4 - Chapter 2 - Introduction to candlestick.pptxSection 4 - Chapter 2 - Introduction to candlestick.pptx
Section 4 - Chapter 2 - Introduction to candlestick.pptx
Professional Training Academy
 
Section 4 – Chapter 1 - Classical Chart Patterns - CMT level 1 2025
Section 4 – Chapter 1 - Classical Chart Patterns - CMT level 1 2025Section 4 – Chapter 1 - Classical Chart Patterns - CMT level 1 2025
Section 4 – Chapter 1 - Classical Chart Patterns - CMT level 1 2025
Professional Training Academy
 
Section 3 - Chapter 6 - Market Internals
Section 3 - Chapter 6 - Market InternalsSection 3 - Chapter 6 - Market Internals
Section 3 - Chapter 6 - Market Internals
Professional Training Academy
 
Section 12 - Chapter 1 - Introduction to Quantitative Methods
Section 12 - Chapter 1 - Introduction to Quantitative MethodsSection 12 - Chapter 1 - Introduction to Quantitative Methods
Section 12 - Chapter 1 - Introduction to Quantitative Methods
Professional Training Academy
 
Section 11 - Chapter 2 - Measuring Historical Volatility
Section 11 - Chapter 2 - Measuring Historical VolatilitySection 11 - Chapter 2 - Measuring Historical Volatility
Section 11 - Chapter 2 - Measuring Historical Volatility
Professional Training Academy
 
Section 11 - Chapter 1 - Meaning of Volatility to a Technician
Section 11 - Chapter 1 - Meaning of Volatility to a TechnicianSection 11 - Chapter 1 - Meaning of Volatility to a Technician
Section 11 - Chapter 1 - Meaning of Volatility to a Technician
Professional Training Academy
 
Section 9 - Chapter 2 - Common Cycles - CMT Level 1 Short Notes 2025
Section 9 - Chapter 2 - Common Cycles - CMT Level 1 Short Notes 2025Section 9 - Chapter 2 - Common Cycles - CMT Level 1 Short Notes 2025
Section 9 - Chapter 2 - Common Cycles - CMT Level 1 Short Notes 2025
Professional Training Academy
 
Section 8 - Chapter 3 - Sentiment Measuresfrom External Data
Section 8 - Chapter 3 - Sentiment Measuresfrom External DataSection 8 - Chapter 3 - Sentiment Measuresfrom External Data
Section 8 - Chapter 3 - Sentiment Measuresfrom External Data
Professional Training Academy
 
Section 8 - Chapter 2 - Sentiment Measured From Market Data
Section 8 - Chapter 2 - Sentiment Measured From Market DataSection 8 - Chapter 2 - Sentiment Measured From Market Data
Section 8 - Chapter 2 - Sentiment Measured From Market Data
Professional Training Academy
 
Section 8 - Chapter 1 - Market Sentiment & Technical Analysis
Section 8 - Chapter 1 - Market Sentiment & Technical AnalysisSection 8 - Chapter 1 - Market Sentiment & Technical Analysis
Section 8 - Chapter 1 - Market Sentiment & Technical Analysis
Professional Training Academy
 
Section 6 - Chapter 2 - Introduction to Statistics Part II
Section 6 - Chapter 2 - Introduction to Statistics Part IISection 6 - Chapter 2 - Introduction to Statistics Part II
Section 6 - Chapter 2 - Introduction to Statistics Part II
Professional Training Academy
 
Section 5 - Chapter 3 - Introduction to Bollinger Bands
Section 5 - Chapter 3 - Introduction to Bollinger BandsSection 5 - Chapter 3 - Introduction to Bollinger Bands
Section 5 - Chapter 3 - Introduction to Bollinger Bands
Professional Training Academy
 
Section 5 - Chapter 2 - Technical Indicator Construction
Section 5 - Chapter 2 - Technical Indicator ConstructionSection 5 - Chapter 2 - Technical Indicator Construction
Section 5 - Chapter 2 - Technical Indicator Construction
Professional Training Academy
 
Section 5 - Chapter 1 - Moving Averages - CMT Level 1 2025
Section 5 - Chapter 1 - Moving Averages - CMT Level 1 2025Section 5 - Chapter 1 - Moving Averages - CMT Level 1 2025
Section 5 - Chapter 1 - Moving Averages - CMT Level 1 2025
Professional Training Academy
 
Section 4 - Chapter 3 - Introduction to Candlestick Patterns
Section 4 - Chapter 3 - Introduction to Candlestick PatternsSection 4 - Chapter 3 - Introduction to Candlestick Patterns
Section 4 - Chapter 3 - Introduction to Candlestick Patterns
Professional Training Academy
 
Section 4 - Chapter 2 - Introduction to candlestick.pptx
Section 4 - Chapter 2 - Introduction to candlestick.pptxSection 4 - Chapter 2 - Introduction to candlestick.pptx
Section 4 - Chapter 2 - Introduction to candlestick.pptx
Professional Training Academy
 
Section 4 – Chapter 1 - Classical Chart Patterns - CMT level 1 2025
Section 4 – Chapter 1 - Classical Chart Patterns - CMT level 1 2025Section 4 – Chapter 1 - Classical Chart Patterns - CMT level 1 2025
Section 4 – Chapter 1 - Classical Chart Patterns - CMT level 1 2025
Professional Training Academy
 
Ad

Recently uploaded (20)

Tax evasion, Tax planning & Tax avoidance.pptx
Tax evasion, Tax  planning &  Tax avoidance.pptxTax evasion, Tax  planning &  Tax avoidance.pptx
Tax evasion, Tax planning & Tax avoidance.pptx
manishbaidya2017
 
Computer crime and Legal issues Computer crime and Legal issues
Computer crime and Legal issues Computer crime and Legal issuesComputer crime and Legal issues Computer crime and Legal issues
Computer crime and Legal issues Computer crime and Legal issues
Abhijit Bodhe
 
Bridging the Transit Gap: Equity Drive Feeder Bus Design for Southeast Brooklyn
Bridging the Transit Gap: Equity Drive Feeder Bus Design for Southeast BrooklynBridging the Transit Gap: Equity Drive Feeder Bus Design for Southeast Brooklyn
Bridging the Transit Gap: Equity Drive Feeder Bus Design for Southeast Brooklyn
i4jd41bk
 
All About the 990 Unlocking Its Mysteries and Its Power.pdf
All About the 990 Unlocking Its Mysteries and Its Power.pdfAll About the 990 Unlocking Its Mysteries and Its Power.pdf
All About the 990 Unlocking Its Mysteries and Its Power.pdf
TechSoup
 
apa-style-referencing-visual-guide-2025.pdf
apa-style-referencing-visual-guide-2025.pdfapa-style-referencing-visual-guide-2025.pdf
apa-style-referencing-visual-guide-2025.pdf
Ishika Ghosh
 
pulse ppt.pptx Types of pulse , characteristics of pulse , Alteration of pulse
pulse  ppt.pptx Types of pulse , characteristics of pulse , Alteration of pulsepulse  ppt.pptx Types of pulse , characteristics of pulse , Alteration of pulse
pulse ppt.pptx Types of pulse , characteristics of pulse , Alteration of pulse
sushreesangita003
 
Lecture 2 CLASSIFICATION OF PHYLUM ARTHROPODA UPTO CLASSES & POSITION OF_1.pptx
Lecture 2 CLASSIFICATION OF PHYLUM ARTHROPODA UPTO CLASSES & POSITION OF_1.pptxLecture 2 CLASSIFICATION OF PHYLUM ARTHROPODA UPTO CLASSES & POSITION OF_1.pptx
Lecture 2 CLASSIFICATION OF PHYLUM ARTHROPODA UPTO CLASSES & POSITION OF_1.pptx
Arshad Shaikh
 
How to Manage Upselling in Odoo 18 Sales
How to Manage Upselling in Odoo 18 SalesHow to Manage Upselling in Odoo 18 Sales
How to Manage Upselling in Odoo 18 Sales
Celine George
 
Herbs Used in Cosmetic Formulations .pptx
Herbs Used in Cosmetic Formulations .pptxHerbs Used in Cosmetic Formulations .pptx
Herbs Used in Cosmetic Formulations .pptx
RAJU THENGE
 
Form View Attributes in Odoo 18 - Odoo Slides
Form View Attributes in Odoo 18 - Odoo SlidesForm View Attributes in Odoo 18 - Odoo Slides
Form View Attributes in Odoo 18 - Odoo Slides
Celine George
 
How to Configure Scheduled Actions in odoo 18
How to Configure Scheduled Actions in odoo 18How to Configure Scheduled Actions in odoo 18
How to Configure Scheduled Actions in odoo 18
Celine George
 
Rock Art As a Source of Ancient Indian History
Rock Art As a Source of Ancient Indian HistoryRock Art As a Source of Ancient Indian History
Rock Art As a Source of Ancient Indian History
Virag Sontakke
 
Kenan Fellows Participants, Projects 2025-26 Cohort
Kenan Fellows Participants, Projects 2025-26 CohortKenan Fellows Participants, Projects 2025-26 Cohort
Kenan Fellows Participants, Projects 2025-26 Cohort
EducationNC
 
What is the Philosophy of Statistics? (and how I was drawn to it)
What is the Philosophy of Statistics? (and how I was drawn to it)What is the Philosophy of Statistics? (and how I was drawn to it)
What is the Philosophy of Statistics? (and how I was drawn to it)
jemille6
 
Lecture 1 Introduction history and institutes of entomology_1.pptx
Lecture 1 Introduction history and institutes of entomology_1.pptxLecture 1 Introduction history and institutes of entomology_1.pptx
Lecture 1 Introduction history and institutes of entomology_1.pptx
Arshad Shaikh
 
Grade 3 - English - Printable Worksheet (PDF Format)
Grade 3 - English - Printable Worksheet  (PDF Format)Grade 3 - English - Printable Worksheet  (PDF Format)
Grade 3 - English - Printable Worksheet (PDF Format)
Sritoma Majumder
 
How to Configure Public Holidays & Mandatory Days in Odoo 18
How to Configure Public Holidays & Mandatory Days in Odoo 18How to Configure Public Holidays & Mandatory Days in Odoo 18
How to Configure Public Holidays & Mandatory Days in Odoo 18
Celine George
 
BỘ ĐỀ TUYỂN SINH VÀO LỚP 10 TIẾNG ANH - 25 ĐỀ THI BÁM SÁT CẤU TRÚC MỚI NHẤT, ...
BỘ ĐỀ TUYỂN SINH VÀO LỚP 10 TIẾNG ANH - 25 ĐỀ THI BÁM SÁT CẤU TRÚC MỚI NHẤT, ...BỘ ĐỀ TUYỂN SINH VÀO LỚP 10 TIẾNG ANH - 25 ĐỀ THI BÁM SÁT CẤU TRÚC MỚI NHẤT, ...
BỘ ĐỀ TUYỂN SINH VÀO LỚP 10 TIẾNG ANH - 25 ĐỀ THI BÁM SÁT CẤU TRÚC MỚI NHẤT, ...
Nguyen Thanh Tu Collection
 
Redesigning Education as a Cognitive Ecosystem: Practical Insights into Emerg...
Redesigning Education as a Cognitive Ecosystem: Practical Insights into Emerg...Redesigning Education as a Cognitive Ecosystem: Practical Insights into Emerg...
Redesigning Education as a Cognitive Ecosystem: Practical Insights into Emerg...
Leonel Morgado
 
Cultivation Practice of Onion in Nepal.pptx
Cultivation Practice of Onion in Nepal.pptxCultivation Practice of Onion in Nepal.pptx
Cultivation Practice of Onion in Nepal.pptx
UmeshTimilsina1
 
Tax evasion, Tax planning & Tax avoidance.pptx
Tax evasion, Tax  planning &  Tax avoidance.pptxTax evasion, Tax  planning &  Tax avoidance.pptx
Tax evasion, Tax planning & Tax avoidance.pptx
manishbaidya2017
 
Computer crime and Legal issues Computer crime and Legal issues
Computer crime and Legal issues Computer crime and Legal issuesComputer crime and Legal issues Computer crime and Legal issues
Computer crime and Legal issues Computer crime and Legal issues
Abhijit Bodhe
 
Bridging the Transit Gap: Equity Drive Feeder Bus Design for Southeast Brooklyn
Bridging the Transit Gap: Equity Drive Feeder Bus Design for Southeast BrooklynBridging the Transit Gap: Equity Drive Feeder Bus Design for Southeast Brooklyn
Bridging the Transit Gap: Equity Drive Feeder Bus Design for Southeast Brooklyn
i4jd41bk
 
All About the 990 Unlocking Its Mysteries and Its Power.pdf
All About the 990 Unlocking Its Mysteries and Its Power.pdfAll About the 990 Unlocking Its Mysteries and Its Power.pdf
All About the 990 Unlocking Its Mysteries and Its Power.pdf
TechSoup
 
apa-style-referencing-visual-guide-2025.pdf
apa-style-referencing-visual-guide-2025.pdfapa-style-referencing-visual-guide-2025.pdf
apa-style-referencing-visual-guide-2025.pdf
Ishika Ghosh
 
pulse ppt.pptx Types of pulse , characteristics of pulse , Alteration of pulse
pulse  ppt.pptx Types of pulse , characteristics of pulse , Alteration of pulsepulse  ppt.pptx Types of pulse , characteristics of pulse , Alteration of pulse
pulse ppt.pptx Types of pulse , characteristics of pulse , Alteration of pulse
sushreesangita003
 
Lecture 2 CLASSIFICATION OF PHYLUM ARTHROPODA UPTO CLASSES & POSITION OF_1.pptx
Lecture 2 CLASSIFICATION OF PHYLUM ARTHROPODA UPTO CLASSES & POSITION OF_1.pptxLecture 2 CLASSIFICATION OF PHYLUM ARTHROPODA UPTO CLASSES & POSITION OF_1.pptx
Lecture 2 CLASSIFICATION OF PHYLUM ARTHROPODA UPTO CLASSES & POSITION OF_1.pptx
Arshad Shaikh
 
How to Manage Upselling in Odoo 18 Sales
How to Manage Upselling in Odoo 18 SalesHow to Manage Upselling in Odoo 18 Sales
How to Manage Upselling in Odoo 18 Sales
Celine George
 
Herbs Used in Cosmetic Formulations .pptx
Herbs Used in Cosmetic Formulations .pptxHerbs Used in Cosmetic Formulations .pptx
Herbs Used in Cosmetic Formulations .pptx
RAJU THENGE
 
Form View Attributes in Odoo 18 - Odoo Slides
Form View Attributes in Odoo 18 - Odoo SlidesForm View Attributes in Odoo 18 - Odoo Slides
Form View Attributes in Odoo 18 - Odoo Slides
Celine George
 
How to Configure Scheduled Actions in odoo 18
How to Configure Scheduled Actions in odoo 18How to Configure Scheduled Actions in odoo 18
How to Configure Scheduled Actions in odoo 18
Celine George
 
Rock Art As a Source of Ancient Indian History
Rock Art As a Source of Ancient Indian HistoryRock Art As a Source of Ancient Indian History
Rock Art As a Source of Ancient Indian History
Virag Sontakke
 
Kenan Fellows Participants, Projects 2025-26 Cohort
Kenan Fellows Participants, Projects 2025-26 CohortKenan Fellows Participants, Projects 2025-26 Cohort
Kenan Fellows Participants, Projects 2025-26 Cohort
EducationNC
 
What is the Philosophy of Statistics? (and how I was drawn to it)
What is the Philosophy of Statistics? (and how I was drawn to it)What is the Philosophy of Statistics? (and how I was drawn to it)
What is the Philosophy of Statistics? (and how I was drawn to it)
jemille6
 
Lecture 1 Introduction history and institutes of entomology_1.pptx
Lecture 1 Introduction history and institutes of entomology_1.pptxLecture 1 Introduction history and institutes of entomology_1.pptx
Lecture 1 Introduction history and institutes of entomology_1.pptx
Arshad Shaikh
 
Grade 3 - English - Printable Worksheet (PDF Format)
Grade 3 - English - Printable Worksheet  (PDF Format)Grade 3 - English - Printable Worksheet  (PDF Format)
Grade 3 - English - Printable Worksheet (PDF Format)
Sritoma Majumder
 
How to Configure Public Holidays & Mandatory Days in Odoo 18
How to Configure Public Holidays & Mandatory Days in Odoo 18How to Configure Public Holidays & Mandatory Days in Odoo 18
How to Configure Public Holidays & Mandatory Days in Odoo 18
Celine George
 
BỘ ĐỀ TUYỂN SINH VÀO LỚP 10 TIẾNG ANH - 25 ĐỀ THI BÁM SÁT CẤU TRÚC MỚI NHẤT, ...
BỘ ĐỀ TUYỂN SINH VÀO LỚP 10 TIẾNG ANH - 25 ĐỀ THI BÁM SÁT CẤU TRÚC MỚI NHẤT, ...BỘ ĐỀ TUYỂN SINH VÀO LỚP 10 TIẾNG ANH - 25 ĐỀ THI BÁM SÁT CẤU TRÚC MỚI NHẤT, ...
BỘ ĐỀ TUYỂN SINH VÀO LỚP 10 TIẾNG ANH - 25 ĐỀ THI BÁM SÁT CẤU TRÚC MỚI NHẤT, ...
Nguyen Thanh Tu Collection
 
Redesigning Education as a Cognitive Ecosystem: Practical Insights into Emerg...
Redesigning Education as a Cognitive Ecosystem: Practical Insights into Emerg...Redesigning Education as a Cognitive Ecosystem: Practical Insights into Emerg...
Redesigning Education as a Cognitive Ecosystem: Practical Insights into Emerg...
Leonel Morgado
 
Cultivation Practice of Onion in Nepal.pptx
Cultivation Practice of Onion in Nepal.pptxCultivation Practice of Onion in Nepal.pptx
Cultivation Practice of Onion in Nepal.pptx
UmeshTimilsina1
 
Ad

Section 6 - Chapter 1 - Introduction to Statistics Part I

  • 1. Chapter 1 - Introduction to Statistics Part I Section 6 – Statistics Analysis Presented By : This Content is Copyright Reserved Rights Copyright 2025@PTAIndia
  • 2. Agenda  Introduction to Statistics Part 1  Descriptive Versus Inferential Statistics  Measures of Central Tendency  Measures of Dispersion This Content is Copyright Reserved Rights Copyright 2025@PTAIndia
  • 3. Descriptive vs. Inferential Statistics Key Facts 1. Definition: o Descriptive Statistics: Summarizes and presents data meaningfully. o Inferential Statistics: Uses sample data to make predictions or generalizations about a larger population. 2. Primary Use: o Descriptive: Organizing, summarizing, and visualizing data. o Inferential: Drawing conclusions, hypothesis testing, and making predictions. 3. Techniques Used: o Descriptive: Measures of central tendency (mean, median, mode), measures of dispersion (variance, standard deviation), and visualizations (histograms, box plots). o Inferential: Confidence intervals, hypothesis tests (t-tests, chi-square tests), regression analysis, and probability distributions.
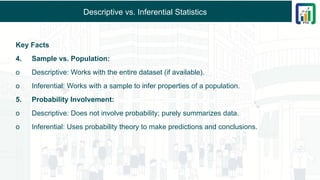
  • 4. Descriptive vs. Inferential Statistics Key Facts 4. Sample vs. Population: o Descriptive: Works with the entire dataset (if available). o Inferential: Works with a sample to infer properties of a population. 5. Probability Involvement: o Descriptive: Does not involve probability; purely summarizes data. o Inferential: Uses probability theory to make predictions and conclusions.
  • 5. Descriptive vs. Inferential Statistics Cheat Sheet. Feature Descriptive Statistics Inferential Statistics Purpose Summarizes and describes data Makes predictions or inferences about a population Data Type Raw data or entire dataset Sample data used to infer about population Key Metrics Mean, median, mode, standard deviation, range Hypothesis testing, confidence intervals, p-values Probability Use? No Yes Example Use Case Calculating the average age of students in a class Estimating the average age of all students in a country from a sample Graphical Tools Histograms, pie charts, box plots Regression plots, probability distributions
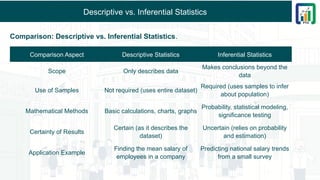
  • 6. Descriptive vs. Inferential Statistics Comparison: Descriptive vs. Inferential Statistics. Comparison Aspect Descriptive Statistics Inferential Statistics Scope Only describes data Makes conclusions beyond the data Use of Samples Not required (uses entire dataset) Required (uses samples to infer about population) Mathematical Methods Basic calculations, charts, graphs Probability, statistical modeling, significance testing Certainty of Results Certain (as it describes the dataset) Uncertain (relies on probability and estimation) Application Example Finding the mean salary of employees in a company Predicting national salary trends from a small survey
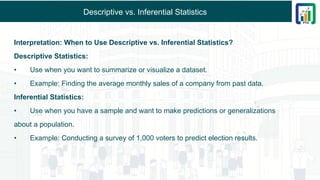
  • 7. Descriptive vs. Inferential Statistics Interpretation: When to Use Descriptive vs. Inferential Statistics? Descriptive Statistics: • Use when you want to summarize or visualize a dataset. • Example: Finding the average monthly sales of a company from past data. Inferential Statistics: • Use when you have a sample and want to make predictions or generalizations about a population. • Example: Conducting a survey of 1,000 voters to predict election results.
  • 8. Descriptive vs. Inferential Statistics Interpretation: When to Use Descriptive vs. Inferential Statistics? Descriptive Statistics: • Use when you want to summarize or visualize a dataset. • Example: Finding the average monthly sales of a company from past data. Inferential Statistics: • Use when you have a sample and want to make predictions or generalizations about a population. • Example: Conducting a survey of 1,000 voters to predict election results.
  • 9. Measures of Central Tendency – Key Fact 1. Definition: Measures of central tendency summarize a dataset by identifying a single value that represents the middle or center of the data distribution. 2. Three Main Types: o Mean (Arithmetic Average) – Sum of all values divided by the number of values. o Median (Middle Value) – The middle number when data is arranged in order. o Mode (Most Frequent Value) – The most frequently occurring value(s) in the dataset. 3. Use Cases: o Mean: Best for normally distributed data. o Median: Best for skewed data or when there are outliers. o Mode: Best for categorical data or when identifying the most common value. 4. Sensitivity to Outliers: o Mean is highly affected by outliers. o Median is resistant to outliers. o Mode is not affected by outliers.
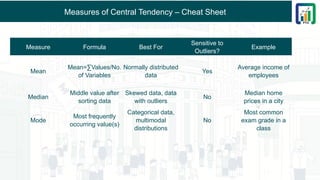
  • 10. Measures of Central Tendency – Cheat Sheet Measure Formula Best For Sensitive to Outliers? Example Mean Mean=∑Values/No. of Variables Normally distributed data Yes Average income of employees Median Middle value after sorting data Skewed data, data with outliers No Median home prices in a city Mode Most frequently occurring value(s) Categorical data, multimodal distributions No Most common exam grade in a class
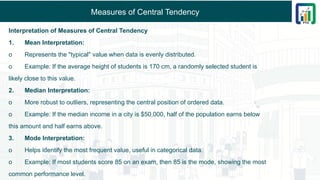
  • 11. Measures of Central Tendency Interpretation of Measures of Central Tendency 1. Mean Interpretation: o Represents the "typical" value when data is evenly distributed. o Example: If the average height of students is 170 cm, a randomly selected student is likely close to this value. 2. Median Interpretation: o More robust to outliers, representing the central position of ordered data. o Example: If the median income in a city is $50,000, half of the population earns below this amount and half earns above. 3. Mode Interpretation: o Helps identify the most frequent value, useful in categorical data. o Example: If most students score 85 on an exam, then 85 is the mode, showing the most common performance level.
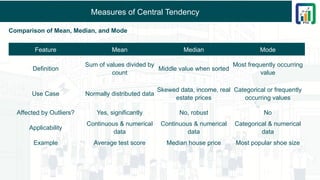
  • 12. Measures of Central Tendency Comparison of Mean, Median, and Mode Feature Mean Median Mode Definition Sum of values divided by count Middle value when sorted Most frequently occurring value Use Case Normally distributed data Skewed data, income, real estate prices Categorical or frequently occurring values Affected by Outliers? Yes, significantly No, robust No Applicability Continuous & numerical data Continuous & numerical data Categorical & numerical data Example Average test score Median house price Most popular shoe size
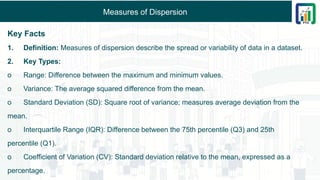
  • 13. Measures of Dispersion Key Facts 1. Definition: Measures of dispersion describe the spread or variability of data in a dataset. 2. Key Types: o Range: Difference between the maximum and minimum values. o Variance: The average squared difference from the mean. o Standard Deviation (SD): Square root of variance; measures average deviation from the mean. o Interquartile Range (IQR): Difference between the 75th percentile (Q3) and 25th percentile (Q1). o Coefficient of Variation (CV): Standard deviation relative to the mean, expressed as a percentage.
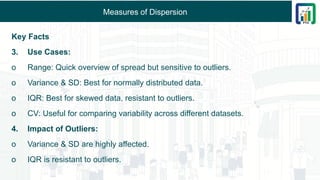
  • 14. Measures of Dispersion Key Facts 3. Use Cases: o Range: Quick overview of spread but sensitive to outliers. o Variance & SD: Best for normally distributed data. o IQR: Best for skewed data, resistant to outliers. o CV: Useful for comparing variability across different datasets. 4. Impact of Outliers: o Variance & SD are highly affected. o IQR is resistant to outliers.
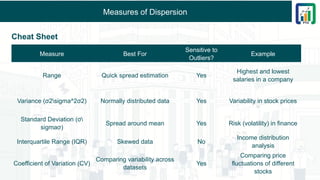
  • 15. Measures of Dispersion Cheat Sheet Measure Best For Sensitive to Outliers? Example Range Quick spread estimation Yes Highest and lowest salaries in a company Variance (σ2sigma^2σ2) Normally distributed data Yes Variability in stock prices Standard Deviation (σ sigmaσ) Spread around mean Yes Risk (volatility) in finance Interquartile Range (IQR) Skewed data No Income distribution analysis Coefficient of Variation (CV) Comparing variability across datasets Yes Comparing price fluctuations of different stocks
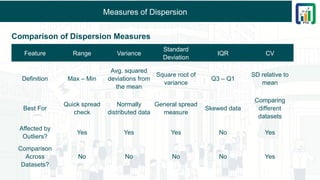
  • 16. Measures of Dispersion Comparison of Dispersion Measures Feature Range Variance Standard Deviation IQR CV Definition Max – Min Avg. squared deviations from the mean Square root of variance Q3 – Q1 SD relative to mean Best For Quick spread check Normally distributed data General spread measure Skewed data Comparing different datasets Affected by Outliers? Yes Yes Yes No Yes Comparison Across Datasets? No No No No Yes
  • 17. Measures of Dispersion Interpretation of Measures of Dispersion 1. Range Interpretation: o Shows the simplest measure of spread but is unreliable due to sensitivity to outliers. o Example: If the lowest exam score is 50 and the highest is 98, the range is 48. 2. Standard Deviation Interpretation: o A low SD means data points are close to the mean. o A high SD means data is spread out. o Example: A stock with an SD of $2 is less volatile than one with an SD of $10.
  • 18. Measures of Dispersion Interpretation of Measures of Dispersion 3. Interquartile Range (IQR) Interpretation: o Shows the range of the middle 50% of the data, reducing the effect of extreme values. o Example: If Q1 = $40,000 and Q3 = $70,000, then IQR = $30,000, representing the central salary spread. o Allows com4. Coefficient of Variation (CV) Interpretation: parisons across datasets with different units. o Example: If stock A has a CV of 15% and stock B has a CV of 25%, stock B is more volatile
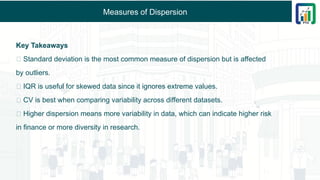
  • 19. Measures of Dispersion Key Takeaways ✅ Standard deviation is the most common measure of dispersion but is affected by outliers. ✅ IQR is useful for skewed data since it ignores extreme values. ✅ CV is best when comparing variability across different datasets. ✅ Higher dispersion means more variability in data, which can indicate higher risk in finance or more diversity in research.
  • 20. Next Chapter 2 - Introduction to Statistics Part II Section 6 – Statistics Analysis Presented By : This Content is Copyright Reserved Rights Copyright 2025@PTAIndia