


More Related Content
Similar to businessstatistics-stat10022-200411201812.ppt (20)
Recently uploaded (20)


![COMPUTER GRAPHICS AND VISUALIZATION :MODULE-02 notes [BCG402-CG&V].pdf](https://ckxe7twkl7vq3ljkxejyz-s-a2157.bj.tsgdht.cn/ss_thumbnails/module-02notesbcg402-cgv-250506151048-aef09ce3-thumbnail.jpg?width=560&fit=bounds)


businessstatistics-stat10022-200411201812.ppt
- 1. Basics of Statistics Definition: Science of collection, presentation, analysis, and reasonable interpretation of data. Statistics presents a rigorous scientific method for gaining insight into data. For example, suppose we measure the weight of 100 patients in a study. With so many measurements, simply looking at the data fails to provide an informative account. However statistics can give an instant overall picture of data based on graphical presentation or numerical summarization irrespective to the number of data points. Besides data summarization, another important task of statistics is to make inference and predict relations of variables. 1
- 2. Data The measurements obtained in a research study are called the data. The goal of statistics is to help researchers organize and interpret the data. 2
- 3. Descriptive statistics are methods for organizing and summarizing data. For example, tables or graphs are used to organize data, and descriptive values such as the average score are used to summarize data. A descriptive value for a population is called a parameter and a descriptive value for a sample is called a statistic. Descriptive Statistics 3
- 5. 5
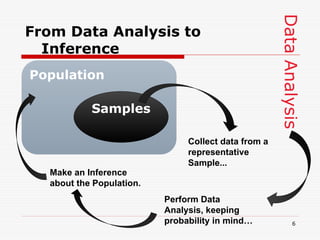
- 6. Data Analysis From Data Analysis to Inference Population Samples Collect data from a representative Sample... Perform Data Analysis, keeping probability in mind… Make an Inference about the Population. 6
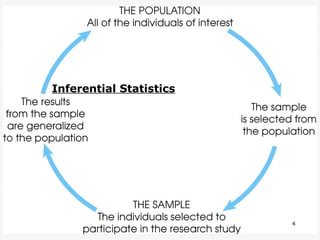
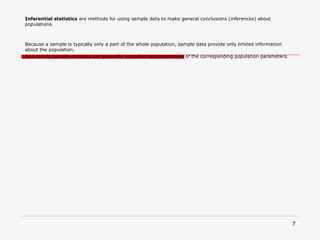
- 7. Inferential statistics are methods for using sample data to make general conclusions (inferences) about populations. Because a sample is typically only a part of the whole population, sample data provide only limited information about the population. As a result, sample statistics are generally imperfect representatives of the corresponding population parameters. 7
- 8. The discrepancy between a sample statistic and its population parameter is called sampling error. Defining and measuring sampling error is a large part of inferential statistics. Sampling Error 8
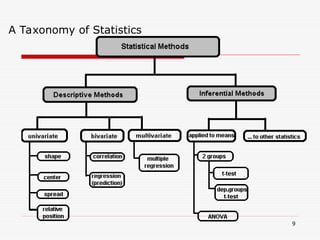
- 9. A Taxonomy of Statistics 9
- 10. Statistical Description of Data: Descriptive Statistics Statistics describes a numeric set of data by its Center Variability Shape Statistics describes a categorical set of data by Frequency, percentage or proportion of each category 10
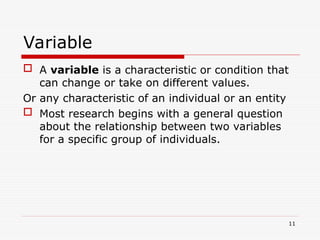
- 11. Variable A variable is a characteristic or condition that can change or take on different values. Or any characteristic of an individual or an entity Most research begins with a general question about the relationship between two variables for a specific group of individuals. 11
- 12. Variable -. Variables can be categorical(Discrete) or quantitative(Discrete and continuous) . Categorical Variables • Nominal - Categorical variables with no inherent order or ranking sequence such as names or classes (e.g., gender, blood group). Value may be a numerical, but without numerical value (e.g., I, II, III). The only operation that can be applied to Nominal variables is enumeration (counts). • Ordinal - Variables with an inherent rank or order, e.g. mild, moderate, severe. Can be compared for equality, or greater or less, but not how much greater or less. mild, moderate or severe illness). Often ordinal variables are re- coded to be quantitative. 12
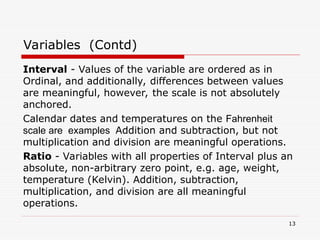
- 13. Interval - Values of the variable are ordered as in Ordinal, and additionally, differences between values are meaningful, however, the scale is not absolutely anchored. Calendar dates and temperatures on the Fahrenheit scale are examples Addition and subtraction, but not multiplication and division are meaningful operations. Ratio - Variables with all properties of Interval plus an absolute, non-arbitrary zero point, e.g. age, weight, temperature (Kelvin). Addition, subtraction, multiplication, and division are all meaningful operations. Variables (Contd) 13
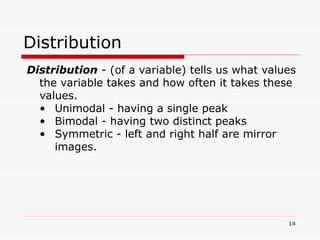
- 14. Distribution Distribution - (of a variable) tells us what values the variable takes and how often it takes these values. • Unimodal - having a single peak • Bimodal - having two distinct peaks • Symmetric - left and right half are mirror images. 14
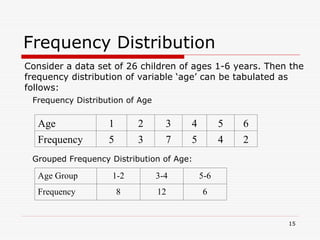
- 15. Frequency Distribution Age 1 2 3 4 5 6 Frequency 5 3 7 5 4 2 Frequency Distribution of Age Grouped Frequency Distribution of Age: Age Group 1-2 3-4 5-6 Frequency 8 12 6 Consider a data set of 26 children of ages 1-6 years. Then the frequency distribution of variable ‘age’ can be tabulated as follows: 15
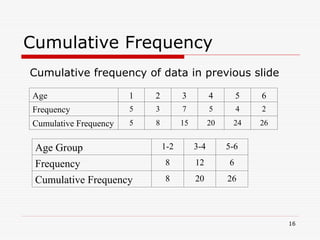
- 16. Cumulative Frequency Age Group 1-2 3-4 5-6 Frequency 8 12 6 Cumulative Frequency 8 20 26 Age 1 2 3 4 5 6 Frequency 5 3 7 5 4 2 Cumulative Frequency 5 8 15 20 24 26 Cumulative frequency of data in previous slide 16
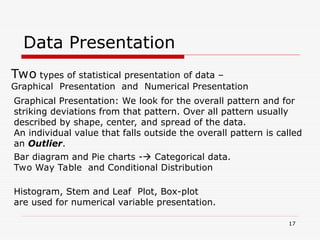
- 17. Data Presentation Two types of statistical presentation of data – Graphical Presentation and Numerical Presentation Graphical Presentation: We look for the overall pattern and for striking deviations from that pattern. Over all pattern usually described by shape, center, and spread of the data. An individual value that falls outside the overall pattern is called an Outlier. Bar diagram and Pie charts - Categorical data. Two Way Table and Conditional Distribution Histogram, Stem and Leaf Plot, Box-plot are used for numerical variable presentation. 17
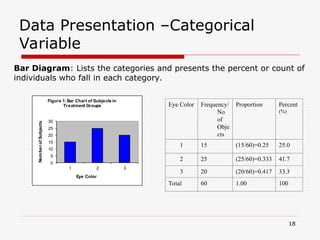
- 18. Data Presentation –Categorical Variable Bar Diagram: Lists the categories and presents the percent or count of individuals who fall in each category. Eye Color Frequency/ No of Obje cts Proportion Percent (%) 1 15 (15/60)=0.25 25.0 2 25 (25/60)=0.333 41.7 3 20 (20/60)=0.417 33.3 Total 60 1.00 100 0 5 10 15 20 25 30 1 2 3 Num ber of Subjects Eye Color Figure 1:Bar Chart of Subjects in Treatment Groups 18
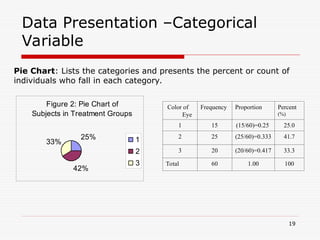
- 19. Data Presentation –Categorical Variable Pie Chart: Lists the categories and presents the percent or count of individuals who fall in each category. Figure 2: Pie Chart of Subjects in Treatment Groups 25% 42% 33% 1 2 3 Color of Eye Frequency Proportion Percent (%) 1 15 (15/60)=0.25 25.0 2 25 (25/60)=0.333 41.7 3 20 (20/60)=0.417 33.3 Total 60 1.00 100 19
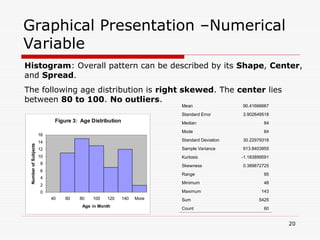
- 20. Graphical Presentation –Numerical Variable Figure 3: Age Distribution 0 2 4 6 8 10 12 14 16 40 60 80 100 120 140 More Age in Month Number of Subjects Histogram: Overall pattern can be described by its Shape, Center, and Spread. The following age distribution is right skewed. The center lies between 80 to 100. No outliers. Mean 90.41666667 Standard Error 3.902649518 Median 84 Mode 84 Standard Deviation 30.22979318 Sample Variance 913.8403955 Kurtosis -1.183899591 Skewness 0.389872725 Range 95 Minimum 48 Maximum 143 Sum 5425 Count 60 20
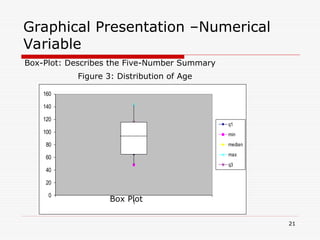
- 21. Graphical Presentation –Numerical Variable Box-Plot: Describes the Five-Number Summary 0 20 40 60 80 100 120 140 160 1 q1 min median max q3 Figure 3: Distribution of Age Box Plot 21