


More Related Content
What's hot (20)
Similar to Statistics as a discipline (20)


Recently uploaded (20)


Statistics as a discipline
- 1. STATISTICS
- 2. What is Statistics? Statistics is the discipline that concerns the collection, organization, analysis, interpretation, and presentation of data. In applying statistics to a scientific, industrial, or social problem, it is conventional to begin with a statistical population or a statistical model to be studied.
- 3. Statistics have become especially important in the information and knowledge age. Professionals and scientists, and also citizens, recognize that it helps in the collection, organization and analysis of data, and that its principles support the interpretation and communication of the results obtained. It is accepted that it is a methodology to obtain knowledge, and likewise a technology, that supports diagnoses, interventions and decision-making in contexts of uncertainty.
- 4. Statistics are used in virtually all scientific disciplines such as the physical and social sciences, as well as in business, the humanities, government, and manufacturing. Statistics is fundamentally a branch of applied mathematics that developed from the application of mathematical tools including calculus and linear algebra to probability theory.
- 5. Types of Statistical Method: Two types of statistical methods are used in analyzing data: descriptive statistics and inferential statistics. Statisticians measure and gather data about the individuals or elements of a sample, then analyze this data to generate descriptive statistics. They can then use these observed characteristics of the sample data, which are properly called "statistics," to make inferences or educated guesses about the unmeasured (or unmeasured) characteristics of the broader population, known as the parameters.
- 7. Descriptive Statistics Descriptive statistics are brief descriptive coefficients that summarize a given data set, which can be either a representation of the entire population or a sample of a population. Descriptive statistics are broken down into measures of central tendency and measures of variability (spread). Measures of central tendency include the mean, median, and mode, while measures of variability include standard deviation, variance, minimum and maximum variables, kurtosis, and skewness.
- 8. Descriptive statistics, in short, help describe and understand the features of a specific data set by giving short summaries about the sample and measures of the data. The most recognized types of descriptive statistics are measures of center: the mean, median, and mode, which are used at almost all levels of math and statistics. The mean, or the average, is calculated by adding all the figures within the data set and then dividing by the number of figures within the set.
- 9. For example, the sum of the following data set is 20: (2, 3, 4, 5, 6). The mean is 4 (20/5). The mode of a data set is the value appearing most often, and the median is the figure situated in the middle of the data set. It is the figure separating the higher figures from the lower figures within a data set. However, there are less common types of descriptive statistics that are still very important.
- 10. Types of Descriptive Statistics All descriptive statistics are either measures of central tendency or measures of variability, also known as measures of dispersion.
- 11. Central Tendency Measures of central tendency focus on the average or middle values of data sets, whereas measures of variability focus on the dispersion of data. These two measures use graphs, tables and general discussions to help people understand the meaning of the analyzed data. Measures of central tendency describe the center position of a distribution for a data set. A person analyzes the frequency of each data point in the distribution and describes it using the mean, median, or mode, which measures the most common patterns of the analyzed data set.
- 12. Measures of Variability Measures of variability (or the measures of spread) aid in analyzing how dispersed the distribution is for a set of data. For example, while the measures of central tendency may give a person the average of a data set, it does not describe how the data is distributed within the set. So while the average of the data maybe 65 out of 100, there can still be data points at both 1 and 100. Measures of variability help communicate this by describing the shape and spread of the data set. Range, quartiles, absolute deviation, and variance are all examples of measures of variability. Consider the following data set: 5, 19, 24, 62, 91, 100. The range of that data set is 95, which is calculated by subtracting the lowest number (5) in the data set from the highest (100).
- 13. Inferential Statistics Inferential statistics use a random sample of data taken from a population to describe and make inferences about the population. Inferential statistics are valuable when examination of each member of an entire population is not convenient or possible. For example, to measure the diameter of each nail that is manufactured in a mill is impractical. You can measure the diameters of a representative random sample of nails. You can use the information from the sample to make generalizations about the diameters of all of the nails.
- 14. Two main areas of Inferential Statistics There are two main areas of inferential statistics: Estimating parameters. This means taking a statistic from your sample data (for example the sample mean) and using it to say something about a population parameter (i.e. the population mean). Hypothesis tests. This is where you can use sample data to answer research questions. For example, you might be interested in knowing if a new cancer drug is effective. Or if breakfast helps children perform better in schools.
- 15. What Is the Difference Between Descriptive and Inferential Statistics? Descriptive statistics are used to describe or summarize the characteristics of a sample or data set, such as a variable's mean, standard deviation, or frequency. Inferential statistics, in contrast, employs any number of techniques to relate variables in a data set to one another, for example using correlation or regression analysis. These can then be used to estimate forecasts or infer causality.
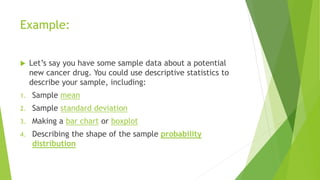
- 16. Example: Let’s say you have some sample data about a potential new cancer drug. You could use descriptive statistics to describe your sample, including: 1. Sample mean 2. Sample standard deviation 3. Making a bar chart or boxplot 4. Describing the shape of the sample probability distribution
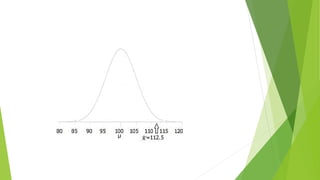
- 18. With inferential statistics you take that sample data from a small number of people and try to determine if the data can predict whether the drug will work for everyone (i.e. the population). There are various ways you can do this, from calculating a z-score (z-scores are a way to show where your data would lie in a normal distribution to post- hoc (advanced) testing.