SlideShare a Scribd company logo
8
Most read
13
Most read
18
Most read
Inferential Statistics

             Objective:
An introduction to what you need to
        know about statistics
Key Terms
Test statistic
Critical value
Degrees of freedom
P value/level
Significance
Chance
Type 1 error
Type 2 error
Interval
Ordinal
Nominal
Inferential Statistics Tests


    Make inferences about the
populations from which the samples
             are drawn
Descriptive Statistics vs. Inferential Statistics


    Allows us to draw
                          Allow us to say whether
       conclusions
                          difference is significant
  Through use of graphs


                                   This difference
                                    Is significant
Probability
Inferential tests use probability to ascertain the
likelihood that a pattern of results could have
arisen by chance.

If the probability of the results occurring by
chance is below a certain level we assume these
results to be significant
Chance


We can state how certain
we are the results are not      Real
     due to chance           difference
P-levels/Significance Levels


                 P ≤0.10
      C
      H          P ≤0.05
      A
      N          P ≤0.01
      C
      E          P ≤0.001


   We can also write these as 10%, 5%, 1%, 0.1%
Significant?
If our test is significant we can
Reject our null hypothesis and accept our
alternative/experimental hypothesis

If our test is not significant we can
Accept our null hypothesis and reject our
alternative/experimental hyp
Levels of measurement
       Nominal

        Ordinal

       Interval
Levels of data: nominal
• Which newspaper paper do you read
  regularly?


• We can put these into categories.
Levels of Data: ordinal
• What grade did you get for each of your
  gcse’s?


• These can be put in order… highest to lowest
Levels of data: interval
• How quick is your reaction time?


• We can measure and compare the exact time
  because the intervals on the ruler are equal.
Inferential Tests
Which test to use depends upon a number of
factors:
• The type of data
• Type of research design (RM vs. IG)
• One tailed or two tailed test
Tests to Know
Mann Whitney U
 Chi Squared
  Wilcoxon T
Spearmans rho
Process


data
                                Complicated arithmetic


       Produce test statistic
Sig levels ½’d for one
                                                                tailed test


       Compare test
          Statistic
     with critical values
        for that test
 To determine significance
            level


critical value: Value that test statistic must reach in order for null hyp to be rejected
Sig levels ½’d for one
      tailed test
Type 1 and Type 2 Errors
Type 1 error

Rejecting a null hypothesis when we should not
                 P level too tight


                           Type 2 error

                           Accepting a null hypothesis when we should not
                                           P level too loose

More Related Content

What's hot (20)

DOCX
descriptive and inferential statistics
Mona Sajid
 
PDF
Confidence Intervals: Basic concepts and overview
Rizwan S A
 
PDF
Inferential Statistics.pdf
Shivakumar B N
 
PPTX
t test using spss
Parag Shah
 
DOCX
Inferential statistics
Maria Theresa
 
PPTX
Manova
Ashutosh Kumar Jha
 
PPTX
INFERENTIAL TECHNIQUES. Inferential Stat. pt 3
John Labrador
 
PPTX
Concept of Inferential statistics
Sarfraz Ahmad
 
PPTX
Sample size calculation
Santam Chakraborty
 
PPTX
Regression analysis on SPSS
AntimDevMishraMTechE
 
PPTX
Statistical inference
Jags Jagdish
 
PPTX
Population & sample lecture 04
DrZahid Khan
 
PPTX
Lecture 6. univariate and bivariate analysis
Dr Rajeev Kumar
 
PPTX
Descriptive statistics
Abdelrahman Alkilani
 
PPTX
Kruskal Wall Test
Khadijah Sohail
 
PPT
Quantitative Data analysis
Muhammad Musawar Ali
 
PPTX
Manova ppt
AnupVs2
 
PPTX
Data analysis
Mira K Desai
 
PPTX
z-test
Marygrace Cagungun
 
PPT
Lecture2 hypothesis testing
o_devinyak
 
descriptive and inferential statistics
Mona Sajid
 
Confidence Intervals: Basic concepts and overview
Rizwan S A
 
Inferential Statistics.pdf
Shivakumar B N
 
t test using spss
Parag Shah
 
Inferential statistics
Maria Theresa
 
INFERENTIAL TECHNIQUES. Inferential Stat. pt 3
John Labrador
 
Concept of Inferential statistics
Sarfraz Ahmad
 
Sample size calculation
Santam Chakraborty
 
Regression analysis on SPSS
AntimDevMishraMTechE
 
Statistical inference
Jags Jagdish
 
Population & sample lecture 04
DrZahid Khan
 
Lecture 6. univariate and bivariate analysis
Dr Rajeev Kumar
 
Descriptive statistics
Abdelrahman Alkilani
 
Kruskal Wall Test
Khadijah Sohail
 
Quantitative Data analysis
Muhammad Musawar Ali
 
Manova ppt
AnupVs2
 
Data analysis
Mira K Desai
 
Lecture2 hypothesis testing
o_devinyak
 

Viewers also liked (20)

PPTX
Basic Concepts of Inferential statistics
Statistics Consultation
 
PPT
Inferential Statistics
ewhite00
 
PPT
Fundamentals of data analysis
Shameem Ali
 
PPTX
Introduction to statistics
madan kumar
 
PPT
Basic Statistical Concepts and Methods
Ahmed-Refat Refat
 
PPT
Introduction to Elementary statistics
krizza joy dela cruz
 
PPSX
Introduction to statistics...ppt rahul
Rahul Dhaker
 
PPTX
Basic Statistics & Data Analysis
Ajendra Sharma
 
PPT
Burns And Bush Chapter 15
Largest Catholic University
 
PPTX
Is the Data Scaled, Ordinal, or Nominal Proportional?
Ken Plummer
 
PPT
Standard Deviation
JRisi
 
PDF
Scales of measurement in statistics
Shahid Imran Khan
 
PPTX
1a difference between inferential and descriptive statistics (explanation)
Ken Plummer
 
PDF
Workplace harassment of health worker
Shahid Imran Khan
 
PPT
K&n's
Mona Sajid
 
PPT
EEX 501 Assess Ch4,5,6,7,All
M, Michelle Jeannite
 
PPTX
Descriptive v inferential
Ken Plummer
 
PPT
Intro to quant_analysis_students
mstegman
 
PPTX
Quick reminder ordinal or scaled or nominal porportional
Ken Plummer
 
PPT
Inferential statistics (2)
rajnulada
 
Basic Concepts of Inferential statistics
Statistics Consultation
 
Inferential Statistics
ewhite00
 
Fundamentals of data analysis
Shameem Ali
 
Introduction to statistics
madan kumar
 
Basic Statistical Concepts and Methods
Ahmed-Refat Refat
 
Introduction to Elementary statistics
krizza joy dela cruz
 
Introduction to statistics...ppt rahul
Rahul Dhaker
 
Basic Statistics & Data Analysis
Ajendra Sharma
 
Burns And Bush Chapter 15
Largest Catholic University
 
Is the Data Scaled, Ordinal, or Nominal Proportional?
Ken Plummer
 
Standard Deviation
JRisi
 
Scales of measurement in statistics
Shahid Imran Khan
 
1a difference between inferential and descriptive statistics (explanation)
Ken Plummer
 
Workplace harassment of health worker
Shahid Imran Khan
 
K&n's
Mona Sajid
 
EEX 501 Assess Ch4,5,6,7,All
M, Michelle Jeannite
 
Descriptive v inferential
Ken Plummer
 
Intro to quant_analysis_students
mstegman
 
Quick reminder ordinal or scaled or nominal porportional
Ken Plummer
 
Inferential statistics (2)
rajnulada
 
Ad

Similar to Inferential statistics powerpoint (20)

PPTX
Inferential stats intro part 1
beechy01
 
PPT
Inferential statistics_AAF 500L 2021.ppt
OfeniJoshuaSeyi
 
PPTX
Introduction-to-Hypothesis-Testing Explained in detail
ShriramKargaonkar
 
PPTX
hypothesis.pptx
PrakharMishra925441
 
PPTX
Hypothsis testing
University of Balochistan
 
PPT
Ch12 (1)
Julie Mae Talangin
 
PPTX
Confidence intervals, hypothesis testing and statistical tests of significanc...
Subramani Parasuraman
 
PPTX
Basics of Hypothesis Testing
Long Beach City College
 
PPTX
Hypothesis testing - college hypothesis testing
myrasingh339
 
PPTX
ONLINE Workshop Presentation - VCW
Academy for Higher Education and Social Science Research
 
PDF
Statistical significance
Mai Ngoc Duc
 
PPTX
Null hypothesis 2
Regent University
 
PPTX
TEST OF SIGNIFICANCE.pptx
muthukrishnaveni anand
 
PDF
20200519073328de6dca404c.pdfkshhjejhehdhd
HimanshuSharma723273
 
PPT
Formulating Hypotheses
Shilpi Panchal
 
DOCX
Inferential statistics hand out (2)
Kimberly Ann Yabut
 
PPTX
HYPOTHESIS TESTING 20200702.pptx
Dr. Gururaj Phatak
 
PDF
Testing of Hypothesis combined with tests.pdf
RamBk5
 
PPTX
Tests of significance
Shubhanshu Gupta
 
Inferential stats intro part 1
beechy01
 
Inferential statistics_AAF 500L 2021.ppt
OfeniJoshuaSeyi
 
Introduction-to-Hypothesis-Testing Explained in detail
ShriramKargaonkar
 
hypothesis.pptx
PrakharMishra925441
 
Hypothsis testing
University of Balochistan
 
Confidence intervals, hypothesis testing and statistical tests of significanc...
Subramani Parasuraman
 
Basics of Hypothesis Testing
Long Beach City College
 
Hypothesis testing - college hypothesis testing
myrasingh339
 
Statistical significance
Mai Ngoc Duc
 
Null hypothesis 2
Regent University
 
TEST OF SIGNIFICANCE.pptx
muthukrishnaveni anand
 
20200519073328de6dca404c.pdfkshhjejhehdhd
HimanshuSharma723273
 
Formulating Hypotheses
Shilpi Panchal
 
Inferential statistics hand out (2)
Kimberly Ann Yabut
 
HYPOTHESIS TESTING 20200702.pptx
Dr. Gururaj Phatak
 
Testing of Hypothesis combined with tests.pdf
RamBk5
 
Tests of significance
Shubhanshu Gupta
 
Ad

More from kellula (10)

PPT
Biological Theories of Gender
kellula
 
PPTX
Health Psychology Revision
kellula
 
PPTX
Schizophrenia and diagnosis by Angeline David
kellula
 
PPT
Sampling
kellula
 
PPTX
Freud
kellula
 
PPT
Freud2
kellula
 
PPT
Schizophrenia
kellula
 
PPT
Psychological therapies and schizophrenia
kellula
 
PPT
Biological explanations by S Laljee
kellula
 
PPT
Dopamine hypothesis
kellula
 
Biological Theories of Gender
kellula
 
Health Psychology Revision
kellula
 
Schizophrenia and diagnosis by Angeline David
kellula
 
Sampling
kellula
 
Freud
kellula
 
Freud2
kellula
 
Schizophrenia
kellula
 
Psychological therapies and schizophrenia
kellula
 
Biological explanations by S Laljee
kellula
 
Dopamine hypothesis
kellula
 

Inferential statistics powerpoint

  • 1. Inferential Statistics Objective: An introduction to what you need to know about statistics
  • 2. Key Terms Test statistic Critical value Degrees of freedom P value/level Significance Chance Type 1 error Type 2 error Interval Ordinal Nominal
  • 3. Inferential Statistics Tests Make inferences about the populations from which the samples are drawn
  • 4. Descriptive Statistics vs. Inferential Statistics Allows us to draw Allow us to say whether conclusions difference is significant Through use of graphs This difference Is significant
  • 5. Probability Inferential tests use probability to ascertain the likelihood that a pattern of results could have arisen by chance. If the probability of the results occurring by chance is below a certain level we assume these results to be significant
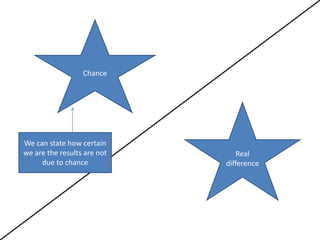
  • 6. Chance We can state how certain we are the results are not Real due to chance difference
  • 7. P-levels/Significance Levels P ≤0.10 C H P ≤0.05 A N P ≤0.01 C E P ≤0.001 We can also write these as 10%, 5%, 1%, 0.1%
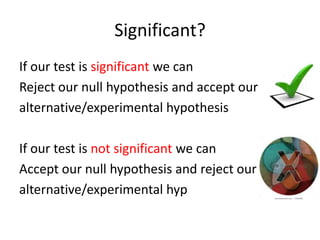
  • 8. Significant? If our test is significant we can Reject our null hypothesis and accept our alternative/experimental hypothesis If our test is not significant we can Accept our null hypothesis and reject our alternative/experimental hyp
  • 9. Levels of measurement Nominal Ordinal Interval
  • 10. Levels of data: nominal • Which newspaper paper do you read regularly? • We can put these into categories.
  • 11. Levels of Data: ordinal • What grade did you get for each of your gcse’s? • These can be put in order… highest to lowest
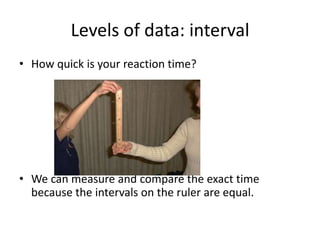
  • 12. Levels of data: interval • How quick is your reaction time? • We can measure and compare the exact time because the intervals on the ruler are equal.
  • 13. Inferential Tests Which test to use depends upon a number of factors: • The type of data • Type of research design (RM vs. IG) • One tailed or two tailed test
  • 14. Tests to Know Mann Whitney U Chi Squared Wilcoxon T Spearmans rho
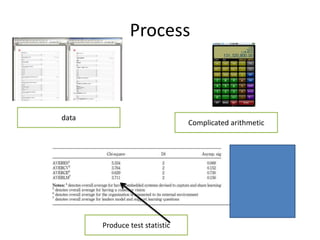
  • 15. Process data Complicated arithmetic Produce test statistic
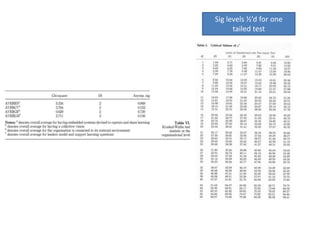
  • 16. Sig levels ½’d for one tailed test Compare test Statistic with critical values for that test To determine significance level critical value: Value that test statistic must reach in order for null hyp to be rejected
  • 17. Sig levels ½’d for one tailed test
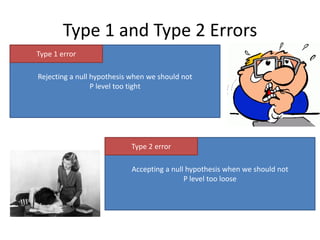
  • 18. Type 1 and Type 2 Errors Type 1 error Rejecting a null hypothesis when we should not P level too tight Type 2 error Accepting a null hypothesis when we should not P level too loose