SlideShare a Scribd company logo
Navigating numbers: How data are used to create statistics
2
Hello, we’re the Office for National
Statistics, or the ONS.
We’re an independent producer of official statistics and
the recognised national statistical institute of the UK.
At the ONS, we collect, analyse and disseminate
statistics about the UK's economy, society and
population.
The government, charities, community groups,
businesses and individuals use these statistics to make
informed decisions on important issues that affect us
all - everything from healthcare and school places to
environmental issues.
We have created five toolkits
based on real world themes.
Each toolkit introduces a
different tool or dataset to
help you explore some of the
data we use in our statistics.
You will also find three
activity or project ideas in
each toolkit to get you
started.
3
Main principles in data and
statistics
The following slides will help you get familiar with
some common terms and statistical concepts,
including:
1. collecting data and making statistics
2. sample design and estimation
3. time series
4. index numbers
5. measuring uncertainty
6. communicating data and statistics
4
5
To create statistics, we collect
data from a variety of sources,
including:
• our own surveys
• the census that happens every
10 years
• data that other organisations
collect, which is known as
admin data
Collecting data and making statistics
6
7
Sample design refers to how the samples
in surveys are specified and selected.
For some statistics, we collect the data using
surveys based on a sample of people, households,
businesses, or whatever we want to find out about.
The samples we use can be complicated, so we
need to design them carefully for high quality
statistics about the economy and society.
Larger samples produce statistics that are more
precise, or more likely to be close to the true value.
8
Stratified sampling
Stratification is dividing the list we are
sampling from into groups, or strata, and
drawing independent samples from each of
these strata.
This is more efficient than using a simple
random sampling approach, which could by
chance result in a sample that does not look
like the population. For example, a health
survey sampling more people in older age
groups would show more ill health than the
true health of the population. Or it could work
the other way with more younger people.
If we know information about the people on
the list, or sampling frame, we can divide it
into strata, such as age group. Then we can
decide how much of the sample to take from
each stratum.
For many surveys, we would sample in
proportion to the size of the stratum. For
example, if 10% of addresses were in a
region, we would draw 10% of the sample
from that region.
9
Cluster or multi-stage sampling
If we need to visit people to collect data, it’s
more efficient if the addresses we need to
visit are close together.
We can achieve this by dividing the
sampling frame into groups, or clusters, of
addresses. We can then draw a random
sample of those clusters. We can take all
the addresses within those sampled
clusters, or a random sample within the
cluster.
Estimates from a clustered sample are less
precise than from a non-clustered sample of
the same size, but the cost of collecting the
data is less. So, this comes down to a
balance of cost and precision.
10
Estimation is the process of creating
estimates from data.
At the ONS, we use estimates when calculating the
characteristics of the population as a whole from the
responses given by those people and businesses
responding to a sample survey.
Estimation is usually achieved through ‘weighting’.
Responses from a sample are weighted to ensure
they represent the entire population without bias,
producing good quality outputs.
11
12
A time series is a series of data points
indexed in time order.
A time series is typically plotted on a line
chart and is often used to show the history
of a subject. For example, looking at
changes in spending on a certain item over
time.
13
14
What are index numbers?
Index numbers are
used to measure
changes and simplify
comparisons.
15
What are index numbers?
Sometimes, we’re most interested in
how things have changed, rather than
the actual values over time. For
example, instead of saying that the
average cost of a pint of milk has gone
from 80p to 84p, we’d say the price has
risen by 5%. An index is a statistical
measure designed to help understand
change and is a statistical measure of
average change.
The Consumer Price Index (CPI)
Tracks the variation in prices for
different consumer goods and
services over time for the country.
It’s used to help calculate inflation,
which is the change in prices.
16
Index numbers typically measure average change
over time, such as inflation, cost of living, house prices
and employment. They can also be used to make other
comparisons, such as between regions of the UK.
Mathematically, an index number is a figure reflecting
price or quantity compared with a standard or base
value. Usually, the base equals 100, with the index
number expressed as 100 times the ratio to the base
value. Here’s an example.
The original average price for a pint of milk was 80p and
we can set this as 100. If it rises to 84p, the index
becomes (84/80 x 100) = 105. This clearly shows the
5% increase.
INTERESTING FACT!
Index numbers are most
often used in economics
as they allow economists
to turn complex data into
easily understood terms.
What are index numbers?
17
18
Using a sample means that statistics are uncertain,
an estimate might differ from the ‘true value’.
At the ONS, the methods we use to report
uncertainty in our statistics include:
• standard error
• confidence interval
• coefficient of variation
• statistical significance
Further explanations of the individual
methodologies are available.
Understanding sampling and the effect it
has on statistics is also important for
interpreting these measures of uncertainty.
As well as random sampling, we also report
on other factors that impact the quality of
our estimates. This helps to make sure that
people use our statistics correctly.
19
20
Communicating data and statistics is
more than just presenting the numbers.
At the ONS, we deal with a lot of complex
data and concepts. Good communication
can help ensure data is interpreted
accurately and used appropriately. It also
allows us to be completely open about the
methods we use to collect data and
calculate statistics.
Some common challenges include:
• working out which statistical terms and
classifications can be simplified, and
which cannot
• finding out which facts are most
important and deciding whether to
make those more prominent
• making it clear what conclusions the
statistics do, and do not, support
21
Data visualisation is the graphical
representation of information and data.
Tables of estimates presented as rows and columns of
numbers can be difficult to read. Using visual elements,
such as charts, graphs and maps, we can provide an
accessible way to see and understand trends, outliers
and patterns in data.
A graph should look good, but it should also present
information in a way that can be easily understood and
analysed.
22
Charts for change over time
These charts usually have time on the
horizontal axis, moving from left to right,
with the variable of interest’s values on the
vertical axis.
Bar charts
Show value through the heights of
bars from a baseline.
Line charts
Allows more flexibility with the y-axis or
when there would be too many bars to plot.
Box plot
When there’s a distribution of values for each
time period, a box plot is helpful to visualise
the most common data values.
23
Charts for composition
Used to show the different components of
a total.
Pie chart
Represent the whole with a circle,
divided into parts.
Stacked bar chart
Each bar is divided into multiple sub-
bars, for demonstrating composition of
multiple values.
Stacked area chart
Show composition of cumulated totals
over time.
24
Charts for data distribution
Used to show the different components of
a total.
Bar charts
Ideal for when a variable is qualitative
and has discrete values.
Histogram
Ideal for analysing data of an ordered
categorical variable.
If ordered, focus on the shape of the
distribution by bringing the bars together.
If you move the bars apart, it becomes a
bar chart.
25
Charts for relationships
between variables
For analysing two or more variables
against one another, and to observe
trends and patterns between them.
Scatter plot
Shows the relationship between
two variables.
Bubble chart
Like the scatter plot but can be used to include
more than two variables by adding colour, shape
or size to each point as indicators.
Combination chart
Dual axis charts combine two different types
of charts that share an X axis but have
separate Y axes. Used to illustrate
relationships or correlations between
variables with different scales.
Ad

More Related Content

Similar to Navigating numbers: How data are used to create statistics (20)

module-5-session- and methodologies 1.pptx
module-5-session- and methodologies 1.pptxmodule-5-session- and methodologies 1.pptx
module-5-session- and methodologies 1.pptx
Venkat Ramana
 
module-5-session-1.pptx module 5 session
module-5-session-1.pptx module 5 sessionmodule-5-session-1.pptx module 5 session
module-5-session-1.pptx module 5 session
sadiariasat10
 
Data Analytics key concepts with tools for da
Data Analytics key concepts with tools for daData Analytics key concepts with tools for da
Data Analytics key concepts with tools for da
vadiraja6
 
Statistics an introduction (1)
Statistics  an introduction (1)Statistics  an introduction (1)
Statistics an introduction (1)
Suresh Kumar Murugesan
 
Sensitivity Analysis
Sensitivity AnalysisSensitivity Analysis
Sensitivity Analysis
Beth Johnson
 
Chapter 1: Introduction to Statistics.pptx
Chapter 1: Introduction to Statistics.pptxChapter 1: Introduction to Statistics.pptx
Chapter 1: Introduction to Statistics.pptx
RaviSinghMahatra
 
businessstatistics-stat10022-200411201812.ppt
businessstatistics-stat10022-200411201812.pptbusinessstatistics-stat10022-200411201812.ppt
businessstatistics-stat10022-200411201812.ppt
tejashreegurav243
 
Business statistics (Basics)
Business statistics (Basics)Business statistics (Basics)
Business statistics (Basics)
AhmedToheed3
 
Introduction to Statistics
Introduction to StatisticsIntroduction to Statistics
Introduction to Statistics
aan786
 
Data presentation by nndd data presentation.pdf
Data presentation by nndd data presentation.pdfData presentation by nndd data presentation.pdf
Data presentation by nndd data presentation.pdf
ppmiitkgp
 
Survey procedures
Survey proceduresSurvey procedures
Survey procedures
GeorgeGidudu
 
DRS-112 Exploratory Data Analysis (YUE, PGDRS).pdf
DRS-112 Exploratory Data Analysis (YUE, PGDRS).pdfDRS-112 Exploratory Data Analysis (YUE, PGDRS).pdf
DRS-112 Exploratory Data Analysis (YUE, PGDRS).pdf
Nay Aung
 
ONS Guide to Social and Economic Research – Welsh Baccalaureate Teacher Training
ONS Guide to Social and Economic Research – Welsh Baccalaureate Teacher TrainingONS Guide to Social and Economic Research – Welsh Baccalaureate Teacher Training
ONS Guide to Social and Economic Research – Welsh Baccalaureate Teacher Training
Office for National Statistics
 
Statistics Assignments 090427
Statistics Assignments 090427Statistics Assignments 090427
Statistics Assignments 090427
amykua
 
Biostatistics ppt itroductionchapter 1.pptx
Biostatistics ppt itroductionchapter 1.pptxBiostatistics ppt itroductionchapter 1.pptx
Biostatistics ppt itroductionchapter 1.pptx
jkmrz2302
 
Basic concept of statistics
Basic concept of statisticsBasic concept of statistics
Basic concept of statistics
GC University Faisalabad Pakistan
 
STATISTICAL PROCEDURES (Discriptive Statistics).pptx
STATISTICAL PROCEDURES (Discriptive Statistics).pptxSTATISTICAL PROCEDURES (Discriptive Statistics).pptx
STATISTICAL PROCEDURES (Discriptive Statistics).pptx
MuhammadNafees42
 
Computing Descriptive Statistics © 2014 Argos.docx
 Computing Descriptive Statistics     © 2014 Argos.docx Computing Descriptive Statistics     © 2014 Argos.docx
Computing Descriptive Statistics © 2014 Argos.docx
aryan532920
 
Computing Descriptive Statistics © 2014 Argos.docx
Computing Descriptive Statistics     © 2014 Argos.docxComputing Descriptive Statistics     © 2014 Argos.docx
Computing Descriptive Statistics © 2014 Argos.docx
AASTHA76
 
STATISTICS.pptx
STATISTICS.pptxSTATISTICS.pptx
STATISTICS.pptx
theadarshagarwal
 
module-5-session- and methodologies 1.pptx
module-5-session- and methodologies 1.pptxmodule-5-session- and methodologies 1.pptx
module-5-session- and methodologies 1.pptx
Venkat Ramana
 
module-5-session-1.pptx module 5 session
module-5-session-1.pptx module 5 sessionmodule-5-session-1.pptx module 5 session
module-5-session-1.pptx module 5 session
sadiariasat10
 
Data Analytics key concepts with tools for da
Data Analytics key concepts with tools for daData Analytics key concepts with tools for da
Data Analytics key concepts with tools for da
vadiraja6
 
Sensitivity Analysis
Sensitivity AnalysisSensitivity Analysis
Sensitivity Analysis
Beth Johnson
 
Chapter 1: Introduction to Statistics.pptx
Chapter 1: Introduction to Statistics.pptxChapter 1: Introduction to Statistics.pptx
Chapter 1: Introduction to Statistics.pptx
RaviSinghMahatra
 
businessstatistics-stat10022-200411201812.ppt
businessstatistics-stat10022-200411201812.pptbusinessstatistics-stat10022-200411201812.ppt
businessstatistics-stat10022-200411201812.ppt
tejashreegurav243
 
Business statistics (Basics)
Business statistics (Basics)Business statistics (Basics)
Business statistics (Basics)
AhmedToheed3
 
Introduction to Statistics
Introduction to StatisticsIntroduction to Statistics
Introduction to Statistics
aan786
 
Data presentation by nndd data presentation.pdf
Data presentation by nndd data presentation.pdfData presentation by nndd data presentation.pdf
Data presentation by nndd data presentation.pdf
ppmiitkgp
 
DRS-112 Exploratory Data Analysis (YUE, PGDRS).pdf
DRS-112 Exploratory Data Analysis (YUE, PGDRS).pdfDRS-112 Exploratory Data Analysis (YUE, PGDRS).pdf
DRS-112 Exploratory Data Analysis (YUE, PGDRS).pdf
Nay Aung
 
ONS Guide to Social and Economic Research – Welsh Baccalaureate Teacher Training
ONS Guide to Social and Economic Research – Welsh Baccalaureate Teacher TrainingONS Guide to Social and Economic Research – Welsh Baccalaureate Teacher Training
ONS Guide to Social and Economic Research – Welsh Baccalaureate Teacher Training
Office for National Statistics
 
Statistics Assignments 090427
Statistics Assignments 090427Statistics Assignments 090427
Statistics Assignments 090427
amykua
 
Biostatistics ppt itroductionchapter 1.pptx
Biostatistics ppt itroductionchapter 1.pptxBiostatistics ppt itroductionchapter 1.pptx
Biostatistics ppt itroductionchapter 1.pptx
jkmrz2302
 
STATISTICAL PROCEDURES (Discriptive Statistics).pptx
STATISTICAL PROCEDURES (Discriptive Statistics).pptxSTATISTICAL PROCEDURES (Discriptive Statistics).pptx
STATISTICAL PROCEDURES (Discriptive Statistics).pptx
MuhammadNafees42
 
Computing Descriptive Statistics © 2014 Argos.docx
 Computing Descriptive Statistics     © 2014 Argos.docx Computing Descriptive Statistics     © 2014 Argos.docx
Computing Descriptive Statistics © 2014 Argos.docx
aryan532920
 
Computing Descriptive Statistics © 2014 Argos.docx
Computing Descriptive Statistics     © 2014 Argos.docxComputing Descriptive Statistics     © 2014 Argos.docx
Computing Descriptive Statistics © 2014 Argos.docx
AASTHA76
 

More from Office for National Statistics (20)

Measuring what matters most: understanding national well-being
Measuring what matters most: understanding national well-beingMeasuring what matters most: understanding national well-being
Measuring what matters most: understanding national well-being
Office for National Statistics
 
ONS Economic Forum Slidepack - 24 March 2025 (slideshare).pptx
ONS Economic Forum Slidepack - 24 March 2025 (slideshare).pptxONS Economic Forum Slidepack - 24 March 2025 (slideshare).pptx
ONS Economic Forum Slidepack - 24 March 2025 (slideshare).pptx
Office for National Statistics
 
Bringing data to life: Artificial Intelligence and innovation - keeping human...
Bringing data to life: Artificial Intelligence and innovation - keeping human...Bringing data to life: Artificial Intelligence and innovation - keeping human...
Bringing data to life: Artificial Intelligence and innovation - keeping human...
Office for National Statistics
 
SlideShare ONS Economic Forum Slidepack - 27 January 2025
SlideShare ONS Economic Forum Slidepack - 27 January 2025SlideShare ONS Economic Forum Slidepack - 27 January 2025
SlideShare ONS Economic Forum Slidepack - 27 January 2025
Office for National Statistics
 
A Quick Introduction to the Reference Data Management Framework
A Quick Introduction to the Reference Data Management FrameworkA Quick Introduction to the Reference Data Management Framework
A Quick Introduction to the Reference Data Management Framework
Office for National Statistics
 
Reference Data Management Framework Overview Digital Booklet
Reference Data Management Framework Overview Digital BookletReference Data Management Framework Overview Digital Booklet
Reference Data Management Framework Overview Digital Booklet
Office for National Statistics
 
Bringing data to life: How are your vitals? Exploring health by numbers
Bringing data to life: How are your vitals? Exploring health by numbersBringing data to life: How are your vitals? Exploring health by numbers
Bringing data to life: How are your vitals? Exploring health by numbers
Office for National Statistics
 
SlideShare Annual crime and justice statistics forum - 7 November 2024
SlideShare Annual crime and justice statistics forum - 7 November 2024SlideShare Annual crime and justice statistics forum - 7 November 2024
SlideShare Annual crime and justice statistics forum - 7 November 2024
Office for National Statistics
 
SlideShare ONS Economic Forum Slidepack - 25 November 2024
SlideShare ONS Economic Forum Slidepack - 25 November 2024SlideShare ONS Economic Forum Slidepack - 25 November 2024
SlideShare ONS Economic Forum Slidepack - 25 November 2024
Office for National Statistics
 
Air fryers and vinyl records: how we measure the cost of living
Air fryers and vinyl records: how we measure the cost of livingAir fryers and vinyl records: how we measure the cost of living
Air fryers and vinyl records: how we measure the cost of living
Office for National Statistics
 
Bringing data to life - environment static.pptx
Bringing data to life - environment static.pptxBringing data to life - environment static.pptx
Bringing data to life - environment static.pptx
Office for National Statistics
 
Bringing data to life an introduction to statistics
Bringing data to life an introduction to statisticsBringing data to life an introduction to statistics
Bringing data to life an introduction to statistics
Office for National Statistics
 
SlideShare – ONS Economic Forum Slidepack 21 October 2024
SlideShare – ONS Economic Forum Slidepack  21 October 2024SlideShare – ONS Economic Forum Slidepack  21 October 2024
SlideShare – ONS Economic Forum Slidepack 21 October 2024
Office for National Statistics
 
Navigating numbers: Business, industry and trade (PowerPoint)
Navigating numbers: Business, industry and trade (PowerPoint)Navigating numbers: Business, industry and trade (PowerPoint)
Navigating numbers: Business, industry and trade (PowerPoint)
Office for National Statistics
 
Navigating numbers: Inflation (PowerPoint)
Navigating numbers: Inflation (PowerPoint)Navigating numbers: Inflation (PowerPoint)
Navigating numbers: Inflation (PowerPoint)
Office for National Statistics
 
SlideShare ONS Economic Forum Slidepack - 23 September 2024
SlideShare ONS Economic Forum Slidepack - 23 September 2024SlideShare ONS Economic Forum Slidepack - 23 September 2024
SlideShare ONS Economic Forum Slidepack - 23 September 2024
Office for National Statistics
 
Defnyddio rhifau: Busnes, diwydiant a masnach
Defnyddio rhifau: Busnes, diwydiant a masnachDefnyddio rhifau: Busnes, diwydiant a masnach
Defnyddio rhifau: Busnes, diwydiant a masnach
Office for National Statistics
 
Defnyddio rhifau: Iechyd a llesiant sleidiau cyflwyniad
Defnyddio rhifau: Iechyd a llesiant sleidiau cyflwyniadDefnyddio rhifau: Iechyd a llesiant sleidiau cyflwyniad
Defnyddio rhifau: Iechyd a llesiant sleidiau cyflwyniad
Office for National Statistics
 
Defnyddio rhifau: Cyfrifiad sleidiau cyflwyniad
Defnyddio rhifau: Cyfrifiad sleidiau cyflwyniadDefnyddio rhifau: Cyfrifiad sleidiau cyflwyniad
Defnyddio rhifau: Cyfrifiad sleidiau cyflwyniad
Office for National Statistics
 
Defnyddio rhifau: Chwyddiant sleidiau cyflwyniad
Defnyddio rhifau: Chwyddiant sleidiau cyflwyniadDefnyddio rhifau: Chwyddiant sleidiau cyflwyniad
Defnyddio rhifau: Chwyddiant sleidiau cyflwyniad
Office for National Statistics
 
Measuring what matters most: understanding national well-being
Measuring what matters most: understanding national well-beingMeasuring what matters most: understanding national well-being
Measuring what matters most: understanding national well-being
Office for National Statistics
 
ONS Economic Forum Slidepack - 24 March 2025 (slideshare).pptx
ONS Economic Forum Slidepack - 24 March 2025 (slideshare).pptxONS Economic Forum Slidepack - 24 March 2025 (slideshare).pptx
ONS Economic Forum Slidepack - 24 March 2025 (slideshare).pptx
Office for National Statistics
 
Bringing data to life: Artificial Intelligence and innovation - keeping human...
Bringing data to life: Artificial Intelligence and innovation - keeping human...Bringing data to life: Artificial Intelligence and innovation - keeping human...
Bringing data to life: Artificial Intelligence and innovation - keeping human...
Office for National Statistics
 
SlideShare ONS Economic Forum Slidepack - 27 January 2025
SlideShare ONS Economic Forum Slidepack - 27 January 2025SlideShare ONS Economic Forum Slidepack - 27 January 2025
SlideShare ONS Economic Forum Slidepack - 27 January 2025
Office for National Statistics
 
A Quick Introduction to the Reference Data Management Framework
A Quick Introduction to the Reference Data Management FrameworkA Quick Introduction to the Reference Data Management Framework
A Quick Introduction to the Reference Data Management Framework
Office for National Statistics
 
Reference Data Management Framework Overview Digital Booklet
Reference Data Management Framework Overview Digital BookletReference Data Management Framework Overview Digital Booklet
Reference Data Management Framework Overview Digital Booklet
Office for National Statistics
 
Bringing data to life: How are your vitals? Exploring health by numbers
Bringing data to life: How are your vitals? Exploring health by numbersBringing data to life: How are your vitals? Exploring health by numbers
Bringing data to life: How are your vitals? Exploring health by numbers
Office for National Statistics
 
SlideShare Annual crime and justice statistics forum - 7 November 2024
SlideShare Annual crime and justice statistics forum - 7 November 2024SlideShare Annual crime and justice statistics forum - 7 November 2024
SlideShare Annual crime and justice statistics forum - 7 November 2024
Office for National Statistics
 
SlideShare ONS Economic Forum Slidepack - 25 November 2024
SlideShare ONS Economic Forum Slidepack - 25 November 2024SlideShare ONS Economic Forum Slidepack - 25 November 2024
SlideShare ONS Economic Forum Slidepack - 25 November 2024
Office for National Statistics
 
Air fryers and vinyl records: how we measure the cost of living
Air fryers and vinyl records: how we measure the cost of livingAir fryers and vinyl records: how we measure the cost of living
Air fryers and vinyl records: how we measure the cost of living
Office for National Statistics
 
SlideShare – ONS Economic Forum Slidepack 21 October 2024
SlideShare – ONS Economic Forum Slidepack  21 October 2024SlideShare – ONS Economic Forum Slidepack  21 October 2024
SlideShare – ONS Economic Forum Slidepack 21 October 2024
Office for National Statistics
 
Navigating numbers: Business, industry and trade (PowerPoint)
Navigating numbers: Business, industry and trade (PowerPoint)Navigating numbers: Business, industry and trade (PowerPoint)
Navigating numbers: Business, industry and trade (PowerPoint)
Office for National Statistics
 
SlideShare ONS Economic Forum Slidepack - 23 September 2024
SlideShare ONS Economic Forum Slidepack - 23 September 2024SlideShare ONS Economic Forum Slidepack - 23 September 2024
SlideShare ONS Economic Forum Slidepack - 23 September 2024
Office for National Statistics
 
Defnyddio rhifau: Iechyd a llesiant sleidiau cyflwyniad
Defnyddio rhifau: Iechyd a llesiant sleidiau cyflwyniadDefnyddio rhifau: Iechyd a llesiant sleidiau cyflwyniad
Defnyddio rhifau: Iechyd a llesiant sleidiau cyflwyniad
Office for National Statistics
 
Ad

Recently uploaded (20)

Contributi dei parlamentari del PD - Contributi L. 3/2019
Contributi dei parlamentari del PD - Contributi L. 3/2019Contributi dei parlamentari del PD - Contributi L. 3/2019
Contributi dei parlamentari del PD - Contributi L. 3/2019
Partito democratico
 
Hunden Grand Sierra Resort arena project analysis.pdf
Hunden Grand Sierra Resort arena project analysis.pdfHunden Grand Sierra Resort arena project analysis.pdf
Hunden Grand Sierra Resort arena project analysis.pdf
This Is Reno
 
TRAUMA MANAGEMENTrbdheyegdhdhdhdhrd.pptx
TRAUMA MANAGEMENTrbdheyegdhdhdhdhrd.pptxTRAUMA MANAGEMENTrbdheyegdhdhdhdhrd.pptx
TRAUMA MANAGEMENTrbdheyegdhdhdhdhrd.pptx
gaisga4er
 
The Federal Perspective on Coverage of Medications to Treat Obesity: Consider...
The Federal Perspective on Coverage of Medications to Treat Obesity: Consider...The Federal Perspective on Coverage of Medications to Treat Obesity: Consider...
The Federal Perspective on Coverage of Medications to Treat Obesity: Consider...
Congressional Budget Office
 
Mata kuliah Konflik Manajemen SDM FD.pptx
Mata kuliah Konflik Manajemen SDM FD.pptxMata kuliah Konflik Manajemen SDM FD.pptx
Mata kuliah Konflik Manajemen SDM FD.pptx
pikipardede1
 
Lessons Learned from the Decade of Action: The UN Sustainable Development Goa...
Lessons Learned from the Decade of Action: The UN Sustainable Development Goa...Lessons Learned from the Decade of Action: The UN Sustainable Development Goa...
Lessons Learned from the Decade of Action: The UN Sustainable Development Goa...
Energy for One World
 
City of Reno report reveals $1 million in parking fines uncollected
City of Reno report reveals $1 million in parking fines uncollectedCity of Reno report reveals $1 million in parking fines uncollected
City of Reno report reveals $1 million in parking fines uncollected
This Is Reno
 
Indian Finance Acts Explained with Tax Updates
Indian Finance Acts Explained with Tax UpdatesIndian Finance Acts Explained with Tax Updates
Indian Finance Acts Explained with Tax Updates
incometaxindia2027
 
session 3 Good Governance Index- Shabbeer.pptx
session 3 Good Governance Index- Shabbeer.pptxsession 3 Good Governance Index- Shabbeer.pptx
session 3 Good Governance Index- Shabbeer.pptx
GodfreyPrince2
 
西班牙卢森堡商学院毕业证书文凭定制LSB成绩单购买
西班牙卢森堡商学院毕业证书文凭定制LSB成绩单购买西班牙卢森堡商学院毕业证书文凭定制LSB成绩单购买
西班牙卢森堡商学院毕业证书文凭定制LSB成绩单购买
Taqyea
 
DFARS Part 223 - Environment, Energy And Water Efficiency, Renewable Energy T...
DFARS Part 223 - Environment, Energy And Water Efficiency, Renewable Energy T...DFARS Part 223 - Environment, Energy And Water Efficiency, Renewable Energy T...
DFARS Part 223 - Environment, Energy And Water Efficiency, Renewable Energy T...
JSchaus & Associates
 
aaaaaaaaaaaaaaaaaaaaaaaaexit ticket.pptx
aaaaaaaaaaaaaaaaaaaaaaaaexit ticket.pptxaaaaaaaaaaaaaaaaaaaaaaaaexit ticket.pptx
aaaaaaaaaaaaaaaaaaaaaaaaexit ticket.pptx
mhdali1012
 
Warming Hearts Dhabla Distribution in Rajkot
Warming Hearts Dhabla Distribution in RajkotWarming Hearts Dhabla Distribution in Rajkot
Warming Hearts Dhabla Distribution in Rajkot
Power SEO
 
Lessons Learned from the Decade of Action: The Paris Agreement and Beyond (1)...
Lessons Learned from the Decade of Action: The Paris Agreement and Beyond (1)...Lessons Learned from the Decade of Action: The Paris Agreement and Beyond (1)...
Lessons Learned from the Decade of Action: The Paris Agreement and Beyond (1)...
Energy for One World
 
The Federal Environment for Surface Transportation Infrastructure
The Federal Environment for Surface Transportation InfrastructureThe Federal Environment for Surface Transportation Infrastructure
The Federal Environment for Surface Transportation Infrastructure
Congressional Budget Office
 
STUART HODDINOTT, NAVIGATING THE CHANGING LANDSCAPE-THE STATE OF LOCAL GOVERN...
STUART HODDINOTT, NAVIGATING THE CHANGING LANDSCAPE-THE STATE OF LOCAL GOVERN...STUART HODDINOTT, NAVIGATING THE CHANGING LANDSCAPE-THE STATE OF LOCAL GOVERN...
STUART HODDINOTT, NAVIGATING THE CHANGING LANDSCAPE-THE STATE OF LOCAL GOVERN...
PPMA - Public Sector People Managers' Association
 
My Dream Job.Group 1 (1).pptxhgdkbdkbjkdbjkbjkbjkd
My Dream Job.Group 1 (1).pptxhgdkbdkbjkdbjkbjkbjkdMy Dream Job.Group 1 (1).pptxhgdkbdkbjkdbjkbjkbjkd
My Dream Job.Group 1 (1).pptxhgdkbdkbjkdbjkbjkbjkd
worryno71
 
2025 Small Grants Fund Applicant Webinar
2025 Small Grants Fund Applicant Webinar2025 Small Grants Fund Applicant Webinar
2025 Small Grants Fund Applicant Webinar
Global Forest Watch
 
ASI Data Insights for Incidents Submitted in 2024
ASI Data Insights for Incidents Submitted in 2024ASI Data Insights for Incidents Submitted in 2024
ASI Data Insights for Incidents Submitted in 2024
AssuranceServicesInt
 
dawsoncitytesetingscrowlingadsMay4_25.ppsx
dawsoncitytesetingscrowlingadsMay4_25.ppsxdawsoncitytesetingscrowlingadsMay4_25.ppsx
dawsoncitytesetingscrowlingadsMay4_25.ppsx
pmenzies
 
Contributi dei parlamentari del PD - Contributi L. 3/2019
Contributi dei parlamentari del PD - Contributi L. 3/2019Contributi dei parlamentari del PD - Contributi L. 3/2019
Contributi dei parlamentari del PD - Contributi L. 3/2019
Partito democratico
 
Hunden Grand Sierra Resort arena project analysis.pdf
Hunden Grand Sierra Resort arena project analysis.pdfHunden Grand Sierra Resort arena project analysis.pdf
Hunden Grand Sierra Resort arena project analysis.pdf
This Is Reno
 
TRAUMA MANAGEMENTrbdheyegdhdhdhdhrd.pptx
TRAUMA MANAGEMENTrbdheyegdhdhdhdhrd.pptxTRAUMA MANAGEMENTrbdheyegdhdhdhdhrd.pptx
TRAUMA MANAGEMENTrbdheyegdhdhdhdhrd.pptx
gaisga4er
 
The Federal Perspective on Coverage of Medications to Treat Obesity: Consider...
The Federal Perspective on Coverage of Medications to Treat Obesity: Consider...The Federal Perspective on Coverage of Medications to Treat Obesity: Consider...
The Federal Perspective on Coverage of Medications to Treat Obesity: Consider...
Congressional Budget Office
 
Mata kuliah Konflik Manajemen SDM FD.pptx
Mata kuliah Konflik Manajemen SDM FD.pptxMata kuliah Konflik Manajemen SDM FD.pptx
Mata kuliah Konflik Manajemen SDM FD.pptx
pikipardede1
 
Lessons Learned from the Decade of Action: The UN Sustainable Development Goa...
Lessons Learned from the Decade of Action: The UN Sustainable Development Goa...Lessons Learned from the Decade of Action: The UN Sustainable Development Goa...
Lessons Learned from the Decade of Action: The UN Sustainable Development Goa...
Energy for One World
 
City of Reno report reveals $1 million in parking fines uncollected
City of Reno report reveals $1 million in parking fines uncollectedCity of Reno report reveals $1 million in parking fines uncollected
City of Reno report reveals $1 million in parking fines uncollected
This Is Reno
 
Indian Finance Acts Explained with Tax Updates
Indian Finance Acts Explained with Tax UpdatesIndian Finance Acts Explained with Tax Updates
Indian Finance Acts Explained with Tax Updates
incometaxindia2027
 
session 3 Good Governance Index- Shabbeer.pptx
session 3 Good Governance Index- Shabbeer.pptxsession 3 Good Governance Index- Shabbeer.pptx
session 3 Good Governance Index- Shabbeer.pptx
GodfreyPrince2
 
西班牙卢森堡商学院毕业证书文凭定制LSB成绩单购买
西班牙卢森堡商学院毕业证书文凭定制LSB成绩单购买西班牙卢森堡商学院毕业证书文凭定制LSB成绩单购买
西班牙卢森堡商学院毕业证书文凭定制LSB成绩单购买
Taqyea
 
DFARS Part 223 - Environment, Energy And Water Efficiency, Renewable Energy T...
DFARS Part 223 - Environment, Energy And Water Efficiency, Renewable Energy T...DFARS Part 223 - Environment, Energy And Water Efficiency, Renewable Energy T...
DFARS Part 223 - Environment, Energy And Water Efficiency, Renewable Energy T...
JSchaus & Associates
 
aaaaaaaaaaaaaaaaaaaaaaaaexit ticket.pptx
aaaaaaaaaaaaaaaaaaaaaaaaexit ticket.pptxaaaaaaaaaaaaaaaaaaaaaaaaexit ticket.pptx
aaaaaaaaaaaaaaaaaaaaaaaaexit ticket.pptx
mhdali1012
 
Warming Hearts Dhabla Distribution in Rajkot
Warming Hearts Dhabla Distribution in RajkotWarming Hearts Dhabla Distribution in Rajkot
Warming Hearts Dhabla Distribution in Rajkot
Power SEO
 
Lessons Learned from the Decade of Action: The Paris Agreement and Beyond (1)...
Lessons Learned from the Decade of Action: The Paris Agreement and Beyond (1)...Lessons Learned from the Decade of Action: The Paris Agreement and Beyond (1)...
Lessons Learned from the Decade of Action: The Paris Agreement and Beyond (1)...
Energy for One World
 
The Federal Environment for Surface Transportation Infrastructure
The Federal Environment for Surface Transportation InfrastructureThe Federal Environment for Surface Transportation Infrastructure
The Federal Environment for Surface Transportation Infrastructure
Congressional Budget Office
 
My Dream Job.Group 1 (1).pptxhgdkbdkbjkdbjkbjkbjkd
My Dream Job.Group 1 (1).pptxhgdkbdkbjkdbjkbjkbjkdMy Dream Job.Group 1 (1).pptxhgdkbdkbjkdbjkbjkbjkd
My Dream Job.Group 1 (1).pptxhgdkbdkbjkdbjkbjkbjkd
worryno71
 
2025 Small Grants Fund Applicant Webinar
2025 Small Grants Fund Applicant Webinar2025 Small Grants Fund Applicant Webinar
2025 Small Grants Fund Applicant Webinar
Global Forest Watch
 
ASI Data Insights for Incidents Submitted in 2024
ASI Data Insights for Incidents Submitted in 2024ASI Data Insights for Incidents Submitted in 2024
ASI Data Insights for Incidents Submitted in 2024
AssuranceServicesInt
 
dawsoncitytesetingscrowlingadsMay4_25.ppsx
dawsoncitytesetingscrowlingadsMay4_25.ppsxdawsoncitytesetingscrowlingadsMay4_25.ppsx
dawsoncitytesetingscrowlingadsMay4_25.ppsx
pmenzies
 
Ad

Navigating numbers: How data are used to create statistics

  • 2. 2 Hello, we’re the Office for National Statistics, or the ONS. We’re an independent producer of official statistics and the recognised national statistical institute of the UK. At the ONS, we collect, analyse and disseminate statistics about the UK's economy, society and population. The government, charities, community groups, businesses and individuals use these statistics to make informed decisions on important issues that affect us all - everything from healthcare and school places to environmental issues. We have created five toolkits based on real world themes. Each toolkit introduces a different tool or dataset to help you explore some of the data we use in our statistics. You will also find three activity or project ideas in each toolkit to get you started.
  • 3. 3 Main principles in data and statistics The following slides will help you get familiar with some common terms and statistical concepts, including: 1. collecting data and making statistics 2. sample design and estimation 3. time series 4. index numbers 5. measuring uncertainty 6. communicating data and statistics
  • 4. 4
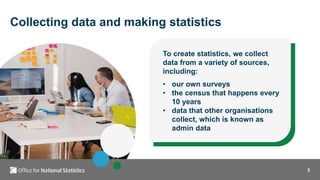
  • 5. 5 To create statistics, we collect data from a variety of sources, including: • our own surveys • the census that happens every 10 years • data that other organisations collect, which is known as admin data Collecting data and making statistics
  • 6. 6
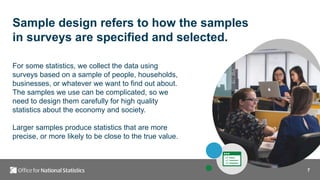
  • 7. 7 Sample design refers to how the samples in surveys are specified and selected. For some statistics, we collect the data using surveys based on a sample of people, households, businesses, or whatever we want to find out about. The samples we use can be complicated, so we need to design them carefully for high quality statistics about the economy and society. Larger samples produce statistics that are more precise, or more likely to be close to the true value.
  • 8. 8 Stratified sampling Stratification is dividing the list we are sampling from into groups, or strata, and drawing independent samples from each of these strata. This is more efficient than using a simple random sampling approach, which could by chance result in a sample that does not look like the population. For example, a health survey sampling more people in older age groups would show more ill health than the true health of the population. Or it could work the other way with more younger people. If we know information about the people on the list, or sampling frame, we can divide it into strata, such as age group. Then we can decide how much of the sample to take from each stratum. For many surveys, we would sample in proportion to the size of the stratum. For example, if 10% of addresses were in a region, we would draw 10% of the sample from that region.
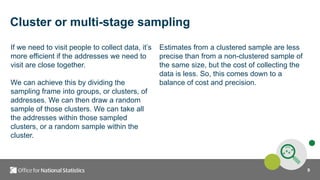
  • 9. 9 Cluster or multi-stage sampling If we need to visit people to collect data, it’s more efficient if the addresses we need to visit are close together. We can achieve this by dividing the sampling frame into groups, or clusters, of addresses. We can then draw a random sample of those clusters. We can take all the addresses within those sampled clusters, or a random sample within the cluster. Estimates from a clustered sample are less precise than from a non-clustered sample of the same size, but the cost of collecting the data is less. So, this comes down to a balance of cost and precision.
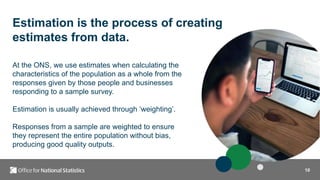
  • 10. 10 Estimation is the process of creating estimates from data. At the ONS, we use estimates when calculating the characteristics of the population as a whole from the responses given by those people and businesses responding to a sample survey. Estimation is usually achieved through ‘weighting’. Responses from a sample are weighted to ensure they represent the entire population without bias, producing good quality outputs.
  • 11. 11
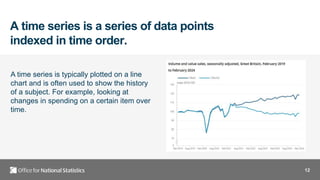
  • 12. 12 A time series is a series of data points indexed in time order. A time series is typically plotted on a line chart and is often used to show the history of a subject. For example, looking at changes in spending on a certain item over time.
  • 13. 13
  • 14. 14 What are index numbers? Index numbers are used to measure changes and simplify comparisons.
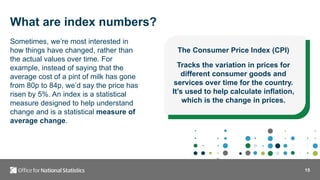
  • 15. 15 What are index numbers? Sometimes, we’re most interested in how things have changed, rather than the actual values over time. For example, instead of saying that the average cost of a pint of milk has gone from 80p to 84p, we’d say the price has risen by 5%. An index is a statistical measure designed to help understand change and is a statistical measure of average change. The Consumer Price Index (CPI) Tracks the variation in prices for different consumer goods and services over time for the country. It’s used to help calculate inflation, which is the change in prices.
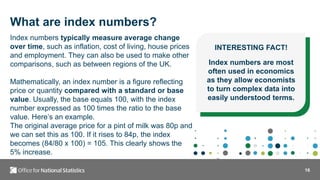
  • 16. 16 Index numbers typically measure average change over time, such as inflation, cost of living, house prices and employment. They can also be used to make other comparisons, such as between regions of the UK. Mathematically, an index number is a figure reflecting price or quantity compared with a standard or base value. Usually, the base equals 100, with the index number expressed as 100 times the ratio to the base value. Here’s an example. The original average price for a pint of milk was 80p and we can set this as 100. If it rises to 84p, the index becomes (84/80 x 100) = 105. This clearly shows the 5% increase. INTERESTING FACT! Index numbers are most often used in economics as they allow economists to turn complex data into easily understood terms. What are index numbers?
  • 17. 17
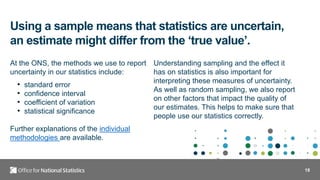
  • 18. 18 Using a sample means that statistics are uncertain, an estimate might differ from the ‘true value’. At the ONS, the methods we use to report uncertainty in our statistics include: • standard error • confidence interval • coefficient of variation • statistical significance Further explanations of the individual methodologies are available. Understanding sampling and the effect it has on statistics is also important for interpreting these measures of uncertainty. As well as random sampling, we also report on other factors that impact the quality of our estimates. This helps to make sure that people use our statistics correctly.
  • 19. 19
  • 20. 20 Communicating data and statistics is more than just presenting the numbers. At the ONS, we deal with a lot of complex data and concepts. Good communication can help ensure data is interpreted accurately and used appropriately. It also allows us to be completely open about the methods we use to collect data and calculate statistics. Some common challenges include: • working out which statistical terms and classifications can be simplified, and which cannot • finding out which facts are most important and deciding whether to make those more prominent • making it clear what conclusions the statistics do, and do not, support
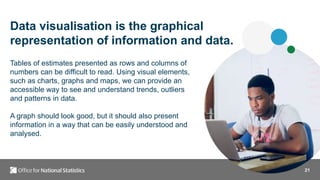
  • 21. 21 Data visualisation is the graphical representation of information and data. Tables of estimates presented as rows and columns of numbers can be difficult to read. Using visual elements, such as charts, graphs and maps, we can provide an accessible way to see and understand trends, outliers and patterns in data. A graph should look good, but it should also present information in a way that can be easily understood and analysed.
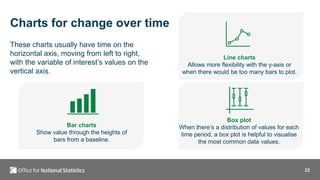
  • 22. 22 Charts for change over time These charts usually have time on the horizontal axis, moving from left to right, with the variable of interest’s values on the vertical axis. Bar charts Show value through the heights of bars from a baseline. Line charts Allows more flexibility with the y-axis or when there would be too many bars to plot. Box plot When there’s a distribution of values for each time period, a box plot is helpful to visualise the most common data values.
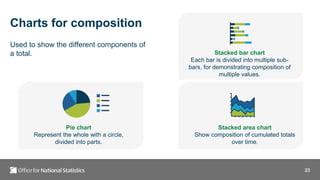
  • 23. 23 Charts for composition Used to show the different components of a total. Pie chart Represent the whole with a circle, divided into parts. Stacked bar chart Each bar is divided into multiple sub- bars, for demonstrating composition of multiple values. Stacked area chart Show composition of cumulated totals over time.
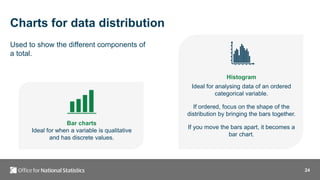
  • 24. 24 Charts for data distribution Used to show the different components of a total. Bar charts Ideal for when a variable is qualitative and has discrete values. Histogram Ideal for analysing data of an ordered categorical variable. If ordered, focus on the shape of the distribution by bringing the bars together. If you move the bars apart, it becomes a bar chart.
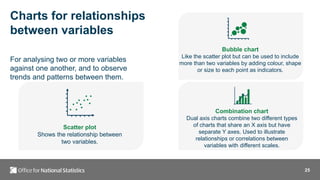
  • 25. 25 Charts for relationships between variables For analysing two or more variables against one another, and to observe trends and patterns between them. Scatter plot Shows the relationship between two variables. Bubble chart Like the scatter plot but can be used to include more than two variables by adding colour, shape or size to each point as indicators. Combination chart Dual axis charts combine two different types of charts that share an X axis but have separate Y axes. Used to illustrate relationships or correlations between variables with different scales.